Paper I — Q2
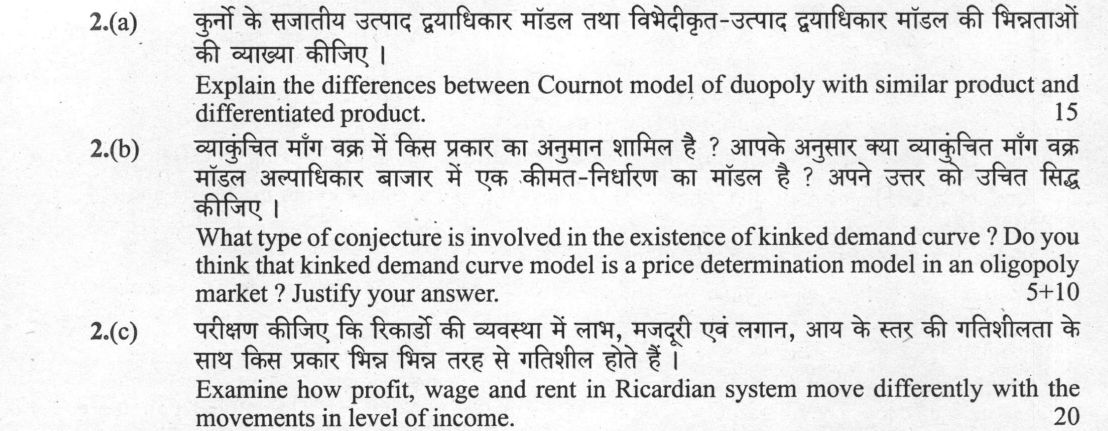
(a) Explain the differences between Cournot model of duopoly with similar product and differentiated product. (15 marks) (b) What…
Explain the differences between Cournot model of duopoly with similar product and differentiated product. 15 marks
What type of conjecture is involved in the existence of kinked demand curve ? Do you think that kinked demand curve model is a price determination model in an oligopoly market ? Justify your answer. (5+10 marks)
Examine how profit, wage and rent in Ricardian system move differently with the movements in level of income. 20 marks
हिंदी में प्रश्न पढ़ें
कुर्नों के सजातीय उत्पाद द्वयाधिकार मॉडल तथा विभेदीकृत-उत्पाद द्वयाधिकार मॉडल की भिन्नताओं की व्याख्या कीजिए । (15 अंक)
व्याकुंचित मांग वक्र में किस प्रकार का अनुमान शामिल है ? आपके अनुसार क्या व्याकुंचित मांग वक्र मॉडल अल्पाधिकार बाजार में एक कीमत-निर्धारण का मॉडल है ? अपने उत्तर को उचित सिद्ध कीजिए । (5+10 अंक)
परीक्षण कीजिए कि रिकार्डों की व्यवस्था में लाभ, मजदूरी एवं लगान, आय के स्तर की गतिशीलता के साथ किस प्रकार भिन्न भिन्न तरह से गतिशील होते हैं । (20 अंक)
Model answer
Written by UPSC Answer Check against this question's marking rubric, to the expected length. UPSC does not publish answers for Mains — this is one way to score well, not an official key.
While oligopoly models analyze strategic firm behavior under imperfect competition, classical distribution theory examines functional factor shares during economic growth and accumulation.
Cournot Duopoly: Homogeneous vs Differentiated Product
In the homogeneous Cournot model, two firms produce identical goods facing a unified market inverse demand curve P = a - b(q₁ + q₂). With constant marginal cost c, each firm maximizes profit taking the rival’s output as given, yielding symmetric linear reaction functions q₁ = (a - c - bq₂)/2b and q₂ = (a - c - bq₁)/2b. The unique Nash equilibrium results in total output Q = 2(a - c)/3b and a single market-clearing price P = (a + 2c)/3, which settles strictly between the monopoly price and the perfectly competitive price (P = c).
Under product differentiation, firms produce imperfect substitutes facing distinct inverse demand curves: P₁ = a₁ - b₁ q₁ - d q₂ and P₂ = a₂ - b₂ q₂ - d q₁, where d measures product substitutability (cross-elasticity). The reaction function for firm 1 becomes q₁ = (a₁ - c₁ - d q₂)/2b₁. A single market price ceases to exist. Instead, the equilibrium generates price dispersion governed by cross-price effects and brand loyalty. If cost structures or consumer preferences diverge, the model yields asymmetric equilibrium prices and market shares.
Kinked Demand Curve and Price Stickiness
Paul Sweezy’s kinked demand model is founded on an asymmetric followership (or matching) conjecture: a firm assumes that if it raises its price above the prevailing level P₀, competitors will not follow (making demand elastic above P₀), but if it lowers its price, rivals will match the cut immediately to preserve market share (making demand inelastic below P₀).
This behavioral asymmetry produces a sharp kink at the current price and a corresponding vertical discontinuity (gap) in the marginal revenue (MR) curve. Consequently, the kinked demand curve is not a price determination model. It takes the benchmark price P₀ as exogenously given through historical precedent or collusion, without explaining how it was established. Its analytical value lies entirely in explaining price rigidity: any shift in marginal cost within the vertical gap of the MR curve leaves the equilibrium price and quantity unchanged.
Ricardian Distribution: Rent, Wage, and Profit
In the Ricardian system, economic expansion and capital accumulation raise national income, increasing the demand for food (corn). To feed an expanding population, cultivation extends to inferior soils (extensive margin) and applies successive doses of capital and labor to existing plots (intensive margin), encountering diminishing returns.
Income distribution shifts across factors as follows:
- Rent: Rent is a differential surplus arising on intra-marginal lands due to fertility differences. As the marginal cost of corn rises on the least fertile plot (where rent is zero), product price rises to cover that cost. Rent on superior lands rises continuously: Rent = Output - (Wages + Normal Profit on Marginal Land).
- Wages: Real wages are anchored at the physiological subsistence level by the Malthusian population mechanism. However, because producing corn on marginal land requires more labor, the value of the subsistence basket rises. Thus, the nominal wage bill absorbs a rising share of output.
- Profit: Profit is the residual surplus after paying wages on marginal land (Π = Y_margin - W). As rising corn costs elevate the wage bill, profits are progressively squeezed across all lands.
To illustrate mathematically, suppose successive grades of land A, B, and C yield 100, 80, and 60 units of corn per dose of capital-labor, with subsistence wages fixed at 40 units:
- Cultivating Land A only: Total Output = 100; Rent = 0; Wage = 40; Profit = 60.
- Expanding to Land B: Land A Rent = 20, Profit = 40; Land B Rent = 0, Profit = 40 (Wage = 40 on both).
- Expanding to Land C: Land A Rent = 40, Land B Rent = 20, Land C Rent = 0; Wage = 40; Profit falls to 20 across all plots.
As accumulation continues, the falling rate of profit eventually reaches zero, driving the economy into the Ricardian stationary state.
While modern oligopoly theory focuses on strategic price rigidities under imperfect competition, the Ricardian model unifies value and distribution into a macroeconomic dynamic, demonstrating that agricultural resource constraints inevitably redistribute income from productive capital to unproductive land, culminating in economic stagnation.
What "Explain" is asking you to do
Make the working of something clear — what sets it off, what follows from what, and what it produces. Explain is the Commission's mechanism word: it dominates the technical papers and the “explain why” stems, where the marks sit in the causal chain and not in the label.
Structure that answers it
State what it is → the initiating condition → the chain of cause, step by step → an instance where it plays out → what the chain produces
Where marks are lost
Describing what something looks like instead of why it works that way. Naming the stages without linking them reads as description too.
How this answer will be evaluated
Approach
Framework: UPSC Economics Paper 1 (Microeconomics & Classical Theory). (a) explain: definition/context > points in order > small example > short close | (b) justify: claim > 3-4 reasons > evidence > conclusion | (c) examine: intro > how/why with reasoning > evidence > conclusion Full marks: Rigorous derivation, clear diagrams, precise terminology, and strong justification of models.
Key points expected
- Define Cournot assumption (quantity choice, zero conjecture)
- Derive or state reaction functions for homogeneous case
- Explain demand shift/elasticity change in differentiated case
- Compare equilibrium price and output levels
- Identify 'asymmetric' or 'non-parallel' conjecture
- Explain the logic of the kink (follow cuts, ignore hikes)
- Link kink to discontinuous MR curve
- Justify why it explains price rigidity
Evaluation rubric
Each sub-part is marked on its own, against the marks and word limit printed on the paper.
- (a) Contrast Cournot duopoly outcomes for homogeneous vs. differentiated products. 15 marks
explain— definition/context → points in order → small example → short close
Must cover
- Define Cournot assumption (quantity choice, zero conjecture)
- Derive or state reaction functions for homogeneous case
- Explain demand shift/elasticity change in differentiated case
- Compare equilibrium price and output levels
Loses marks
- Confusing Cournot with Bertrand (price competition)
- Failing to distinguish product characteristics
- Verbal description without model logic
Earns more
- Mention Bertrand paradox as a contrast
- Reference specific demand functions (linear vs. non-linear)
- Discuss market power implications
Extra mark
- Draw reaction function diagrams for both cases
- Cite specific economist (e.g., Cournot, Edgeworth)
- (b) Identify the conjecture in kinked demand and evaluate its validity as a price model. 15 marks
justify— claim → 3-4 reasons → evidence → conclusion
Must cover
- Identify 'asymmetric' or 'non-parallel' conjecture
- Explain the logic of the kink (follow cuts, ignore hikes)
- Link kink to discontinuous MR curve
- Justify why it explains price rigidity
Loses marks
- Confusing with kinked supply curve
- Failing to link conjecture to the kink's existence
- Treating it as a general equilibrium model
Earns more
- Mention the 'Swiss Cross' or 'S-shaped' demand curve
- Discuss the 'sticky price' phenomenon
- Reference the model's origin (Paley, Robinson)
Extra mark
- Draw the kinked demand and discontinuous MR diagram
- Mention specific oligopoly examples (e.g., cement, steel)
- (c) Analyze the movement of profit, wage, and rent in the Ricardian system with income changes. 20 marks
examine— intro → how/why with reasoning → evidence → conclusion
Must cover
- Define the Ricardian system (labor theory of value)
- Explain the 'iron law of wages' (subsistence level)
- Describe the relationship between population and land
- Show how rent rises as income/population grows
Loses marks
- Confusing with Marshallian or Keynesian models
- Failing to link rent to land scarcity
- Ignoring the role of population growth
Earns more
- Mention the 'Ricardian rent' or 'differential rent'
- Discuss the 'corn model' or 'wage fund'
- Explain the 'stationary state' concept
Extra mark
- Draw the Ricardian model diagram (marginal land)
- Cite specific economist (e.g., Ricardo, Malthus)
Practice this exact question
Write your answer and it is marked point by point against the model answer above — what you covered, what you missed, what you got wrong.
Evaluate my answer →More from Economics 2021 Paper I
- Q1 Answer the following questions in about 150 words each: (a) Compare and contrast Marshall…
- Q2 (a) Explain the differences between Cournot model of duopoly with similar product and dif…
- Q3 (a) Show that differences in underlying expectation lead to differences in Keynesian and…
- Q4 (a) Derive short-run aggregate supply curve following Lucas, when expectations are not re…
- Q5 Answer the following questions in about 150 words each: (a) Explain Rosenstein-Rodan's vi…