Paper II — Q7
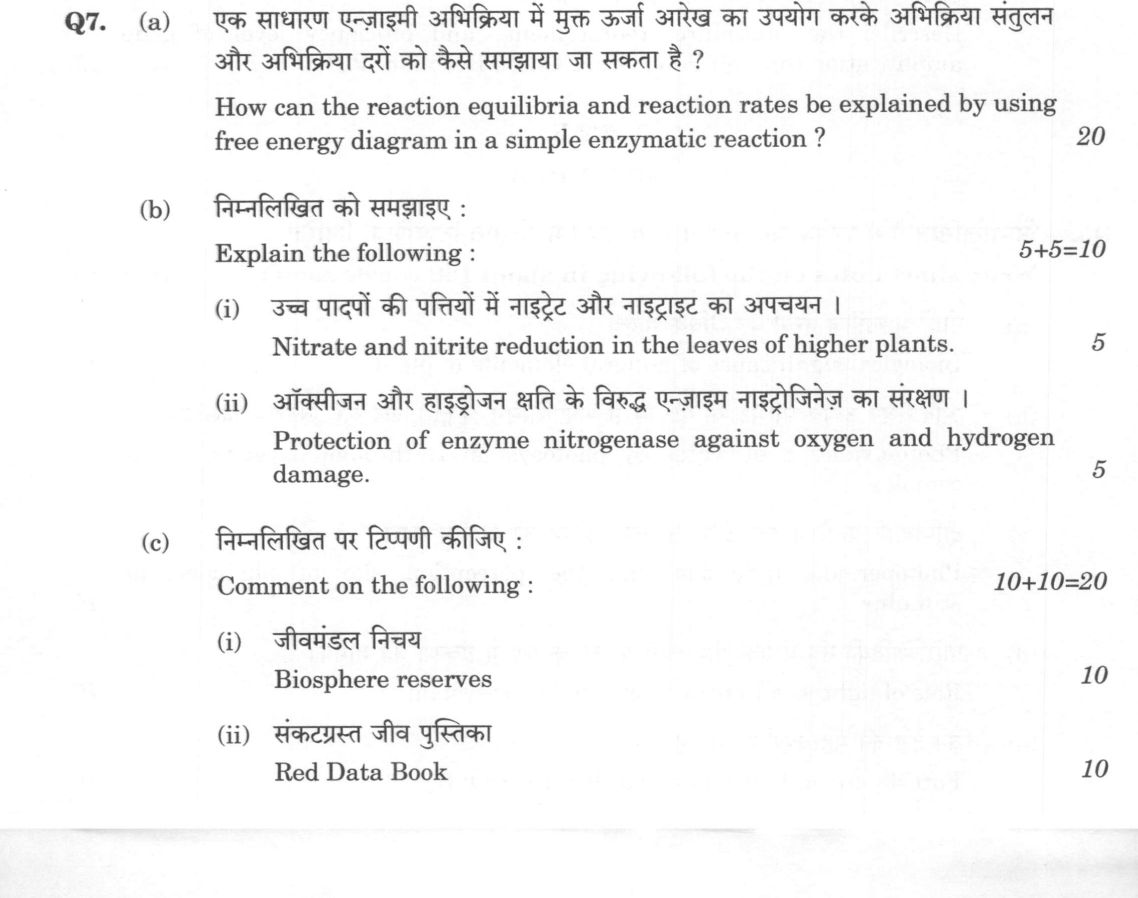
(a) How can the reaction equilibria and reaction rates be explained by using free energy diagram in a simple enzymatic reaction ?…
How can the reaction equilibria and reaction rates be explained by using free energy diagram in a simple enzymatic reaction ? 20 marks
Explain the following : 5+5=10
Nitrate and nitrite reduction in the leaves of higher plants. 5 marks
Protection of enzyme nitrogenase against oxygen and hydrogen damage. 5 marks
Comment on the following : 10+10=20
Biosphere reserves 10
Red Data Book 10
हिंदी में प्रश्न पढ़ें
एक साधारण एन्जाइमी अभिक्रिया में मुक्त ऊर्जा आरेख का उपयोग करके अभिक्रिया संतुलन और अभिक्रिया दरों को कैसे समझाया जा सकता है ? 20 marks
निम्नलिखित को समझाइए : 5+5=10
उच्च पादपों की पत्तियों में नाइट्रेट और नाइट्राइट का अपचयन । 5
ऑक्सीजन और हाइड्रोजन क्षति के विरुद्ध एन्जाइम नाइट्रोजिनेज का संरक्षण । 5
निम्नलिखित पर टिप्पणी कीजिए : 10+10=20
जीवमंडल निचय 10
संकटग्रस्त जीव पुस्तिका 10
Model answer
Written by UPSC Answer Check against this question's marking rubric, to the expected length. UPSC does not publish answers for Mains — this is one way to score well, not an official key.
Enzymatic Kinetics and Nitrogen Metabolism
Enzymes are biological catalysts that accelerate reaction rates without altering the thermodynamic equilibrium. In a simple enzymatic reaction, the free energy diagram illustrates the energy profile from substrate (S) to product (P). The uncatalyzed reaction follows a high-energy path with a large activation energy barrier (Δ G^ddagger). The catalyzed pathway involves the formation of an enzyme-substrate complex (ES), which stabilizes the transition state, denoted as ES‡. By lowering the activation energy (Δ G^ddagger) required to reach ES‡, the enzyme increases the rate of reaction. Crucially, the overall free energy change (Δ G) between S and P remains constant, meaning the equilibrium constant (K_eq) is unaffected; enzymes only hasten the approach to equilibrium.
Nitrate and Nitrite Reduction in Leaves
Nitrogen assimilation in higher plants occurs in two distinct steps. First, nitrate (NO₃⁻) is reduced to nitrite (NO₂⁻) in the cytosol by nitrate reductase (NR). NR is a molybdenum-iron enzyme that uses NADH as an electron donor. Second, nitrite is transported into the chloroplasts, where nitrite reductase (NiR) reduces it to ammonium (NH₄⁺). NiR contains an iron-sulfur center and siroheme, and it utilizes reduced ferredoxin generated by photosynthesis as its electron donor. This spatial separation ensures that toxic nitrite is rapidly converted to ammonium, which is then assimilated into glutamine via the GS-GOGAT cycle.
Protection of Nitrogenase
Nitrogenase, the enzyme responsible for N₂ fixation, is highly sensitive to both oxygen and hydrogen. Protection against oxygen damage is achieved through multiple mechanisms. In legume root nodules, leghemoglobin binds oxygen, maintaining low free O₂ levels while allowing diffusion to bacteroids for respiration. High respiratory rates in bacteroids further consume oxygen. Additionally, conformational protection occurs when the Fe-protein of nitrogenase undergoes a conformational change in the presence of oxygen, shielding the active site. In cyanobacteria, heterocysts provide physical protection via thick cell walls and lack Photosystem II, creating an anaerobic microenvironment.
Protection against hydrogen damage is equally critical. Nitrogenase produces hydrogen (H₂) as a byproduct of N₂ reduction. Accumulation of H₂ can inhibit the enzyme by competing for the active site. To prevent this, many nitrogen-fixing bacteria and cyanobacteria possess an uptake hydrogenase. This enzyme catalyzes the oxidation of H₂ back to protons and electrons, which are fed into the electron transport chain. This recycling mechanism prevents H₂ buildup, thereby avoiding product inhibition and ensuring the efficiency of nitrogen fixation.
Biosphere Reserves
Biosphere reserves are designated under the UNESCO Man and the Biosphere (MAB) programme. They follow a zonation system comprising three zones: the core zone, which is strictly protected for conservation; the buffer zone, surrounding the core, where only research and education are permitted; and the transition zone, where sustainable development activities like agriculture and tourism are allowed. India has several such reserves, including Nilgiri, Nanda Devi, and Sundarbans. These reserves serve as models for reconciling the conservation of biodiversity with the sustainable use of natural resources, providing areas for monitoring, research, and environmental education.
Red Data Book
The Red Data Book, published by the IUCN, is a comprehensive list of threatened species. It categorizes species based on their risk of extinction, including Extinct (EX), Extinct in the Wild (EW), Critically Endangered (CR), Endangered (EN), and Vulnerable (VU). This classification is vital for conservation prioritization and policy formulation. In India, several plant species are listed under these categories. For instance, Santalum album (Sandalwood) is Endangered due to over-exploitation, while Nepenthes khasiana (Pitcher Plant) is Critically Endangered due to habitat loss. Saussurea obvallata (Brahma Kamal) is also threatened. The Red Data Book provides the scientific basis for legal protection under the Wildlife Protection Act and guides conservation efforts to prevent further biodiversity loss.
In conclusion, understanding the enzymatic mechanisms of nitrogen metabolism and the protective strategies of nitrogenase is fundamental to enhancing agricultural productivity. Simultaneously, the establishment of biosphere reserves and the monitoring of threatened species through the Red Data Book are essential for preserving the ecological balance. Together, these biological and conservation strategies address the dual challenges of food security and biodiversity conservation.
What "Explain" is asking you to do
Make the working of something clear — what sets it off, what follows from what, and what it produces. Explain is the Commission's mechanism word: it dominates the technical papers and the “explain why” stems, where the marks sit in the causal chain and not in the label.
Structure that answers it
State what it is → the initiating condition → the chain of cause, step by step → an instance where it plays out → what the chain produces
Where marks are lost
Describing what something looks like instead of why it works that way. Naming the stages without linking them reads as description too.
How this answer will be evaluated
Approach
Framework: Botany Paper 2: Define > Structure/Process > Labelled Diagram > Significance. (a) explain: definition/context > points in order > small example > short close | (b(i)) explain: definition/context > points in order > small example > short close | (b(ii)) explain: definition/context > points in order > small example > short close | (c(i)) comment: context > arguments both sides > judgment > close | (c(ii)) comment: context > arguments both sides > judgment > close Full marks: All parts fully addressed with labelled diagrams, exact terminology, and specific examples; no factual errors.
Key points expected
- Labelled free energy diagram (E, ES, EP, P)
- Activation energy (Ea) reduction by enzyme
- Transition state stabilization mechanism
- Equilibrium constant (Keq) vs rate (kcat) distinction
- Nitrate reductase (NR) reaction (NO3- to NO2-)
- Nitrite reductase (NiR) reaction (NO2- to NH4+)
- Cofactors (NADH, FAD, Fe-S clusters)
- Location (chloroplasts/cytosol)
Evaluation rubric
Each sub-part is marked on its own, against the marks and word limit printed on the paper.
- (a) Free energy diagram linking reaction rates and equilibrium in enzymatic catalysis. 20 marks
explain— definition/context → points in order → small example → short close
Must cover
- Labelled free energy diagram (E, ES, EP, P)
- Activation energy (Ea) reduction by enzyme
- Transition state stabilization mechanism
- Equilibrium constant (Keq) vs rate (kcat) distinction
Loses marks
- Unlabelled or missing diagram
- Confusing equilibrium with rate
- No mention of transition state
Earns more
- Mention of Michaelis-Menten kinetics
- Comparison of catalyzed vs uncatalyzed pathways
- Reference to Gibbs free energy (ΔG)
Extra mark
- Specific enzyme example (e.g., Carbonic Anhydrase)
- Quantitative values for Ea reduction
- (b(i)) Biochemical pathway of nitrate and nitrite reduction in higher plant leaves. 5 marks
explain— definition/context → points in order → small example → short close
Must cover
- Nitrate reductase (NR) reaction (NO3- to NO2-)
- Nitrite reductase (NiR) reaction (NO2- to NH4+)
- Cofactors (NADH, FAD, Fe-S clusters)
- Location (chloroplasts/cytosol)
Loses marks
- Missing enzyme names
- Incorrect electron donor/acceptor
Earns more
- Mention of assimilation into amino acids
- Regulation by light/dark cycles
Extra mark
- Specific gene names (e.g., NIA1)
- Link to crop nitrogen use efficiency
- (b(ii)) Mechanisms protecting nitrogenase from oxygen and hydrogen damage. 5 marks
explain— definition/context → points in order → small example → short close
Must cover
- Leghemoglobin role in O2 scavenging
- Fe protein (FeMo-co) oxygen sensitivity
- Hydrogenase role in H2 removal
- Glycine betaine or other protective molecules
Loses marks
- No mention of leghemoglobin
- Confusing nitrogenase with nitrate reductase
Earns more
- Mention of nodulation process
- Link to symbiotic vs free-living bacteria
Extra mark
- Specific Rhizobium species
- Recent biotech application in crop engineering
- (c(i)) Context, arguments, and judgment on Biosphere Reserves. 10 marks
comment— context → arguments both sides → judgment → close
Must cover
- Definition and IUCN/MAB criteria
- Zonal structure (core, buffer, transition)
- Conservation vs development balance
- Examples (e.g., Nilgiri, Sundarbans)
Loses marks
- No mention of zonal structure
- Vague generalities without examples
Earns more
- Mention of UNESCO Man and Biosphere Programme
- Link to biodiversity hotspots
Extra mark
- Specific Indian Biosphere Reserve data
- Recent policy changes
- (c(ii)) Context, arguments, and judgment on Red Data Book. 10 marks
comment— context → arguments both sides → judgment → close
Must cover
- Definition and IUCN Red List categories
- Criteria for threat assessment (population decline)
- Conservation significance and policy impact
- Examples of threatened species
Loses marks
- No mention of IUCN categories
- Confusing Red Data Book with other lists
Earns more
- Mention of IUCN Red List of Threatened Species
- Link to CITES or national conservation laws
Extra mark
- Specific species with current status
- Recent updates or revisions
Practice this exact question
Write your answer and it is marked point by point against the model answer above — what you covered, what you missed, what you got wrong.
Evaluate my answer →More from Botany 2023 Paper II
- Q4 (a) Describe the structure, kinds, chemical nature, origin and functions of lysosomes. 20…
- Q5 Write short notes on the following in about 150 words each : 10×5=50 (a) Biological signi…
- Q6 (a) What are nastic movements, their types and mechanism ? Explain. 15 (b) How is the tra…
- Q7 (a) How can the reaction equilibria and reaction rates be explained by using free energy…
- Q8 (a) (i) How do the three stages in fatty acid oxidation converge to conserve energy as AT…