Paper I — Q2
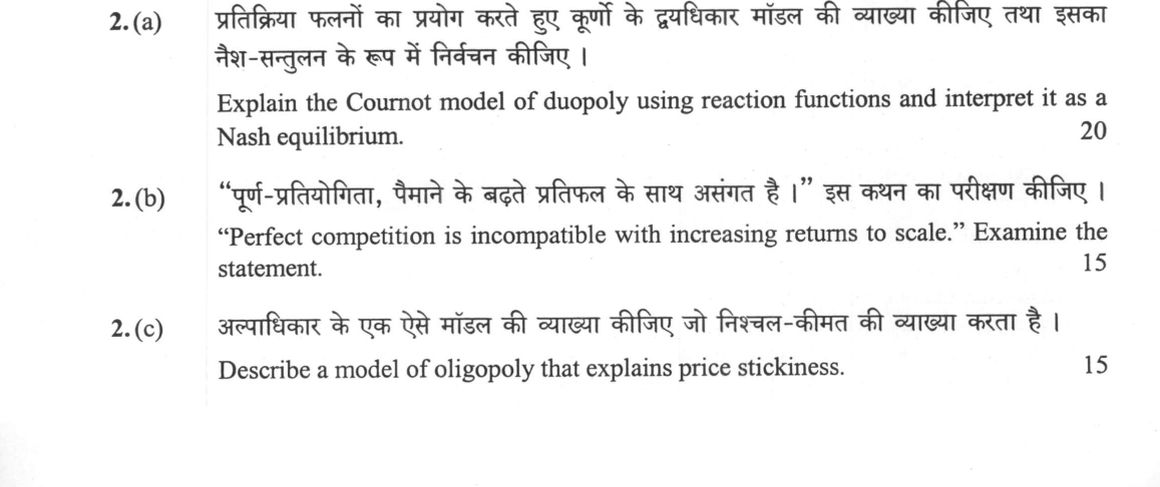
(a) Explain the Cournot model of duopoly using reaction functions and interpret it as a Nash equilibrium. (20 marks) (b)…
Explain the Cournot model of duopoly using reaction functions and interpret it as a Nash equilibrium. 20 marks
"Perfect competition is incompatible with increasing returns to scale." Examine the statement. 15 marks
Describe a model of oligopoly that explains price stickiness. 15 marks
हिंदी में प्रश्न पढ़ें
प्रतिक्रिया फलनों का प्रयोग करते हुए कुर्नों के द्वयधिकार मॉडल की व्याख्या कीजिए तथा इसका नैश-संतुलन के रूप में निर्वचन कीजिए। (20 अंक)
"पूर्ण-प्रतियोगिता, पैमाने के बढ़ते प्रतिफल के साथ असंगत है।" इस कथन का परीक्षण कीजिए। (15 अंक)
अल्पाधिकार के एक ऐसे मॉडल की व्याख्या कीजिए जो निश्चल-कीमत की व्याख्या करता है। (15 अंक)
Model answer
Written by UPSC Answer Check against this question's marking rubric, to the expected length. UPSC does not publish answers for Mains — this is one way to score well, not an official key.
Cournot Duopoly and Nash Equilibrium
Consider a homogeneous product duopoly with a linear market demand P = a - b(q₁ + q₂) and symmetric constant marginal cost c, where a > c. Firm 1 maximizes profit π₁ = [a - b(q₁ + q₂) - c]q₁. The first-order condition (∂ π₁)/(∂ q₁) = a - 2bq₁ - bq₂ - c = 0 yields Firm 1's reaction function:
q₁ = R₁(q₂) = (a - c - bq₂)/2b
Symmetrically, Firm 2's reaction function is:
q₂ = R₂(q₁) = (a - c - bq₁)/2b
Solving these equations simultaneously yields the equilibrium individual outputs:
q₁^* = q₂^* = (a - c)/3b
Aggregate industry output is Q^* = (2(a - c))/3b, and market price settles at P^* = (a + 2c)/3.
In game-theoretic terms, the Cournot equilibrium represents a pure-strategy Nash equilibrium. Each firm's output choice is its best response to the observed output of the other. At the intersection of R₁(q₂) and R₂(q₁), neither firm has an incentive to deviate unilaterally because any deviation reduces individual profit. Aggregate Cournot output is two-thirds of competitive output (Q_C = (a-c)/b) and exceeds monopoly output (Q_M = (a-c)/2b). Market price and consumer welfare sit intermediate between monopoly and perfect competition, generating a moderate deadweight loss.
Incompatibility of Perfect Competition with Increasing Returns to Scale
Perfect competition requires price-taking behavior where profit-maximizing equilibrium requires price to equal long-run marginal cost (P = LMC) alongside non-negative profits (P ≥ LAC). Increasing returns to scale (IRS) dictate that output expands more than proportionally to inputs, causing the long-run average cost curve (LAC) to decline continuously over all relevant output ranges. Mathematically, falling average cost implies that marginal cost lies strictly below average cost (LMC < LAC).
If a competitive firm sets P = LMC under IRS, then P < LAC, which inflicts unavoidable economic losses and precludes long-run cost recovery. Furthermore, declining unit costs grant larger firms an insurmountable cost advantage: a single firm expanding output reduces average costs, undercuts smaller competitors, and drives the market toward natural monopoly. Consequently, a large-group atomistic market structure collapses.
While Edward Chamberlin demonstrated that differentiated products can sustain a large group under IRS through monopolistic competition with P = LAC, homogeneous product markets cannot remain competitive. William Baumol’s contestable markets theory resolves this dilemma by showing that where sunk costs are zero, the threat of "hit-and-run" entry disciplines the natural monopolist to set P = LAC, eliminating supernormal profits without requiring a competitive market structure.
Price Stickiness in Oligopoly
Paul Sweezy’s Kinked Demand Curve model explains structural price rigidity in oligopolies through asymmetric conjectures. A firm anticipates that rivals will match price cuts to protect market share, making the demand curve inelastic for price reductions (e_d < 1). Conversely, rivals will not match price increases, making demand elastic for price hikes (e_d > 1).
This behavioral asymmetry produces a sharp kink at the prevailing price-output point (P₀, Q₀). Because marginal revenue depends on the slope of demand, the kink creates a vertical discontinuity (gap) in the marginal revenue (MR) curve directly beneath the kink. As long as the firm's marginal cost (MC) curve shifts within this vertical gap, the profit-maximizing condition MR = MC continues to occur at the exact same output Q₀ and price P₀. Moderate variations in input costs do not translate into price changes, causing price stickiness.
Gregory Mankiw’s menu cost model supplements this framework by demonstrating that small fixed costs of changing prices deter nominal price adjustments in oligopolistic settings. In modern platform markets characterized by strong network effects, high fixed costs, and near-zero marginal costs, firms exhibit similar price stickiness. Antitrust authorities, such as the Competition Commission of India (CCI), increasingly encounter these market structures, requiring modern competition policy to weigh static price rigidities against dynamic efficiency gains generated by scale.
What "Explain" is asking you to do
Make the working of something clear — what sets it off, what follows from what, and what it produces. Explain is the Commission's mechanism word: it dominates the technical papers and the “explain why” stems, where the marks sit in the causal chain and not in the label.
Structure that answers it
State what it is → the initiating condition → the chain of cause, step by step → an instance where it plays out → what the chain produces
Where marks are lost
Describing what something looks like instead of why it works that way. Naming the stages without linking them reads as description too.
How this answer will be evaluated
Approach
Framework: Cournot Duopoly Model. (a) explain: definition/context > points in order > small example > short close | (b) examine: intro > how/why with reasoning > evidence > conclusion | (c) describe: define > structure or process in order > labelled diagram > significance Full marks: Rigorous derivation, clear diagrams, precise interpretation, and strong logical flow.
Key points expected
- Define Cournot model assumptions (homogeneous goods, simultaneous output choice)
- Derive reaction functions from profit maximization (MR=MC)
- Graphical representation of reaction functions and intersection
- Interpret intersection as Nash equilibrium (best response to rival)
- Define perfect competition conditions (price taker, zero profit)
- Define increasing returns to scale (IRS) and its cost implications
- Show how IRS leads to declining average costs and market dominance
- Explain why IRS prevents the zero-profit condition of perfect competition
Evaluation rubric
Each sub-part is marked on its own, against the marks and word limit printed on the paper.
- (a) Derive Cournot equilibrium via reaction functions and interpret as Nash equilibrium. 20 marks
explain— definition/context → points in order → small example → short close
Must cover
- Define Cournot model assumptions (homogeneous goods, simultaneous output choice)
- Derive reaction functions from profit maximization (MR=MC)
- Graphical representation of reaction functions and intersection
- Interpret intersection as Nash equilibrium (best response to rival)
Loses marks
- Confusing Cournot (quantity) with Bertrand (price) competition
- Failing to show the best-response logic for Nash equilibrium
- Verbal description without mathematical derivation
Earns more
- Algebraic derivation of equilibrium quantities
- Comparison with monopoly and perfect competition output
- Mention of Cournot's original 1838 formulation
Extra mark
- Extension to N-firm Cournot model
- Mention of specific industry application (e.g., OPEC)
- (b) Analyze the incompatibility of perfect competition with increasing returns to scale. 15 marks
examine— intro → how/why with reasoning → evidence → conclusion
Must cover
- Define perfect competition conditions (price taker, zero profit)
- Define increasing returns to scale (IRS) and its cost implications
- Show how IRS leads to declining average costs and market dominance
- Explain why IRS prevents the zero-profit condition of perfect competition
Loses marks
- Confusing increasing returns to scale with increasing marginal returns
- Failing to link IRS to the breakdown of price-taking behavior
- Asserting incompatibility without logical derivation
Earns more
- Graphical illustration of declining LRAC under IRS
- Mention of natural monopoly as a consequence of IRS
- Reference to economies of scale in specific industries
Extra mark
- Mention of specific economists (e.g., Marshall, Chamberlin)
- Reference to modern platform economies exhibiting IRS
- (c) Describe an oligopoly model that explains price stickiness. 15 marks
describe— define → structure or process in order → labelled diagram → significance
Must cover
- Identify a specific model (e.g., Kinked Demand Curve, Menu Costs)
- Explain the mechanism of the model (e.g., asymmetric rival response)
- Show how the model leads to price rigidity/stickiness
- Graphical representation of the model (e.g., kinked demand curve)
Loses marks
- Describing a model that does not explain price stickiness
- Failing to show the graphical mechanism of the model
- Confusing price stickiness with price leadership
Earns more
- Mention of menu costs as a real-world factor
- Comparison with other oligopoly models (e.g., Cournot, Bertrand)
- Reference to empirical evidence of price stickiness
Extra mark
- Mention of specific economists (e.g., Sweezy, Mankiw)
- Reference to specific industry examples (e.g., gasoline prices)
Practice this exact question
Write your answer and it is marked point by point against the model answer above — what you covered, what you missed, what you got wrong.
Evaluate my answer →More from Economics 2023 Paper I
- Q1 Answer the following questions in about 150 words each: (a) Examine the role of price ela…
- Q2 (a) Explain the Cournot model of duopoly using reaction functions and interpret it as a N…
- Q3 (a) "Under rational expectation hypothesis, systematic monetary policy is ineffective." E…
- Q4 (a) Explain the concept of "sterilization" in the context of monetary approach to balance…
- Q5 Answer the following questions in about 150 words each: (a) "Factor intensity reversal is…