Paper II — Q4
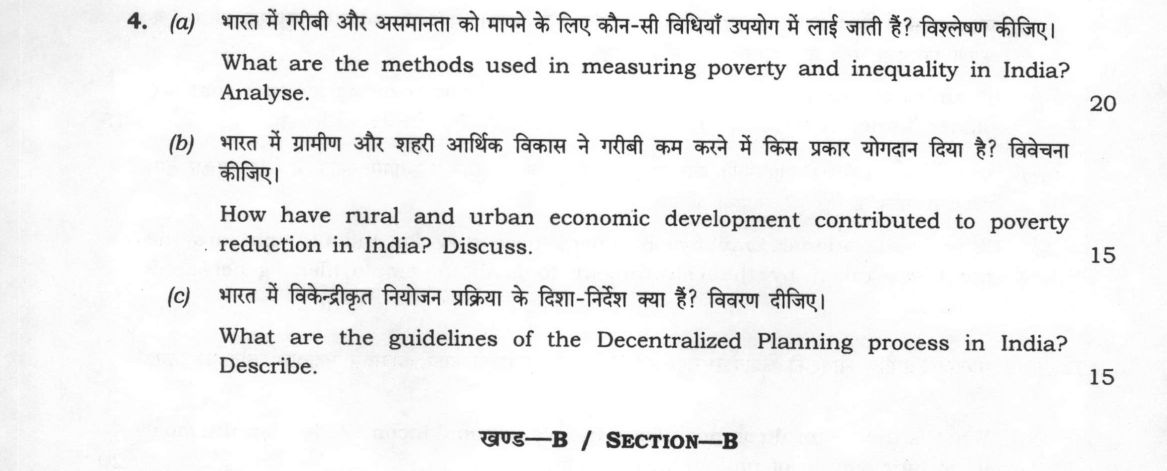
(a) What are the methods used in measuring poverty and inequality in India? Analyse. (20 marks) (b) How have rural and urban…
What are the methods used in measuring poverty and inequality in India? Analyse. 20 marks
How have rural and urban economic development contributed to poverty reduction in India? Discuss. 15 marks
What are the guidelines of the Decentralized Planning process in India? Describe. 15 marks
हिंदी में प्रश्न पढ़ें
भारत में गरीबी और असमानता को मापने के लिए कौन-सी विधियाँ उपयोग में लाई जाती हैं? विश्लेषण कीजिए। (20 अंक)
भारत में ग्रामीण और शहरी आर्थिक विकास ने गरीबी कम करने में किस प्रकार योगदान दिया है? विवेचना कीजिए। (15 अंक)
भारत में विकेन्द्रीकृत नियोजन प्रक्रिया के दिशा-निर्देश क्या हैं? विवरण दीजिए। (15 अंक)
Model answer
Written by UPSC Answer Check against this question's marking rubric, to the expected length. UPSC does not publish answers for Mains — this is one way to score well, not an official key.
Poverty and inequality measurement must be read as a diagnostic chain: poverty lines identify who is poor, inequality indicators show distribution, and together they reveal whether growth is broad-based.
Measurement of poverty and inequality The Tendulkar Committee (2009) set poverty lines of about Rs 26 rural and Rs 33 urban per day at 2011-12 prices, using 2400 kcal rural and 2100 kcal urban plus non-food consumption. Rangarajan (2014) raised them to about Rs 32 rural and Rs 47 urban, using uniform 2100 kcal and a broader non-food basket. Both are useful for trends but limited: calorie norms may understate urban food costs and quality, baskets can miss public services, and NSSO revisions make comparison difficult. The debate is not merely technical: a broader basket can reclassify marginal workers as poor, while a calorie-only line may miss urban housing and transport costs. The MPI, used by NITI Aayog/OPBI, measures 12 deprivations in health, education and standard of living; it captures vulnerability but is less suited to rapid annual monitoring. For inequality, the Lorenz curve maps cumulative income shares; the Gini coefficient compresses it into a 0-1 measure; the Palma ratio compares top 10 per cent with bottom 40 per cent; and the Theil index decomposes inequality into within-state and between-state components, with Indian evidence generally showing within-state inequality larger. NSSO remains the principal source for consumption and income inequality; wealth distribution data are scarcer and rely on NSSO asset and consumption surveys. PLFS, primarily an employment survey, informs labour income and worklessness but is not a standard source for consumption or asset inequality.
Rural and urban development and poverty reduction Rural development has reduced poverty through agricultural growth and wage support. The Green Revolution raised productivity in Punjab, Haryana, western Uttar Pradesh and parts of Tamil Nadu, but regional unevenness left eastern and central India exposed. MGNREGA provided a wage floor, reduced distress migration and built assets; PMGSY improved market access and stimulated non-farm activity. Poverty reduction is strongest where farm growth, roads and public works converge. Urban development has contributed differently. Urbanization-led employment in construction, trade and services has absorbed migrants and lifted many out of poverty, but the informal sector remains flexible yet insecure. SEZs promoted export-oriented industry and employment, though raising land acquisition and displacement tensions. Agglomeration economies generate productivity and jobs, yet urban poverty persists in slums and peri-urban settlements where housing, water and sanitation lag behind income growth.
Decentralized planning guidelines The 73rd and 74th Amendments institutionalized local planning. Article 243G empowers Panchayats to plan and implement 11th Schedule schemes; District Planning Committees consolidate panchayat and municipal plans, and Metropolitan Planning Committees under Article 243ZE do so for metropolitan areas with population ten lakhs or more. Operationally, Gram Sabha identifies needs, prepares plans and budgets, and panchayats formulate Gram Panchayat Development Plans under Ministry of Panchayati Raj guidelines. Kerala’s People’s Plan Campaign, launched in 1996, is an important participatory model, but a state initiative rather than a national GPDP guideline. The process requires convergence of centrally sponsored schemes with local plans so funds follow district and panchayat priorities. Constraints are weak capacity, delayed fiscal devolution, and alignment of state schemes with local plans.
Measurement, development and governance are linked: accurate data reveal where growth fails, rural and urban policies determine whether growth reaches the poor, and decentralized planning translates national resources into local priorities. A way forward is to combine consumption-based poverty lines with MPI monitoring, strengthen NSSO and labour-market data, invest in rural non-farm and urban basic services, and make district and metropolitan planning committees effective instruments of fiscal and administrative devolution.
What "Analyse" is asking you to do
Break the subject into its working parts and show how they act on each other. The marks are in the interconnections — which factor drives which, and what the resulting structure explains — not in the inventory of factors.
Structure that answers it
Define the whole → separate it into its parts → show which part drives which → what that interaction produces → what the structure implies
Where marks are lost
A flat list of causes with no account of which drives which. An answer of neatly separated headings, each self-contained, scores as description.
How this answer will be evaluated
Approach
Framework: UPSC Economics Paper II. (a) analyse: intro > causes > effects > stakeholders/linkages > way forward | (b) discuss: intro > 3-4 dimensions > example > balanced close | (c) describe: define > structure or process in order > labelled diagram > significance Full marks: Comprehensive analysis with specific Indian data, schemes, and critical evaluation of methods and processes.
Key points expected
- Poverty Line method (PLC/TEC)
- Multidimensional Poverty Index (MPI)
- Gini Coefficient for inequality
- Limitations of absolute vs relative measures
- Rural development (agriculture, MGNREGA)
- Urban development (industrialization, services)
- Linkage between rural and urban sectors
- Impact on income and employment
Evaluation rubric
Each sub-part is marked on its own, against the marks and word limit printed on the paper.
- (a) Methods for measuring poverty and inequality in India with critical analysis. 20 marks
analyse— intro → causes → effects → stakeholders/linkages → way forward
Must cover
- Poverty Line method (PLC/TEC)
- Multidimensional Poverty Index (MPI)
- Gini Coefficient for inequality
- Limitations of absolute vs relative measures
Loses marks
- Listing methods without analysis
- Confusing poverty with inequality metrics
- Ignoring the Indian context
Earns more
- Reference to NITI Aayog MPI
- Reference to NSSO data
- Comparison of urban/rural poverty lines
- Mention of Human Development Index
Extra mark
- Specific Gini coefficient value for India
- Reference to Rangarajan Committee
- (b) Contribution of rural and urban economic development to poverty reduction. 15 marks
discuss— intro → 3-4 dimensions → example → balanced close
Must cover
- Rural development (agriculture, MGNREGA)
- Urban development (industrialization, services)
- Linkage between rural and urban sectors
- Impact on income and employment
Loses marks
- Treating rural and urban separately without linkage
- Focusing only on GDP growth
- Ignoring the role of government policy
Earns more
- Reference to specific schemes (PM-KISAN, Ujjwala)
- Discussion of structural transformation
- Role of infrastructure development
- Mention of skill development programs
Extra mark
- Specific data on poverty reduction rates
- Reference to recent Economic Survey
- (c) Guidelines of the Decentralized Planning process in India. 15 marks
describe— define → structure or process in order → labelled diagram → significance
Must cover
- Role of Panchayati Raj Institutions (PRIs)
- Role of Urban Local Bodies (ULBs)
- Integration with State and National plans
- Participatory planning process
Loses marks
- Confusing decentralized planning with federalism
- Ignoring the role of local bodies
- Focusing only on central government directives
Earns more
- Reference to 73rd and 74th Amendments
- Mention of District Planning Committees
- Discussion of bottom-up approach
- Reference to NITI Aayog's role
Extra mark
- Specific example of a state's decentralized planning
- Reference to specific guidelines document
Practice this exact question
Write your answer and it is marked point by point against the model answer above — what you covered, what you missed, what you got wrong.
Evaluate my answer →More from Economics 2025 Paper II
- Q1 Answer the following questions in about 150 words each: (a) Distinguish between the Zamin…
- Q2 (a) Is land reform necessary to improve agricultural productivity in India? Discuss. (20…
- Q3 (a) Examine the objectives and components of the Green Revolution in India. (20 marks) (b…
- Q4 (a) What are the methods used in measuring poverty and inequality in India? Analyse. (20…
- Q5 Answer the following questions in about 150 words each: (a) Discuss the components of foo…
- Q6 (a) What are the causes of industrial backwardness in India? Critically evaluate the role…
- Q7 (a) What is the sectoral composition of India's national income? Mention the most importa…