Paper II — Q4
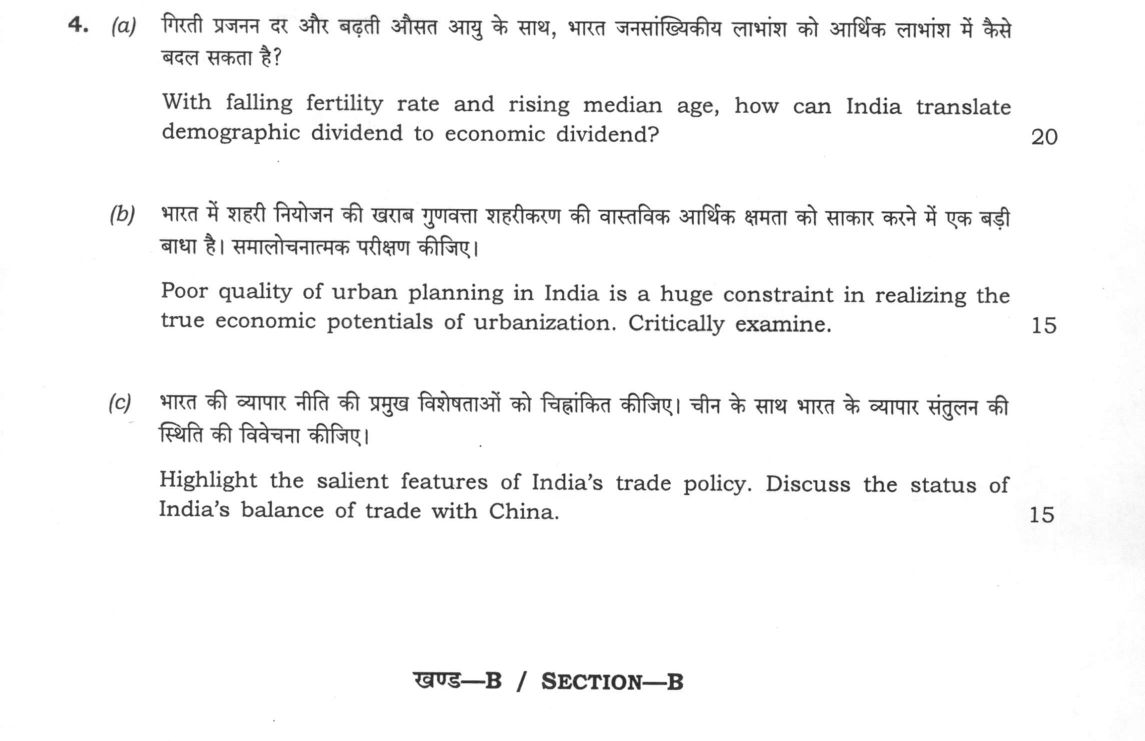
(a) With falling fertility rate and rising median age, how can India translate demographic dividend to economic dividend? 20 (b)…
With falling fertility rate and rising median age, how can India translate demographic dividend to economic dividend? 20 marks
Poor quality of urban planning in India is a huge constraint in realizing the true economic potentials of urbanization. Critically examine. 15 marks
Highlight the salient features of India's trade policy. Discuss the status of India's balance of trade with China. 15 marks
हिंदी में प्रश्न पढ़ें
गिरती प्रजनन दर और बढ़ती औसत आयु के साथ, भारत जनसांख्यिकीय लाभांश को आर्थिक लाभांश में कैसे बदल सकता है? 20 marks
भारत में शहरी नियोजन की खराब गुणवत्ता शहरीकरण की वास्तविक आर्थिक क्षमता को साकार करने में एक बड़ी बाधा है। समालोचनात्मक परीक्षण कीजिए। 15
भारत की व्यापार नीति की प्रमुख विशेषताओं को चिह्नांकित कीजिए। चीन के साथ भारत के व्यापार संतुलन की स्थिति की विवेचना कीजिए। 15
Model answer
Written by UPSC Answer Check against this question's marking rubric, to the expected length. UPSC does not publish answers for Mains — this is one way to score well, not an official key.
India’s demographic transition, marked by a falling Total Fertility Rate (2.0) and a rising median age (28.7 years), presents an approximate 30-year window where the working-age population outnumbers dependents. Converting this demographic dividend into an economic dividend requires a multi-pronged, process-oriented strategy.
Translating Demographic Dividend to Economic Dividend
First, human capital must be upgraded through industry-aligned skilling under the Pradhan Mantri Kaushal Vikas Yojana (PMKVY) to transition youth from low-productivity agriculture into formal manufacturing and high-end services. Second, regional demographic divergence must be managed: northern states like Bihar and Uttar Pradesh require rapid industrial job creation for their expanding youth bulge, whereas early-transition states like Kerala require a transition toward the silver economy and geriatric care. Third, female labor force participation (FLFPR) must be elevated through targeted social infrastructure, equal-opportunity hiring, and formal child-care support. Fourth, preventative and curative health infrastructure under Ayushman Bharat ensures long-term workforce productivity. Finally, universalizing pension coverage via contributory schemes like the Atal Pension Yojana is necessary before the window closes and dependency ratios rise.
Urban Planning as a Constraint on Urbanization
Urban centers generate over 60% of India's GDP, yet poor urban planning severely curtails these agglomeration economies. Rigid zoning laws and restrictive Floor Area Ratio (FAR) norms cause unmanaged urban sprawl, driving prohibitive housing shortages and slum proliferation. The deficit in trunk infrastructure leads to high logistics costs and severe urban disruptions, as seen in the recurring urban flooding of tech corridors in Bengaluru.
Furthermore, urban growth suffers from unbalanced spatial distribution: extreme urban primacy in Mumbai and Delhi generates severe congestion diseconomies, while tier-2 and tier-3 cities face infrastructure stagnation. Initiatives like the Smart Cities Mission and the Delhi-Mumbai Industrial Corridor (DMIC) attempt to bridge this gap, but municipal capacity deficits persist. Conversely, models such as Ahmedabad’s Town Planning (TP) schemes—which utilize land pooling without contentious acquisition—and Surat’s institutionalized municipal public health governance demonstrate that proactive local planning can unlock sustained urban economic output.
Salient Features of Trade Policy and India-China Trade Balance
India’s Foreign Trade Policy (FTP) 2023 represents a structural pivot from direct export subsidies to tax remissions, automated compliance, and institutional support. Its key features include:
- Promoting Districts as Export Hubs and facilitating cross-border e-commerce.
- The Special Economic Zone (SEZ) and Export Oriented Unit (EOU) frameworks for dedicated duty-free manufacturing.
- Strengthening export infrastructure through port-led connectivity under the Sagarmala Programme.
- Internationalizing trade settlement in Indian Rupees to insulate against foreign exchange volatility.
- Institutional convergence with Make in India and Atmanirbhar Bharat to foster domestic value chains.
Regarding the India-China Balance of Trade (BOT), the deficit remains heavily tilted in China's favor, surpassing $100 billion. The deficit is qualitative as well as quantitative: India’s import basket is dominated by critical, high-value components including Active Pharmaceutical Ingredients (APIs), telecom hardware, photovoltaic cells, and capital machinery. In contrast, India's export basket predominantly consists of primary and intermediate commodities like iron ore, cotton, marine products, and refined petroleum. To rectify this structural vulnerability, India has deployed targeted Production Linked Incentive (PLI) schemes across key sectors to foster domestic import substitution and build export competitiveness.
Way Forward
Sustained economic growth requires the structural convergence of these three domains. India’s demographic dividend can only be absorbed if well-planned, congestion-free urban centers act as productive agglomeration engines, supported by an outward-oriented trade policy that shifts the economy from primary exports and critical import dependence toward high-value, global manufacturing supply chains.
What "How" is asking you to do
Set out the route by which the outcome comes about, step by step. Many how stems ask how one thing affects another, and there the channel of transmission is precisely what is being marked.
Structure that answers it
Starting condition → step → step → outcome reached → the conditions the route depends on
Where marks are lost
Answering why it happens instead of how, the commonest single misread in the paper. An answer full of causes and significance that never traces the mechanism has answered a different question.
How this answer will be evaluated
Approach
Framework: Concept or mechanism > Diagram > Regional example > Application. (a) explain: definition/context > points in order > small example > short close | (b) critically evaluate: positives > negatives/limits > conditions/safeguards > conclusion | (c) highlight: name the salient points > one line of substance each > close Full marks: Precise mechanisms, specific examples, and clear diagrams.
Key points expected
- Define demographic dividend and economic dividend
- Link falling fertility to rising labor force participation
- Identify specific sectors for employment generation
- Explain the role of human capital investment
- Identify specific failures in urban planning (e.g., land use)
- Link planning gaps to economic inefficiency (e.g., congestion)
- Provide evidence of 'true economic potential' being lost
- Offer a balanced judgment on the constraint
Evaluation rubric
Each sub-part is marked on its own, against the marks and word limit printed on the paper.
- (a) Mechanism of converting demographic structure into economic growth. 20 marks
explain— definition/context → points in order → small example → short close
Must cover
- Define demographic dividend and economic dividend
- Link falling fertility to rising labor force participation
- Identify specific sectors for employment generation
- Explain the role of human capital investment
Loses marks
- Describing population decline without economic link
- Ignoring the 'rising median age' aspect of the prompt
- Vague policy suggestions without mechanism
Earns more
- Reference to National Population Policy 2000
- Mention of 'demographic window' concept
- Citing specific state-level examples (e.g., Kerala vs. Bihar)
- Discussion of the 'dependency ratio' shift
Extra mark
- Labelled diagram of the demographic transition curve
- Specific recent census data on median age
- (b) Assessment of how poor planning limits urban economic potential. 15 marks
critically evaluate— positives → negatives/limits → conditions/safeguards → conclusion
Must cover
- Identify specific failures in urban planning (e.g., land use)
- Link planning gaps to economic inefficiency (e.g., congestion)
- Provide evidence of 'true economic potential' being lost
- Offer a balanced judgment on the constraint
Loses marks
- General description of urbanization without critique
- Focusing only on social issues, not economic potential
- Lack of specific examples of poor planning
Earns more
- Reference to Smart Cities Mission
- Mention of specific cities (e.g., Mumbai, Delhi)
- Discussion of infrastructure deficits
- Link to environmental degradation costs
Extra mark
- Sketch map showing unplanned urban sprawl
- Citing specific economic loss statistics
- (c) Key features of trade policy and status of trade with China. 15 marks
highlight— name the salient points → one line of substance each → close
Must cover
- List salient features of India's trade policy
- Discuss the current status of trade balance with China
- Identify key import/export items in the bilateral trade
- Provide a concise conclusion on the trade relationship
Loses marks
- Vague description of trade policy without specific features
- Ignoring the 'status' aspect of the trade balance
- Failing to distinguish between trade policy and trade balance
Earns more
- Mention of 'Make in India' impact on trade
- Reference to specific trade agreements (e.g., RCEP status)
- Discussion of trade deficit components
- Mention of strategic autonomy in trade
Extra mark
- Table comparing import/export categories with China
- Specific recent trade deficit figures
Practice this exact question
Write your answer and it is marked point by point against the model answer above — what you covered, what you missed, what you got wrong.
Evaluate my answer →More from Geography 2023 Paper II
- Q1 (a) On the outline map of India provided to you, mark the location of all of the followin…
- Q2 (a) Examine the environmental challenges caused by the solid waste in metropolitan region…
- Q3 (a) Indian Pharma Industry has to move from 'volume' to 'value' leadership to capture glo…
- Q4 (a) With falling fertility rate and rising median age, how can India translate demographi…
- Q5 Answer the following questions in about 150 words each: 10×5=50 (a) Identify the jute-pro…
- Q6 (a) A large number of Indian cities have a complex morphological characteristics due to t…
- Q7 (a) Discuss the green energy initiatives of India as a signatory nation to the Paris Agre…