Paper I — Q8
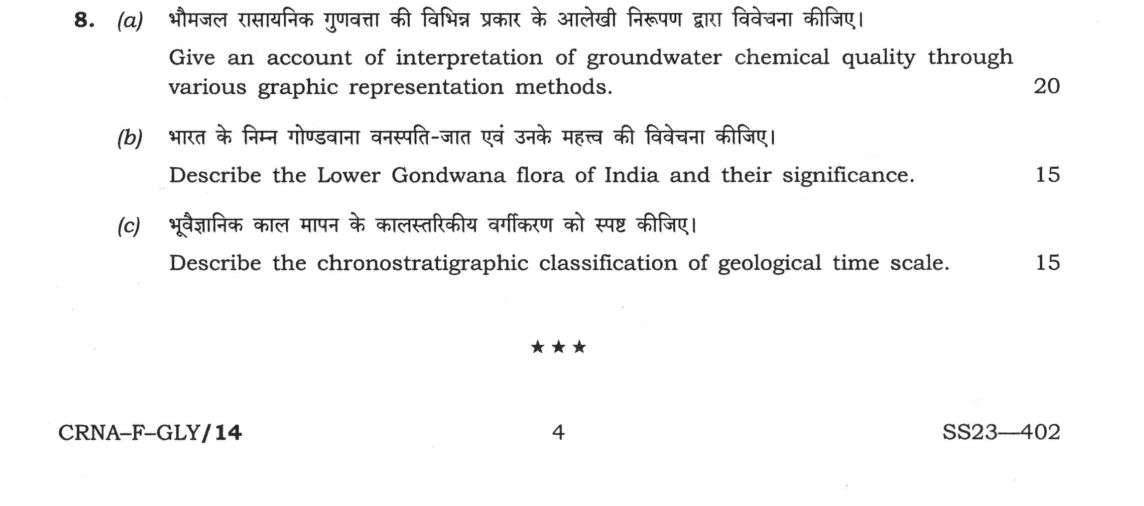
(a) Give an account of interpretation of groundwater chemical quality through various graphic representation methods. (20…
Give an account of interpretation of groundwater chemical quality through various graphic representation methods. 20 marks
Describe the Lower Gondwana flora of India and their significance. 15 marks
Describe the chronostratigraphic classification of geological time scale. 15 marks
हिंदी में प्रश्न पढ़ें
भूमजल रासायनिक गुणवत्ता की विभिन्न प्रकार के आलेखी निरूपण द्वारा विवेचना कीजिए। (20 अंक)
भारत के निम्न गोंडवाना वनस्पति-जात एवं उनके महत्व की विवेचना कीजिए। (15 अंक)
भूवैज्ञानिक काल मापन के कालस्तरीकीय वर्गीकरण को स्पष्ट कीजिए। (15 अंक)
Model answer
Written by UPSC Answer Check against this question's marking rubric, to the expected length. UPSC does not publish answers for Mains — this is one way to score well, not an official key.
Groundwater chemical quality Groundwater quality is interpreted graphically by converting ionic concentrations into facies, trends and suitability. The Piper trilinear diagram places cations (Na, Mg, Ca, K) and anions (HCO3+CO3, Cl, SO4) in two triangles and projects them into a diamond, distinguishing sodium-bicarbonate, calcium-bicarbonate, sodium-chloride and sulphate facies. The Stiff diagram uses parallel axes for each ion, making sample-to-sample changes and mixing patterns visible. The Durov diagram combines cation and anion percentages with total dissolved solids and alkalinity, useful for comparing aquifer types. The Schoeller diagram plots major-ion concentrations on a logarithmic scale against sample sequence or distance; it reveals dilution, evaporation, ion exchange and mixing, though it does not directly show relative saturation. The Gibbs diagram classifies natural controls—precipitation dominance, rock-weathering dominance and evaporation-crystallization dominance—while anthropogenic influence is inferred when samples fall outside expected natural fields or are supported by ion ratios. The diagrams are complementary: Piper and Durov identify facies, Stiff highlights sample chemistry, Schoeller traces spatial evolution, Gibbs separates natural controls, and indices translate chemistry into use-based quality. Suitability indices such as SAR, RSC and WQI classify irrigation and drinking-water quality. In India, Piper and Durov plots show bicarbonate-calcium facies in much of the Indo-Gangetic alluvium, sodium-chloride or sulphate facies in overexploited Deccan basalt aquifers, and chloride-sulphate facies with salinity and fluoride problems in coastal Tamil Nadu and Kerala aquifers. SAR and RSC flag sodium hazards in alluvial and basaltic waters, while WQI ranks drinking-water acceptability.
Lower Gondwana flora The Lower Gondwana flora of India is Permian in age and is best recorded in the Barakar and Raniganj formations of the Damodar Valley and equivalent sequences in the Wardha-Godavari basins. Dominant genera include Glossopteris, Gangamopteris, Vertebraria and Noeggerathiopsis, with associated ferns and seed ferns indicating cool, lowland environments. These taxa are diagnostic of the Glossopteris flora. The Barakar and Raniganj formations serve as type localities for these assemblages. Their significance is threefold. First, the widespread Glossopteris flora provides key paleobotanical evidence for the reconstruction of Gondwanaland, linking India with South America, Africa, Antarctica and Australia. Second, the flora records a transition from glacial to temperate conditions after the Permo-Carboniferous glaciation, helping reconstruct paleoclimate and palaeogeography. Third, the organic-rich Barakar and Raniganj sediments underpin the coal-bearing potential of the Damodar Valley, Wardha-Godavari basins and other Gondwana coalfields, making the flora important for both geological correlation and resource geology.
Chronostratigraphy Chronostratigraphic classification arranges rock sequences into time intervals: eons, eras, periods, epochs and ages. These units are bounded by Global Boundary Stratotype Sections and Points (GSSPs) where formally defined, and by Global Standard Stratigraphic Ages (GSSAs) for many Precambrian boundaries. The hierarchy allows a rock section to be correlated by age rather than by rock type alone. Chronostratigraphy differs from lithostratigraphy, which classifies rocks by physical and lithological character, and from geochronology, which assigns numerical ages. India contributes important reference sections: Guryul Ravine in Kashmir is a candidate/auxiliary reference section for the Permian–Triassic boundary, while the formal GSSP is at Meishan, China. The Marwar Supergroup in Rajasthan preserves early Cambrian strata and has been evaluated for GSSP potential, although the Ediacaran–Cambrian GSSP is at Newfoundland, Canada. The Rajmahal Traps provide a key Cretaceous chronostratigraphic marker for Indian volcanic sequences and global correlation. Together, these sections help place Indian sedimentary and volcanic sequences within the global time scale.
Thus, graphic hydrochemical methods, Lower Gondwana floristics and chronostratigraphic frameworks together provide complementary tools for interpreting Indian aquifers, Gondwana palaeobiogeography and the global geological time scale. This integrated approach is essential for water-resource management, basin reconstruction and global correlation.
What "Describe" is asking you to do
Give a full, ordered account of the thing named — its parts, stages or mechanism — in the sequence in which it actually exists or occurs. Most describe questions come from the science optionals, where the marks sit in correct technical detail and, where the stem says so, a labelled diagram.
Structure that answers it
One-line identification of the subject → the parts or stages in their real order, each with its defining detail → labelled diagram where the subject is structural → closing line on function or significance
Where marks are lost
Loose general prose where the examiner is ticking named parts, correct terminology and their sequence; and in the General Studies papers, turning to evaluation before the description is finished.
How this answer will be evaluated
Approach
Framework: Geology Paper 1: Define > Process > Field/Petrographic Evidence > Indian Example. (a) account for: state the phenomenon > the causes in order of weight > conclusion | (b) describe: define > structure or process in order > labelled diagram > significance | (c) describe: define > structure or process in order > labelled diagram > significance Full marks: Precise diagrams, named Indian examples, clear causal links, correct terminology.
Key points expected
- Piper trilinear diagram interpretation
- Durov diagram components
- Stiff diagram for water type
- Link to hydrogeochemical processes
- Key genera (Glossopteris, Gangamopteris)
- Stratigraphic range (Rajmahal/Barakar)
- Significance for Gondwana reconstruction
- Paleoclimatic implications
Evaluation rubric
Each sub-part is marked on its own, against the marks and word limit printed on the paper.
- (a) Interpretation of groundwater chemical quality using graphic methods. 20 marks
account for— state the phenomenon → the causes in order of weight → conclusion
Must cover
- Piper trilinear diagram interpretation
- Durov diagram components
- Stiff diagram for water type
- Link to hydrogeochemical processes
Loses marks
- Generic description without diagrams
- Confusing cation/anion dominance
- Missing hydrogeochemical context
Earns more
- Specific Indian aquifer example
- Identification of water-rock interaction
- Correct classification of water types
Extra mark
- Mention of specific Indian basin data
- Reference to IS 10500 standards
- (b) Lower Gondwana flora of India and their significance. 15 marks
describe— define → structure or process in order → labelled diagram → significance
Must cover
- Key genera (Glossopteris, Gangamopteris)
- Stratigraphic range (Rajmahal/Barakar)
- Significance for Gondwana reconstruction
- Paleoclimatic implications
Loses marks
- Confusing Lower and Upper Gondwana
- Missing paleogeographic significance
- Generic plant description
Earns more
- Specific Indian basin (Damodar/Son)
- Mention of associated fauna
- Comparison with other Gondwana continents
Extra mark
- Specific fossil locality in India
- Reference to specific stratigraphic marker
- (c) Chronostratigraphic classification of geological time scale. 15 marks
describe— define → structure or process in order → labelled diagram → significance
Must cover
- Hierarchy: Eon > Era > Period > Epoch
- Current Eon (Phanerozoic) divisions
- Key boundary markers (mass extinctions)
- Standard ICS time scale structure
Loses marks
- Confusing lithostratigraphy with chronostratigraphy
- Missing hierarchical structure
- Incorrect period sequence
Earns more
- Mention of Precambrian/Proterozoic
- Specific period names (Cretaceous, Jurassic)
- Reference to GSSP (Golden Spike)
Extra mark
- Specific age in Ma for boundaries
- Mention of specific Indian stratigraphic correlation
Practice this exact question
Write your answer and it is marked point by point against the model answer above — what you covered, what you missed, what you got wrong.
Evaluate my answer →More from Geology 2022 Paper I
- Q5 Answer the following questions in about 150 words each: (a) Diagrammatically explain the…
- Q6 (a) Elucidate the evolutionary trend of Hominidae with examples of Indian occurrence. (20…
- Q7 (a) Describe the stratigraphy of Singhbhum Craton and discuss its economic significance.…
- Q8 (a) Give an account of interpretation of groundwater chemical quality through various gra…