Paper II — Q1
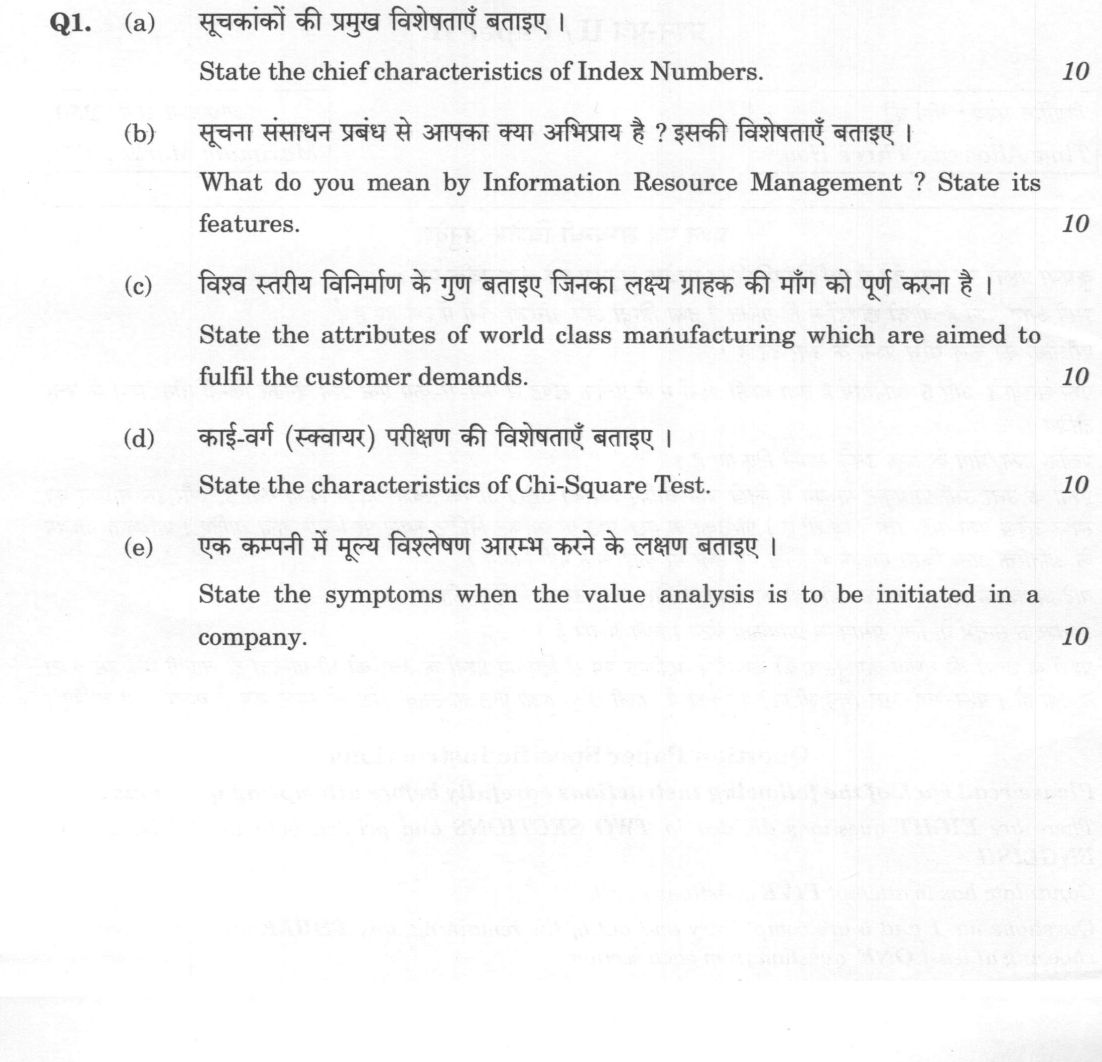
(a) State the chief characteristics of Index Numbers. (10 marks) (b) What do you mean by Information Resource Management ? State…
State the chief characteristics of Index Numbers. 10 marks
What do you mean by Information Resource Management ? State its features. 10 marks
State the attributes of world class manufacturing which are aimed to fulfil the customer demands. 10 marks
State the characteristics of Chi-Square Test. 10 marks
State the symptoms when the value analysis is to be initiated in a company. 10 marks
हिंदी में प्रश्न पढ़ें
सूचकांकों की प्रमुख विशेषताएँ बताइए । (10 अंक)
सूचना संसाधन प्रबंध से आपका क्या अभिप्राय है ? इसकी विशेषताएँ बताइए । (10 अंक)
विश्व स्तरीय विनिर्माण के गुण बताइए जिनका लक्ष्य ग्राहक की माँग को पूर्ण करना है । (10 अंक)
काई-वर्ग (स्क्वायर) परीक्षण की विशेषताएँ बताइए । (10 अंक)
एक कंपनी में मूल्य विश्लेषण आरंभ करने के लक्षण बताइए । (10 अंक)
Model answer
Written by UPSC Answer Check against this question's marking rubric, to the expected length. UPSC does not publish answers for Mains — this is one way to score well, not an official key.
(a) Chief Characteristics of Index Numbers
- Relative Measurement: Index numbers measure the relative changes in a variable or a group of related variables over time, across geographic regions, or between socio-economic sectors, rather than measuring absolute physical magnitudes.
- Percentage Expression: They are expressed in percentage terms to provide a standardized basis of comparison, with the base period value conventionally fixed at 100. They are pure, dimensionless numbers devoid of units of measurement, which allows direct comparison between disparate economic metrics such as agricultural yields and industrial outputs.
- Averaging of Complex Variables: Index numbers condense changes occurring across heterogeneous items into a single, representative composite figure. They utilize specialized averaging techniques—such as weighted arithmetic means or geometric means—to synthesize diverse commodities with distinct units (e.g., kilograms, liters, meters).
- Time Series and Spatial Comparison: They facilitate temporal comparisons by relating a given period (current year) to a designated reference period (base year), or spatial comparisons between distinct locations (e.g., inter-state cost of living differences).
- Specific Purpose Orientation: Every index number is constructed for a specialized objective and target domain, such as the Wholesale Price Index (WPI) for headline inflation, the Consumer Price Index (CPI) for living costs, and the Index of Industrial Production (IIP) for industrial activity.
- Deflation Capability: Index numbers provide the mathematical tool for deflating economic series, converting nominal financial metrics into real terms by neutralizing the distortive effects of price level fluctuations over time.
(b) Information Resource Management: Meaning and Features
Information Resource Management (IRM) is an integrative management approach that conceives, evaluates, and administers data and information assets as valuable corporate resources, on par with financial, physical, and human capital, across their entire lifecycle.
- Strategic Planning of Information Assets: IRM mandates the proactive alignment of information systems and data architectures with overarching corporate strategy, ensuring that information acquisition and flow directly advance enterprise goals.
- Organizing and Structuring Data: It involves establishing centralized governance, unified enterprise data architectures, standard data dictionaries, and clear repository structures that eliminate redundant data silos and maintain data integrity.
- Controlling Information Usage and Security: IRM enforces regulatory compliance, access controls, intellectual property protections, and cybersecurity protocols to protect information assets against unauthorized modification, breach, or loss.
- Technology Integration: It unifies disparate computing technologies, telecommunications networks, software platforms, and operational processes into a cohesive infrastructure, ensuring cross-functional data availability.
- Cost-Benefit Optimization: IRM treats information generation, storage, and dissemination through lifecycle costing, systematically measuring the economic value delivered by information against the operational costs of its collection and maintenance.
(c) Attributes of World Class Manufacturing Aimed at Customer Demands
- Relentless Customer Focus: World Class Manufacturing (WCM) aligns internal production processes with the Voice of the Customer (VOC), integrating Quality Function Deployment (QFD) to translate customer expectations directly into product design specifications and customized product variations.
- Total Quality Management (TQM): It establishes an operating standard of zero defects through systemic quality assurance, statistical process control, and Six Sigma frameworks, ensuring that the delivered product meets end-user reliability requirements.
- Continuous Improvement (Kaizen): WCM embeds incremental operational enhancements across all production stages, systematically eliminating the seven classic forms of waste (Muda) to reduce costs and pass value to the consumer.
- Operational Flexibility and Responsiveness: It achieves high agility through Single-Minute Exchange of Die (SMED) setup-time reductions, modular manufacturing cells, and short lead times, enabling rapid adaptation to fluctuating customer orders and customized demands.
- Synchronized Supply Chain Integration: WCM coordinates end-to-end logistics through Just-In-Time (JIT) deliveries, collaborative vendor management, and real-time demand-pull systems (Kanban), ensuring on-time delivery and stock availability.
(d) Characteristics of Chi-Square Test
- Non-Parametric Nature: The Chi-Square (χ²) test is a distribution-free statistical technique that requires no assumptions regarding the normality of the underlying population or specific parameters like the mean and variance.
- Dual Testing Frameworks: It functions primarily as a Test of Goodness of Fit (determining whether an observed sample frequency distribution conforms to an expected theoretical distribution) and as a Test of Independence (evaluating whether two categorical attributes in a contingency table are statistically independent).
- Reliance on Categorical Data: The test operates exclusively on discrete, qualitative, or nominal scale data expressed as distinct group frequencies or counts, rather than continuous parametric values.
- Observed versus Expected Frequency Comparison: The test statistic is calculated by evaluating the squared discrepancies between actual observed frequencies (O) and theoretically expected frequencies (E), weighted inversely by the expected frequencies: χ² = Σ ((O - E)²)/E
- Parameterization by Degrees of Freedom: The critical value and shape of the Chi-Square distribution depend solely on its degrees of freedom (df). For a goodness-of-fit test involving k categories with p estimated parameters, df = k - 1 - p; for an r × c contingency table of independence, df = (r - 1)(c - 1).
(e) Symptoms for Initiating Value Analysis in a Company
- Escalating Manufacturing Costs Without Quality Gains: A continuous upward trend in component, direct labor, or material costs without any commensurate enhancement in product performance, utility, or operational capability.
- Shrinking Profit Margins: Persistent compression of gross and net profit margins on established product lines despite stable or rising sales volumes, indicating disproportionate product costs relative to market-clearing prices.
- Loss of Market Competitiveness and Product Obsolescence: A steady decline in market share caused by competitor offerings that provide equivalent or superior functionality at a lower price point, signaling outdated design or material inefficiencies.
- Increasing Volume of Customer Complaints: Heightened customer dissatisfaction regarding functional breakdowns, unnecessary operational complexities, or perceived poor value-for-money, indicating poor functional design.
- Disproportionate Component-Level Expenditures: Internal cost audits revealing that non-essential components, cosmetic parts, or secondary product functions consume an excessive proportion of total manufacturing costs relative to primary customer-demanded functions.
What "State" is asking you to do
Give the formulation itself — the theorem, rule, statutory provision or position — worded accurately. Precision of wording is the whole of the mark; no background or justification is being asked for.
Structure that answers it
The statement in full, complete in itself → the conditions under which it holds → an illustration only where the stem asks for one
Where marks are lost
Approximating the wording. A theorem or a provision stated loosely forfeits the mark that exact statement would have carried.
How this answer will be evaluated
Approach
(a) highlight: name the salient points > one line of substance each > close | (b) explain: definition/context > points in order > small example > short close | (c) highlight: name the salient points > one line of substance each > close | (d) highlight: name the salient points > one line of substance each > close | (e) highlight: name the salient points > one line of substance each > close Full marks: Precise, technical terminology; clear distinction between concepts; well-structured points.
Key points expected
- Expressed in relative terms (percentage)
- Measures average change over time
- Abstract in nature (no units)
- Directional (indicates rise/fall)
- Definition: Management of information as a resource
- Feature: Integration of people, processes, technology
- Feature: Focus on information lifecycle (creation to disposal)
- Feature: Strategic alignment with business goals
Evaluation rubric
Each sub-part is marked on its own, against the marks and word limit printed on the paper.
- (a) List the key properties of index numbers. 10 marks
highlight— name the salient points → one line of substance each → close
Must cover
- Expressed in relative terms (percentage)
- Measures average change over time
- Abstract in nature (no units)
- Directional (indicates rise/fall)
Loses marks
- Confusing index numbers with absolute values
- Listing only types of indices without characteristics
Earns more
- Mention of limitations (e.g., not for algebraic manipulation)
- Distinction between simple and weighted indices
Extra mark
- Reference to Fisher's Ideal Index
- Mention of 'statistical thermometer' analogy
- (b) Define IRM and list its core features. 10 marks
explain— definition/context → points in order → small example → short close
Must cover
- Definition: Management of information as a resource
- Feature: Integration of people, processes, technology
- Feature: Focus on information lifecycle (creation to disposal)
- Feature: Strategic alignment with business goals
Loses marks
- Treating IRM as merely IT management
- Vague definition without 'resource' aspect
Earns more
- Mention of knowledge management
- Reference to data governance or security
Extra mark
- Example of IRM in a specific industry (e.g., banking)
- Mention of specific standards (e.g., ISO 27001)
- (c) List attributes of world-class manufacturing for customer demand. 10 marks
highlight— name the salient points → one line of substance each → close
Must cover
- Quality (Zero defects/Total Quality Management)
- Cost (Competitive pricing/Lean manufacturing)
- Delivery (Just-in-Time/Lead time reduction)
- Flexibility (Customization/Quick response)
Loses marks
- Listing generic manufacturing terms without 'world-class' context
- Ignoring the 'customer demand' aspect
Earns more
- Mention of 'QCDS' framework
- Reference to Six Sigma or TQM
Extra mark
- Example of a world-class manufacturer (e.g., Toyota)
- Mention of sustainability as a modern attribute
- (d) List characteristics of the Chi-Square test. 10 marks
highlight— name the salient points → one line of substance each → close
Must cover
- Non-parametric test (distribution-free)
- Used for categorical data (nominal/ordinal)
- Tests goodness of fit or independence
- Based on frequency counts, not means
Loses marks
- Confusing with t-test or ANOVA (parametric)
- Suggesting it works on continuous data
Earns more
- Mention of null hypothesis (H0)
- Reference to degrees of freedom
Extra mark
- Mention of Pearson's Chi-Square formula
- Note on minimum expected frequency requirement
- (e) List symptoms indicating need for value analysis. 10 marks
highlight— name the salient points → one line of substance each → close
Must cover
- High cost of production relative to competitors
- Customer complaints about quality or features
- Obsolescence of product or process
- Low profit margins or declining sales
Loses marks
- Listing general business problems not specific to VA
- Confusing VA with general cost accounting
Earns more
- Mention of 'cost reduction' as a trigger
- Reference to 'function analysis'
Extra mark
- Example of a product where VA was applied
- Mention of 'Value Engineering' as a synonym
Practice this exact question
Write your answer and it is marked point by point against the model answer above — what you covered, what you missed, what you got wrong.
Evaluate my answer →More from Management 2023 Paper II
- Q1 (a) State the chief characteristics of Index Numbers. (10 marks) (b) What do you mean by…
- Q2 (a) The following table gives the production in three shifts and the corresponding number…
- Q3 (a) State the different forms of waste management. 15 marks (b) State the various factors…
- Q4 (a) (i) Define e-Governance. (ii) State the advantages of e-Governance. (iii) State the e…