Paper II — Q3
(a) Discuss briefly capacity planning. Explain various kinds of capacity planning. 15 marks (b) Discuss in brief various phases…
Discuss briefly capacity planning. Explain various kinds of capacity planning. 15 marks
Discuss in brief various phases of quality management. 15 marks
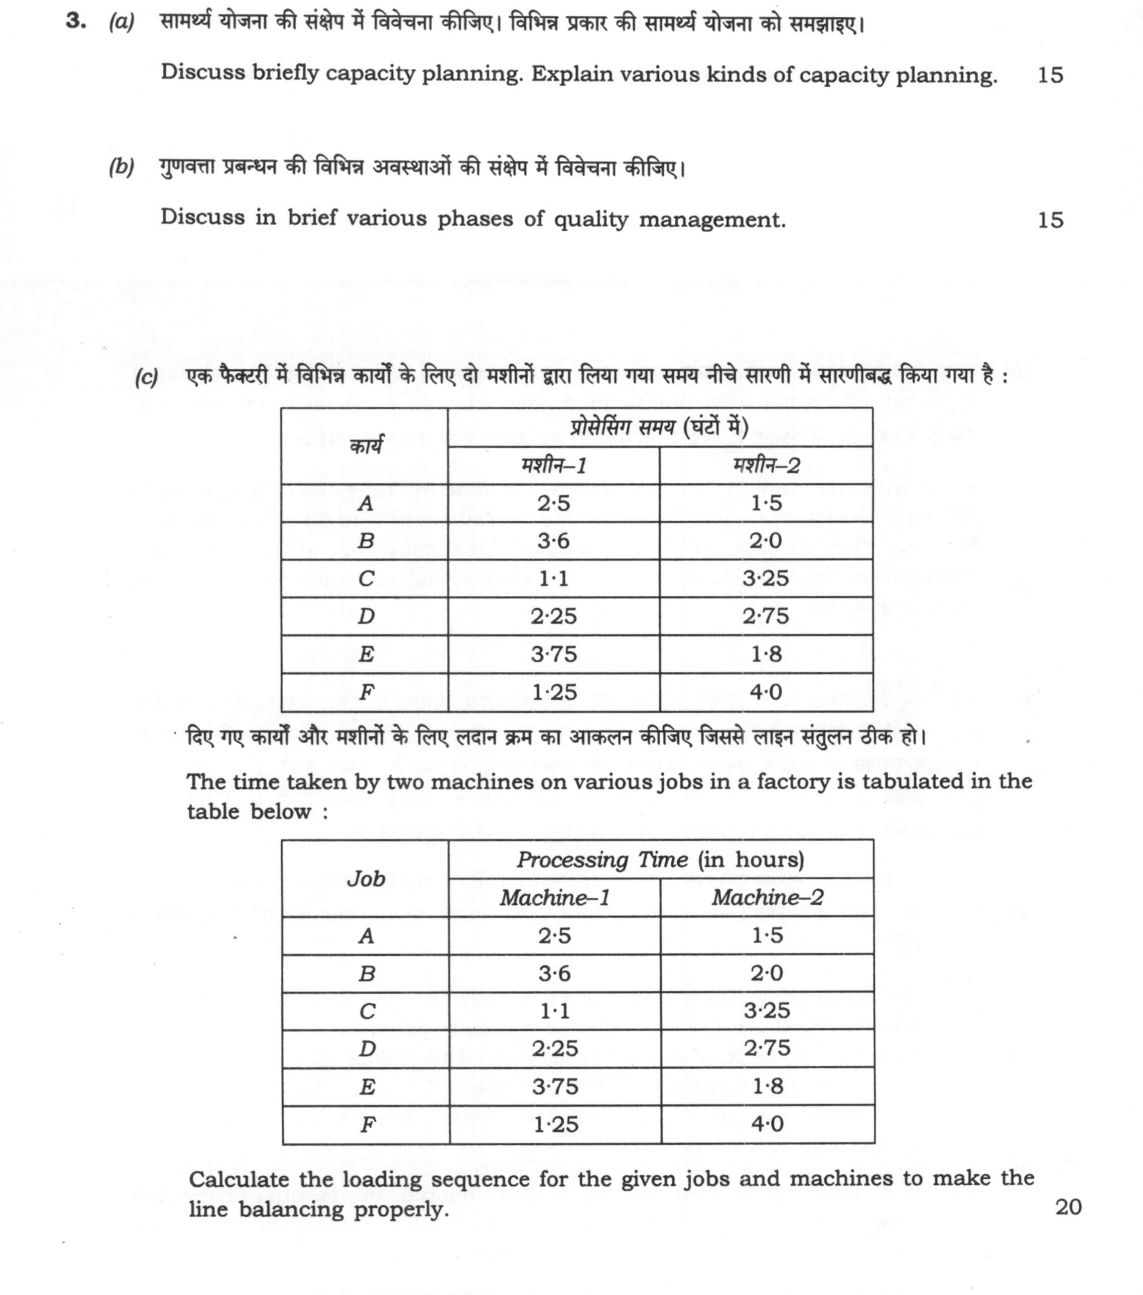
The time taken by two machines on various jobs in a factory is tabulated in the table below:
Calculate the loading sequence for the given jobs and machines to make the line balancing properly. 20 marks
हिंदी में प्रश्न पढ़ें
सामर्थ्य योजना की संक्षेप में विवेचना कीजिए। विभिन्न प्रकार की सामर्थ्य योजना को समझाइए। 15
गुणवत्ता प्रबंधन की विभिन्न अवस्थाओं की संक्षेप में विवेचना कीजिए। 15
एक फैक्ट्री में विभिन्न कार्यों के लिए दो मशीनों द्वारा लिया गया समय नीचे सारणी में सारणीबद्ध किया गया है:
दिए गए कार्यों और मशीनों के लिए लदान क्रम का आकलन कीजिए जिससे लाइन संतुलन ठीक हो। 20
The figure this question refers to, in words
The question paper is a scan and the diagram did not survive as text. This is the figure as read from the original page — every component, value and label — so the question can be worked from the text below.
(c) Table titled 'Processing Time (in hours)'. Columns: Job, Machine-1, Machine-2. Rows: A, 2.5, 1.5; B, 3.6, 2.0; C, 1.1, 3.25; D, 2.25, 2.75; E, 3.75, 1.8; F, 1.25, 4.0.
Model answer
Written by UPSC Answer Check against this question's marking rubric, to the expected length. UPSC does not publish answers for Mains — this is one way to score well, not an official key.
Capacity planning. Capacity planning is the systematic estimation of the production, service or facility capacity needed to meet forecast demand over a chosen horizon, while balancing capital cost, flexibility and service level. It links demand forecasting, product mix, technology and labour availability to plant size, shifts and equipment. It is strategic: under-capacity causes lost sales and overtime; over-capacity raises idle costs and debt. The main strategies are lead, lag and match. Lead capacity is added before demand rises, improving responsiveness but risking idle assets; lag capacity is added after demand is proven, reducing risk but limiting growth; match capacity adds small increments continuously, balancing risk and flexibility. Capacity has three levels: design capacity is the maximum theoretical output under ideal conditions; effective capacity is the realistic output after planned downtime, maintenance and quality losses; actual capacity is the output achieved. Planning uses forecasting techniques such as moving averages, exponential smoothing and regression, and project scheduling tools such as CPM/PERT for capacity expansion projects.
Quality management. Quality management has evolved from inspection, where defects were detected after production, to statistical quality control, where Shewhart control charts and Deming’s statistical methods reduced variation during production. This moved into quality assurance, which builds quality into processes, suppliers and systems, and then into total quality management, where every function and employee is involved in customer-focused continuous improvement. Six Sigma adds disciplined DMAIC/DFSS problem solving and defect reduction. Deming’s PDCA cycle—plan, do, check, act—provides the iterative improvement loop, while Juran’s trilogy of quality planning, control and improvement gives the managerial framework. In India, Tata Motors’ journey from inspection to TQM and Six Sigma, and Maruti Suzuki’s line balancing and supplier quality, show how quality systems become competitive assets.
Job sequencing. For the two-machine problem, Johnson’s rule is applied. For each job, the smaller processing time is identified: if it is on Machine-1, the job is placed as early as possible; if on Machine-2, as late as possible. The minimum times are C=1.1 on M1, F=1.25 on M1, D=2.25 on M1, B=2.0 on M2, E=1.8 on M2 and A=1.5 on M2. Sorting the M1 jobs in ascending order and the M2 jobs in descending order gives the loading sequence on both machines: C–F–D–B–E–A. The schedule is: C on M1 0–1.1 and M2 1.1–4.35; F on M1 1.1–2.35 and M2 4.35–8.35; D on M1 2.35–4.60 and M2 8.35–11.10; B on M1 4.60–8.20 and M2 11.10–13.10; E on M1 8.20–11.95 and M2 13.10–14.90; A on M1 11.95–14.45 and M2 14.90–16.40. The total elapsed time, or makespan, is 16.40 hours. Machine-1 works for 14.45 hours, so its idle time is 1.95 hours; Machine-2 works for 15.30 hours, so its idle time is 1.10 hours. The total idle time is 3.05 hours. The Gantt chart shows that Machine-2 is idle only for the first 1.10 hours, while C is on Machine-1, and that Machine-1 is idle for the final 1.95 hours while Machine-2 completes A. This sequence balances the line by keeping both machines loaded as continuously as possible and minimising the overall completion time.
Conclusion. Capacity planning, quality management and line balancing are mutually reinforcing. Capacity decisions determine whether quality investments, such as SPC, Six Sigma or TQM, can be sustained without overloading machines; quality systems reduce rework and downtime, raising effective capacity; and balanced sequencing reduces idle time, improving throughput and cost. In Indian manufacturing, integrating ISRO’s phased capacity planning, Tata Motors’ quality discipline and Maruti Suzuki’s line balancing shows that operations are one system of planning, quality and execution.
What "Discuss" is asking you to do
Lay the issue out from more than one side — how it arose, what is claimed for it, what is held against it, and where it now stands. UPSC attaches discuss to broad topics with several live dimensions, so coverage of the dimensions earns more than the strength of your opinion.
Structure that answers it
Set the issue up → the case as it is made → the case against → the dimension both sides leave out → where the balance now lies
Where marks are lost
Listing facts with no thread between them, or arguing one side throughout and calling it a discussion.
How this answer will be evaluated
Approach
Framework: Johnson's Rule. (a) explain: definition/context > points in order > small example > short close | (b) discuss: intro > 3-4 dimensions > example > balanced close | (c) calculate: given > formula > substitution > result with units > interpretation Full marks: Part (c) shows correct Johnson's Rule application with final sequence; (a) and (b) are conceptually precise.
Key points expected
- Define capacity planning
- Distinguish long-term vs short-term capacity
- Explain demand-driven vs supply-driven capacity
- Mention capacity cushion or slack
- Identify the Inspection phase
- Identify the Quality Control (QC) phase
- Identify the Quality Assurance (QA) phase
- Identify Total Quality Management (TQM)
Evaluation rubric
Each sub-part is marked on its own, against the marks and word limit printed on the paper.
- (a) Definition of capacity planning and classification of its types. 15 marks
explain— definition/context → points in order → small example → short close
Must cover
- Define capacity planning
- Distinguish long-term vs short-term capacity
- Explain demand-driven vs supply-driven capacity
- Mention capacity cushion or slack
Loses marks
- Confusing capacity with production volume
- Ignoring the time horizon of planning
Earns more
- Reference to aggregate planning
- Mention of bottleneck analysis
- Example of capacity expansion
Extra mark
- Reference to specific industry standard (e.g., ISO)
- (b) Overview of the historical and operational phases of quality management. 15 marks
discuss— intro → 3-4 dimensions → example → balanced close
Must cover
- Identify the Inspection phase
- Identify the Quality Control (QC) phase
- Identify the Quality Assurance (QA) phase
- Identify Total Quality Management (TQM)
Loses marks
- Treating phases as isolated rather than evolutionary
- Lack of distinction between control and assurance
Earns more
- Mention of Six Sigma
- Reference to Deming or Juran
- Distinction between QC and QA
Extra mark
- Reference to ISO 9001 standards
- (c) Determine the optimal job sequence using the provided processing times. 20 marks
calculate— given → formula → substitution → result with units → interpretation
Must cover
- Apply Johnson's Rule algorithm
- Identify minimum processing time correctly
- Assign jobs to start or end of sequence
- Provide final sequence (e.g., C-A-F-E-B-D)
Loses marks
- Incorrect application of the 'start/end' rule
- Arithmetic errors in time comparison
Earns more
- Show step-by-step selection of minimums
- Calculate total elapsed time (makespan)
Extra mark
- Calculate idle time for each machine
Practice this exact question
Write your answer and it is marked point by point against the model answer above — what you covered, what you missed, what you got wrong.
Evaluate my answer →More from Management 2024 Paper II
- Q1 (a) Explain the necessary conditions for application of simplex method to be applied to l…
- Q2 (a) A company gives on-the-job training to its salesmen, which is followed by a test. The…
- Q3 (a) Discuss briefly capacity planning. Explain various kinds of capacity planning. 15 mar…
- Q4 (a) Discuss in brief the new information technology trends that will change the way of in…
- Q5 (a) "SMEs are backbone of any country's industrial development." Critically analyze the s…
- Q6 (a) "Removing regional imbalance of industrial development should be top priority of Indi…