Paper II — Q1
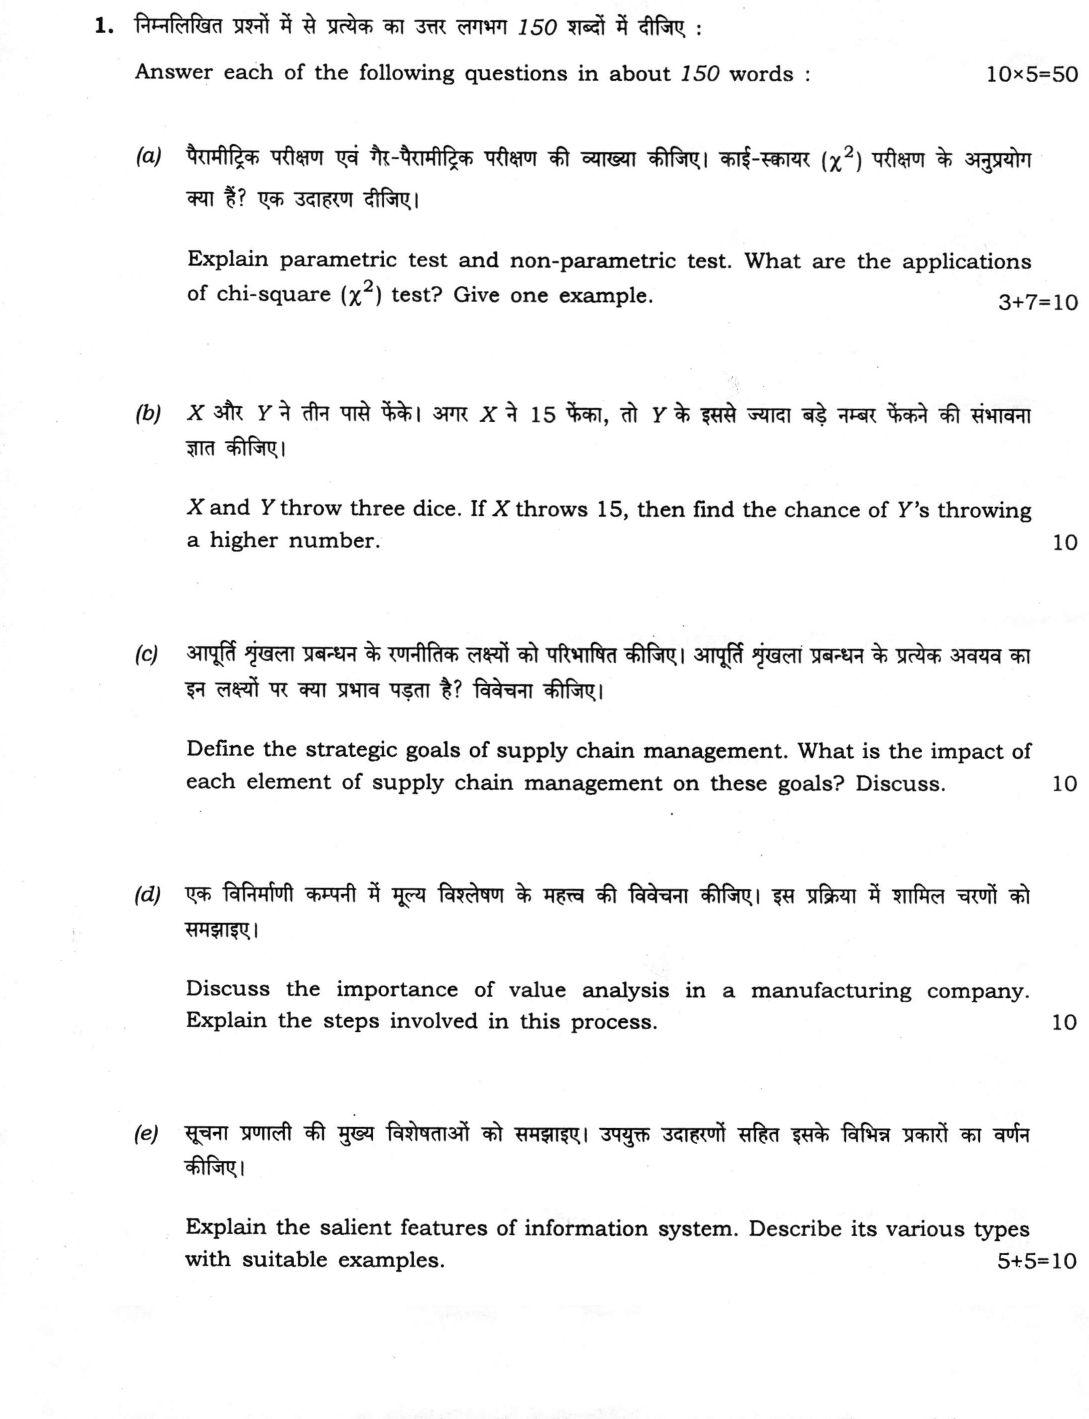
(a) Explain parametric test and non-parametric test. What are the applications of chi-square (χ²) test? Give one example. (10…
Answer each of the following questions in about 150 words :
Explain parametric test and non-parametric test. What are the applications of chi-square (χ²) test? Give one example. 10 marks
X and Y throw three dice. If X throws 15, then find the chance of Y's throwing a higher number. 10 marks
Define the strategic goals of supply chain management. What is the impact of each element of supply chain management on these goals? Discuss. 10 marks
Discuss the importance of value analysis in a manufacturing company. Explain the steps involved in this process. 10 marks
Explain the salient features of information system. Describe its various types with suitable examples. 10 marks
हिंदी में प्रश्न पढ़ें
निम्नलिखित प्रश्नों में से प्रत्येक का उत्तर लगभग 150 शब्दों में दीजिए :
पैरामीट्रिक परीक्षण एवं गैर-पैरामीट्रिक परीक्षण की व्याख्या कीजिए। काई-स्क्वायर (χ²) परीक्षण के अनुप्रयोग क्या हैं? एक उदाहरण दीजिए। (10 अंक)
X और Y ने तीन पासे फेंके। अगर X ने 15 फेंका, तो Y के इससे ज्यादा बड़े नम्बर फेंकने की संभावना ज्ञात कीजिए। (10 अंक)
आपूर्ति शृंखला प्रबन्धन के रणनीतिक लक्ष्यों को परिभाषित कीजिए। आपूर्ति शृंखला प्रबन्धन के प्रत्येक अवयव का इन लक्ष्यों पर क्या प्रभाव पड़ता है? विवेचना कीजिए। (10 अंक)
एक विनिर्माणी कम्पनी में मूल्य विश्लेषण के महत्त्व की विवेचना कीजिए। इस प्रक्रिया में शामिल चरणों को समझाइए। (10 अंक)
सूचना प्रणाली की मुख्य विशेषताओं को समझाइए। उपयुक्त उदाहरणों सहित इसके विभिन्न प्रकारों का वर्णन कीजिए। (10 अंक)
Model answer
Drafted with AI by UPSC Answer Check against this question's marking rubric, to the 150-word length. UPSC does not publish answers for Mains — this is one way to score well, not an official key. How we build rubrics and answers.
(a) Parametric and Non-parametric Tests; Chi-square Parametric tests (z-test, t-test, F-test/ANOVA, Pearson's correlation) assume interval or ratio data drawn from a population with a known distribution, usually normal, and test hypotheses about parameters such as the mean or variance. Non-parametric tests (chi-square, sign test, Mann-Whitney U, Wilcoxon signed-rank, Kruskal-Wallis H, Spearman's rank correlation, run test) are distribution-free and suit nominal or ordinal data or small samples.
The chi-square test (Karl Pearson, 1900) compares observed (O) and expected (E) frequencies: χ² = Σ[(O − E)²/E]. Applications: goodness of fit (df = n − 1), independence of attributes (df = (r − 1)(c − 1)), homogeneity of populations and testing a population variance. Expected cell frequencies should generally be at least 5.
Example: of 100 men, 60 prefer brand A and 40 brand B; of 100 women, 40 prefer A and 60 B. Under independence, E = (100 × 100)/200 = 50 per cell. χ² = 4 × (10²/50) = 8.0. With df = 1, the 5% table value is 3.841; since 8.0 > 3.841, brand preference is not independent of gender.
(b) Probability that Y Throws Higher than 15 Three fair dice give 6³ = 216 equally likely ordered outcomes. Y must score strictly more than X's 15, i.e., a total of 16, 17 or 18. X's throw does not affect Y's.
Favourable ordered outcomes: Sum 16: (6, 6, 4) — 3 arrangements; (6, 5, 5) — 3 arrangements; total 6. Sum 17: (6, 6, 5) — 3 arrangements. Sum 18: (6, 6, 6) — 1 arrangement.
Total favourable = 6 + 3 + 1 = 10.
P(Y > 15) = 10/216 = 5/108 ≈ 0.0463 (4.63%).
(c) Strategic Goals of Supply Chain Management The strategic goal of supply chain management is to maximise supply chain surplus — customer value minus total supply chain cost — by balancing cost, responsiveness (speed and flexibility), quality and reliability. This requires strategic fit: efficient chains for functional products with stable demand and responsive chains for innovative products (Marshall Fisher).
Impact of each driver (Chopra and Meindl) on these goals:
- Facilities: fewer, larger plants cut cost; more, closer ones raise responsiveness.
- Inventory: buffers raise service levels but add holding cost.
- Transportation: faster modes improve responsiveness at higher cost; consolidation lowers cost.
- Information: shared demand data can improve cost and responsiveness together and curbs the bullwhip effect.
- Sourcing: in-house production gives control; outsourcing gains scale economies but adds coordination risk.
- Pricing: shapes demand patterns, allowing capacity to be matched with demand.
Zara's quick-response chain and Amul's cold-chain network show how drivers are aligned with strategy.
(d) Value Analysis in a Manufacturing Company Value analysis, developed by Lawrence D. Miles at General Electric in 1947, systematically examines the functions of a product to deliver them at the lowest cost without sacrificing quality or reliability: Value = Function ÷ Cost. Value analysis applies to existing products; value engineering applies it at the design stage.
Importance: it cuts material and process costs, improves quality and competitiveness, encourages cross-functional teamwork and supplier involvement, and distinguishes use value and esteem value from mere cost.
Steps of the job plan:
- Orientation: select a high-cost product or component and form a cross-functional team.
- Information: collect data on cost, specifications, usage and suppliers.
- Function analysis: define functions as verb-noun pairs ("support load"), separate basic from secondary functions (FAST diagram), and allocate cost to each.
- Creativity: brainstorm alternative ways to perform each function.
- Evaluation: judge ideas on cost, feasibility and reliability.
- Recommendation, implementation and follow-up.
Example: replacing a machined metal bracket with an injection-moulded polymer part retains the "support load" function at lower cost.
(e) Information Systems: Features and Types An information system (IS) is an organised combination of hardware, software, data, procedures, people and networks that collects, processes, stores and distributes information for operations and decision-making.
Salient features: it converts data into information that is relevant, accurate, timely and complete; it integrates departments through shared data; it provides feedback for control; and it is user- and decision-oriented.
Types:
- Transaction Processing System (TPS): records routine transactions — IRCTC ticket booking, core banking.
- Management Information System (MIS): structured periodic reports for middle managers — monthly sales-variance reports.
- Decision Support System (DSS): interactive "what-if" analysis for semi-structured decisions — an inventory or pricing model.
- Executive Support System (ESS): summarised internal and external data for top management — a CEO dashboard.
- Expert system: applies coded expert rules — credit-scoring or fault diagnosis.
- Enterprise systems: cross-functional integration — ERP such as SAP, plus CRM and SCM systems.
How this answer will be evaluated
Evaluation rubric
Each sub-part is marked on its own, against the marks and word limit printed on the paper.
- (a) Three linked tasks: (i) explain what parametric and non-parametric tests are (assumptions, when each is used), (ii) list the applications of the chi-square test, and (iii) give one concrete worked example. 'Explain' needs definition plus distinguishing assumptions, not a bare list. 10 marks · 150 words
Must cover
- Parametric: z-test, t-test, F-test/ANOVA, Pearson's correlation
- Non-parametric: chi-square, sign test, Mann-Whitney U, Wilcoxon signed-rank, Kruskal-Wallis H, Spearman's rank correlation, run test
- chi-square = sum[(O - E)^2 / E]
- Expected frequency E = (row total x column total) / grand total
- df = (r-1)(c-1) for independence; df = n-1 for goodness of fit
- Applications: goodness of fit, independence of attributes, homogeneity, test of population variance
- Karl Pearson (chi-square, 1900)
Loses marks
- Writing only definitions and never listing the chi-square applications, which carry the largest block of marks
- Giving no example at all, or a vague 'e.g. market research' instead of an actual table with O and E
- Stating df wrongly - using n-1 for a contingency table instead of (r-1)(c-1)
- Claiming chi-square is a parametric test, or that non-parametric tests are always superior
- Ignoring the condition that expected cell frequencies should generally be at least 5 (else pool cells / use Yates' correction for 2x2)
Earns more
- The statistic and degrees of freedom stated correctly: chi-square = sum[(O - E)^2 / E]; df = (r-1)(c-1) for a contingency table, df = n-1 for goodness of fit (less one per estimated parameter)
- One specific example carried through, e.g. a contingency table of brand preference by gender with E computed as row total x column total / grand total and the comparison with the 5% table value
- (b) A classical probability numerical: three fair dice are thrown; given that X's total is 15, find the probability that Y's total exceeds 15, i.e. P(sum = 16, 17 or 18). Requires the sample space of 6^3 = 216 outcomes and enumeration of favourable ordered triples. 10 marks · 150 words
Must cover
- Total outcomes = 6^3 = 216
- Favourable sums: 16, 17, 18
- Ordered triples: (6,6,4) and (6,5,5) for 16; (6,6,5) for 17; (6,6,6) for 18
- Number of favourable cases = 10
- FINAL ANSWER: P = 10/216 = 5/108 = 0.0463 (4.63%)
Loses marks
- Including the sum 15 itself (answer 10/216 wrongly becomes 20/216) - 'higher' means strictly greater
- Counting unordered combinations only (4 instead of 10) - i.e. forgetting the permutations of (6,6,4), (6,5,5) and (6,6,5) - giving 4/216
- Miscounting the arrangements, e.g. treating (6,6,4) or (6,5,5) as having 6 permutations instead of 3
- Treating the dice as indistinguishable and using 56 combinations as the denominator without adjusting for unequal probabilities
- Leaving the answer as a count instead of a probability, or not simplifying/decimalising it
Earns more
- Assumptions stated - dice are fair, throws are independent, all 216 ordered outcomes equally likely; X's throw does not affect Y's
- (c) Two connected tasks: define the strategic goals of supply chain management, then discuss how each element/driver of the supply chain affects those goals. 'Discuss' requires linking every element to the goals, not merely listing SCM components. 10 marks · 150 words
Must cover
- Supply chain surplus = customer value - supply chain cost
- Drivers: facilities, inventory, transportation, information, sourcing, pricing (Chopra and Meindl)
- SCOR model: plan, source, make, deliver, return
- Responsiveness-efficiency trade-off and strategic fit
- Bullwhip effect
- Fisher's functional vs innovative products (efficient vs responsive chains)
- One real example (Amul, Maruti Suzuki, Zara, Amazon, Walmart)
Loses marks
- Listing SCM elements without ever connecting them to the stated goals - the question asks for impact
- Describing logistics only (transport and warehousing) and omitting information, sourcing and pricing
- Not defining the goals at all and jumping straight to 'benefits of SCM'
- Presenting every driver as purely beneficial and ignoring the cost-responsiveness trade-off
- Padding with generic e-commerce anecdotes beyond the 150-word limit at the cost of the analytical content
Earns more
- Information identified as the one driver that can improve cost and responsiveness together, with the bullwhip effect named as what poor information causes
- Concept of strategic fit / responsiveness-efficiency frontier used, or an Indian illustration (Amul's cold chain, Maruti's vendor cluster, Flipkart/Amazon fulfilment centres, Reliance Retail, Zara's quick response)
- (d) Two tasks: discuss why value analysis matters to a manufacturing company (cost reduction without loss of function), and explain the sequential steps of the value analysis/value engineering job plan. 10 marks · 150 words
Must cover
- Lawrence D. Miles, General Electric, 1947
- Value = Function / Cost
- Value analysis (existing product) vs value engineering (design stage)
- Use value, esteem value, cost value, exchange value
- Function stated as a verb-noun pair; basic vs secondary function
- FAST (Function Analysis System Technique) diagram
- Job plan phases: orientation/selection, information, function, creativity/speculation, evaluation, recommendation-implementation-follow-up
Loses marks
- Confusing value analysis with ordinary cost cutting and recommending quality reduction - value analysis must preserve function
- Omitting the function analysis phase, which is the defining step of the technique
- Listing the steps out of order, or merging creativity and evaluation so that ideas are judged while being generated
- Not distinguishing value analysis from value engineering when the question is about a manufacturing company
- Giving no example or measurable benefit, leaving the 'importance' half of the question thin
Earns more
- Function analysis explained properly - verb-noun definition of functions, basic versus secondary functions, FAST diagram, cost allocated to functions
- Types of value named (use, esteem, cost, exchange) or a concrete example of a substitution, e.g. replacing a machined metal bracket with an injection-moulded polymer part, or Maruti/Bajaj component localisation
- (e) Two tasks: state the salient features/characteristics of an information system, and describe its various types with suitable examples. Both halves must be present; the types must be illustrated with named systems, not just expanded acronyms. 10 marks · 150 words
Must cover
- Components: hardware, software, data, procedures, people, networks
- TPS - transaction processing system
- MIS - management information system
- DSS - decision support system
- EIS/ESS - executive information/support system
- Expert system / knowledge-based system
- OAS - office automation system; KMS - knowledge management system
- ERP, CRM, SCM as enterprise systems
- Information qualities: relevance, accuracy, timeliness, completeness
Loses marks
- Answering only about computers/IT hardware and ignoring people, procedures and data as components
- Listing acronyms without expanding them or without a single example
- Confusing DSS with MIS - MIS gives structured periodic reports, DSS supports semi-structured, ad hoc what-if analysis
- Omitting the 'features' half entirely and writing only a taxonomy of types
- Treating ERP as a 'level' of the pyramid rather than a cross-functional integrating system
Earns more
- Each type illustrated with a concrete example - e.g. TPS: railway PRS/core banking; MIS: monthly sales variance report; DSS: inventory what-if model; ESS: CEO dashboard; ES: credit-scoring or medical diagnosis system
- Enterprise/functional classification also covered - ERP, CRM, SCM, HRIS, marketing IS - or an Indian e-governance example such as GSTN, PFMS, IRCTC, UIDAI
What "Explain" is asking you to do
Make the working of something clear — what sets it off, what follows from what, and what it produces. Explain is the Commission's mechanism word: it dominates the technical papers and the “explain why” stems, where the marks sit in the causal chain and not in the label.
Structure that answers it
State what it is → the initiating condition → the chain of cause, step by step → an instance where it plays out → what the chain produces
Where marks are lost
Describing what something looks like instead of why it works that way. Naming the stages without linking them reads as description too.
Practice this exact question
Write your answer and it is marked point by point against the model answer above — what you covered, what you missed, what you got wrong.
Evaluate my answer →More from Management 2026 Paper II
- Q1 Answer each of the following questions in about 150 words : (a) Explain parametric test a…
- Q2 (a) ABC computer company is engaged in repairs and service of computers. It is trying to…
- Q3 (a) (i) What is the meaning of positive and negative correlation? Explain with suitable e…
- Q4 (a) A clock manufacturing company is planning an assembly line to produce 195 clocks per…