Paper II — Q3
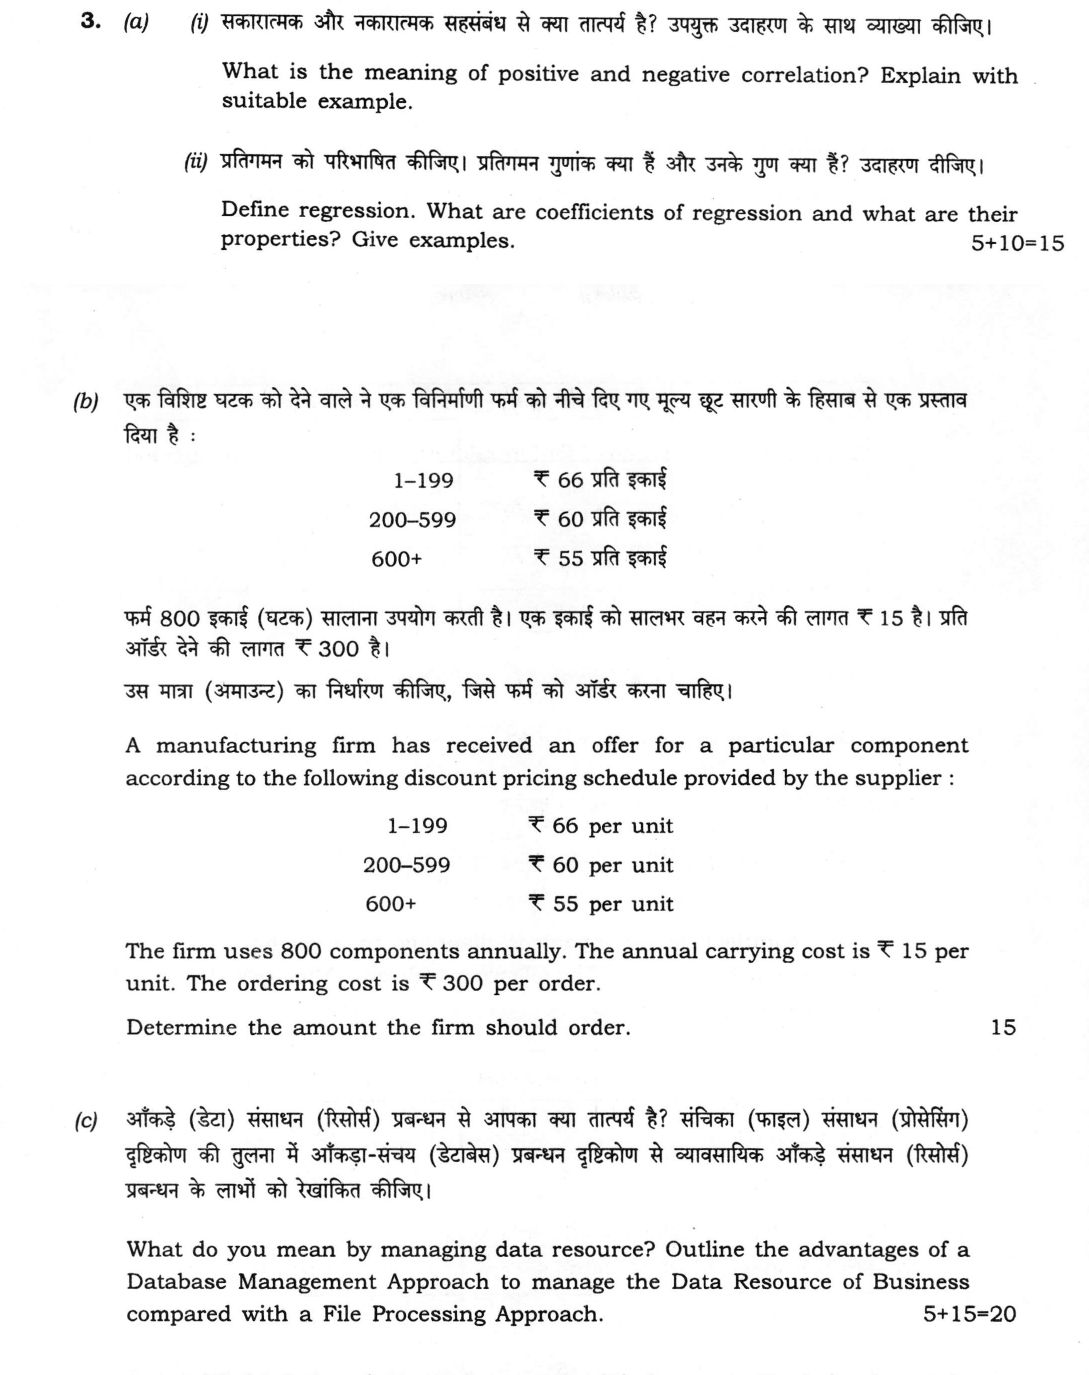
(a) (i) What is the meaning of positive and negative correlation? Explain with suitable example. (ii) Define regression. What…
What is the meaning of positive and negative correlation? Explain with suitable example.
Define regression. What are coefficients of regression and what are their properties? Give examples. 15 marks
A manufacturing firm has received an offer for a particular component according to the following discount pricing schedule provided by the supplier : 1–199 ₹ 66 per unit 200–599 ₹ 60 per unit 600+ ₹ 55 per unit The firm uses 800 components annually. The annual carrying cost is ₹ 15 per unit. The ordering cost is ₹ 300 per order. Determine the amount the firm should order. 15 marks
What do you mean by managing data resource? Outline the advantages of a Database Management Approach to manage the Data Resource of Business compared with a File Processing Approach. 20 marks
हिंदी में प्रश्न पढ़ें
सकारात्मक और नकारात्मक सहसंबंध से क्या तात्पर्य है? उपयुक्त उदाहरण के साथ व्याख्या कीजिए।
प्रतिगमन को परिभाषित कीजिए। प्रतिगमन गुणांक क्या हैं और उनके गुण क्या हैं? उदाहरण दीजिए। (15 अंक)
एक विशिष्ट घटक को देने वाले ने एक विनिर्माणी फर्म को नीचे दिए गए मूल्य छूट सारणी के हिसाब से एक प्रस्ताव दिया है : 1–199 ₹ 66 प्रति इकाई 200–599 ₹ 60 प्रति इकाई 600+ ₹ 55 प्रति इकाई फर्म 800 इकाई (घटक) सालाना उपयोग करती है। एक इकाई को सालभर वहन करने की लागत ₹ 15 है। प्रति ऑर्डर देने की लागत ₹ 300 है। उस मात्रा (अमाउन्ट) का निर्धारण कीजिए, जिसे फर्म को ऑर्डर करना चाहिए। (15 अंक)
आँकड़े (डेटा) संसाधन (रिसोर्स) प्रबन्धन से आपका क्या तात्पर्य है? संचिका (फाइल) संसाधन (प्रोसेसिंग) दृष्टिकोण की तुलना में आँकड़ा-संचय (डेटाबेस) प्रबन्धन दृष्टिकोण से व्यावसायिक आँकड़े संसाधन (रिसोर्स) प्रबन्धन के लाभों को रेखांकित कीजिए। (20 अंक)
Model answer
Drafted with AI by UPSC Answer Check against this question's marking rubric, to the expected length. UPSC does not publish answers for Mains — this is one way to score well, not an official key. How we build rubrics and answers.
(a) Correlation and regression (5 + 10 = 15 marks)
(i) Correlation measures the direction and strength of the linear relationship between two variables. Positive correlation: both variables move in the same direction, as advertising expenditure and sales rise together. Negative correlation: they move in opposite directions, as the price of a product rises and quantity demanded falls. Pearson's coefficient r = Σ(x − x̄)(y − ȳ)/√[Σ(x − x̄)² Σ(y − ȳ)²] lies between −1 (perfect negative) and +1 (perfect positive), with 0 meaning no linear relationship. A scatter diagram sloping upwards indicates positive and downwards indicates negative correlation. Correlation shows association, not causation.
(ii) Regression is a statistical technique for estimating or predicting the average value of one variable (dependent) from the known value of another (independent), by fitting a line to the data. There are two regression lines: Y on X, Y − Ȳ = b_yx(X − X̄), and X on Y, X − X̄ = b_xy(Y − Ȳ). The regression coefficients are
b_yx = Σ(x − x̄)(y − ȳ)/Σ(x − x̄)² = r σ_y/σ_x, and b_xy = Σ(x − x̄)(y − ȳ)/Σ(y − ȳ)² = r σ_x/σ_y.
Properties: (1) r² = b_yx × b_xy, so r is the geometric mean of the two coefficients, with their common sign; (2) both coefficients have the same sign, since each has the sign of the covariance; (3) both cannot exceed 1, so if one is greater than 1 the other is less than 1; (4) the arithmetic mean of the coefficients is at least r; (5) they are independent of a change of origin but not of scale; (6) the two lines intersect at (X̄, Ȳ); and (7) the coefficient measures the change in the dependent variable per unit change in the independent variable.
Example: advertising X (₹ lakh) = 1, 2, 3, 4, 5 and sales Y (₹ crore) = 2, 4, 5, 4, 5. X̄ = 3, Ȳ = 4, Σ(x − x̄)(y − ȳ) = 6, Σ(x − x̄)² = 10, Σ(y − ȳ)² = 6. So b_yx = 0.6, b_xy = 1.0 and r = √(0.6 × 1.0) = 0.775. The line Y on X is Y = 2.2 + 0.6X: each additional lakh of advertising is associated with ₹0.6 crore more sales; for X = 6, predicted Y = 5.8.
(b) Order quantity with price discounts (15 marks)
Annual demand D = 800, ordering cost S = ₹300, carrying cost H = ₹15 per unit per year (fixed, not a percentage of price). The EOQ is √(2DS/H) = √(2 × 800 × 300/15) = √32,000 = 178.9 units, the same for every price because H is fixed.
Check feasibility. At ₹66 (range 1-199), 178.9 is feasible. At ₹60 (range 200-599), 178.9 is below the range, so the lowest feasible quantity is 200. At ₹55 (range 600+), the feasible quantity is 600. Compare total annual costs, TC = DP + (D/Q)S + (Q/2)H:
- Q = 178.9 at ₹66: purchase 800 × 66 = 52,800; ordering (800/178.9) × 300 = 1,341.6; carrying (178.9/2) × 15 = 1,341.6; total = ₹55,483.
- Q = 200 at ₹60: purchase 48,000; ordering (800/200) × 300 = 1,200; carrying (200/2) × 15 = 1,500; total = ₹50,700.
- Q = 600 at ₹55: purchase 44,000; ordering (800/600) × 300 = 400; carrying (600/2) × 15 = 4,500; total = ₹48,900.
The total cost is least at Q = 600, so the firm should order 600 units each time (1.33 orders a year), saving ₹1,800 a year against 200 units and about ₹6,583 against the ₹66 EOQ.
(c) Managing data resource and database approach (5 + 15 = 20 marks)
Managing the data resource means treating data as a valuable organisational asset and managing it, through planning, organisation, control and technology, so that accurate, timely, secure and consistent data are available to all who need them. It includes data planning and standards, database administration, defining data structures and metadata in a data dictionary, ensuring quality and integrity, security and privacy, and backup and recovery, using a database management system (DBMS) and data warehouses.
In a file processing approach each application (payroll, sales, inventory) keeps its own files, with its own record formats, so data are duplicated and tied to programs. A database management approach keeps data in a shared, integrated database controlled by a DBMS. Advantages:
- Reduced redundancy: data are stored once, saving storage and effort.
- Consistency and integrity: a single update reaches every user, avoiding conflicting versions, and integrity rules can be enforced centrally.
- Data independence: programs are separated from the physical storage and structure, so changes to data structure or hardware do not require rewriting applications; file systems have program-data dependence.
- Data sharing and integration across departments, giving management a single view of the business.
- Ad hoc query and reporting: users can ask questions with query languages such as SQL, without programmers, while file systems need custom programs.
- Better security and access control by user and by field, with backup, recovery and concurrency control for multi-user access.
- Standards and administration: a database administrator applies uniform standards, improves data quality and governance.
- Faster application development and lower maintenance, since new applications reuse existing data.
- Better decision support through data warehouses and analytics.
The costs are higher expense for the DBMS and hardware, need for skilled staff, complexity, and greater damage from failure if backups are inadequate; for the business these are outweighed by the benefits.
How this answer will be evaluated
Evaluation rubric
Each sub-part is marked on its own, against the marks and word limit printed on the paper.
- (a) (i) Meaning of positive and negative correlation with an example (5); (ii) define regression, regression coefficients and their properties, with examples (10). 15 marks
Must cover
- Positive and negative correlation defined with business examples; r between −1 and +1
- Regression defined; two lines Y on X and X on Y
- b_yx = rσ_y/σ_x and b_xy = rσ_x/σ_y
- Properties: r² = b_yx·b_xy, same sign, both cannot exceed 1, independent of origin not scale, lines meet at the means; a worked example
Loses marks
- Confusing correlation with regression.
- Saying regression coefficients can have opposite signs.
- No example.
Earns more
- Formula for r and scatter-diagram interpretation.
- Numerical example with correct b values.
Extra mark
- Correlation does not imply causation
- (b) Quantity-discount problem: D = 800, S = ₹300, H = ₹15, prices ₹66/60/55: determine the order quantity (15). 15 marks
Must cover
- EOQ = √(2DS/H) = 178.9, same for all prices
- Feasibility: 178.9 valid only at ₹66; adjust to 200 at ₹60 and 600 at ₹55
- Total cost at each option: 55,483; 50,700; 48,900
- Decision: order 600 units (lowest total cost)
Loses marks
- Choosing the EOQ 178.9 or 200 without comparing total costs.
- Omitting the purchase cost from the comparison.
- Computing carrying cost as a percentage of price.
Earns more
- Ordering and carrying cost computed correctly for each option.
- Explanation of why the fixed carrying cost gives the same EOQ.
Extra mark
- Annual saving stated
- (c) (i) What is managing data resource (5); (ii) advantages of the database approach over the file processing approach (15). 20 marks
Must cover
- Data as an organisational asset; planning, standards, administration, quality, security
- File processing: separate files per application, redundancy and dependence
- Database advantages: reduced redundancy, consistency and integrity, data independence, sharing
- Further advantages: ad hoc query, security and recovery, standards and administration, faster development; costs noted
Loses marks
- Describing DBMS without the comparison.
- Listing advantages without explanation.
- Confusing data resource management with data entry.
Earns more
- Named examples (payroll, inventory, SQL).
- Balanced view including costs.
Extra mark
- Data warehouses and analytics
What "Explain" is asking you to do
Make the working of something clear — what sets it off, what follows from what, and what it produces. Explain is the Commission's mechanism word: it dominates the technical papers and the “explain why” stems, where the marks sit in the causal chain and not in the label.
Structure that answers it
State what it is → the initiating condition → the chain of cause, step by step → an instance where it plays out → what the chain produces
Where marks are lost
Describing what something looks like instead of why it works that way. Naming the stages without linking them reads as description too.
Practice this exact question
Write your answer and it is marked point by point against the model answer above — what you covered, what you missed, what you got wrong.
Evaluate my answer →More from Management 2026 Paper II
- Q1 Answer each of the following questions in about 150 words : (a) Explain parametric test a…
- Q2 (a) ABC computer company is engaged in repairs and service of computers. It is trying to…
- Q3 (a) (i) What is the meaning of positive and negative correlation? Explain with suitable e…
- Q4 (a) A clock manufacturing company is planning an assembly line to produce 195 clocks per…
- Q5 Answer each of the following questions in about 150 words : (a) Give a fair overview of r…
- Q6 (a) (i) Small-scale industries are facing tough challenges in India. Elaborate the factor…