Paper II — Q2
(a) ABC computer company is engaged in repairs and service of computers. It is trying to forecast the demand for next 12 months…
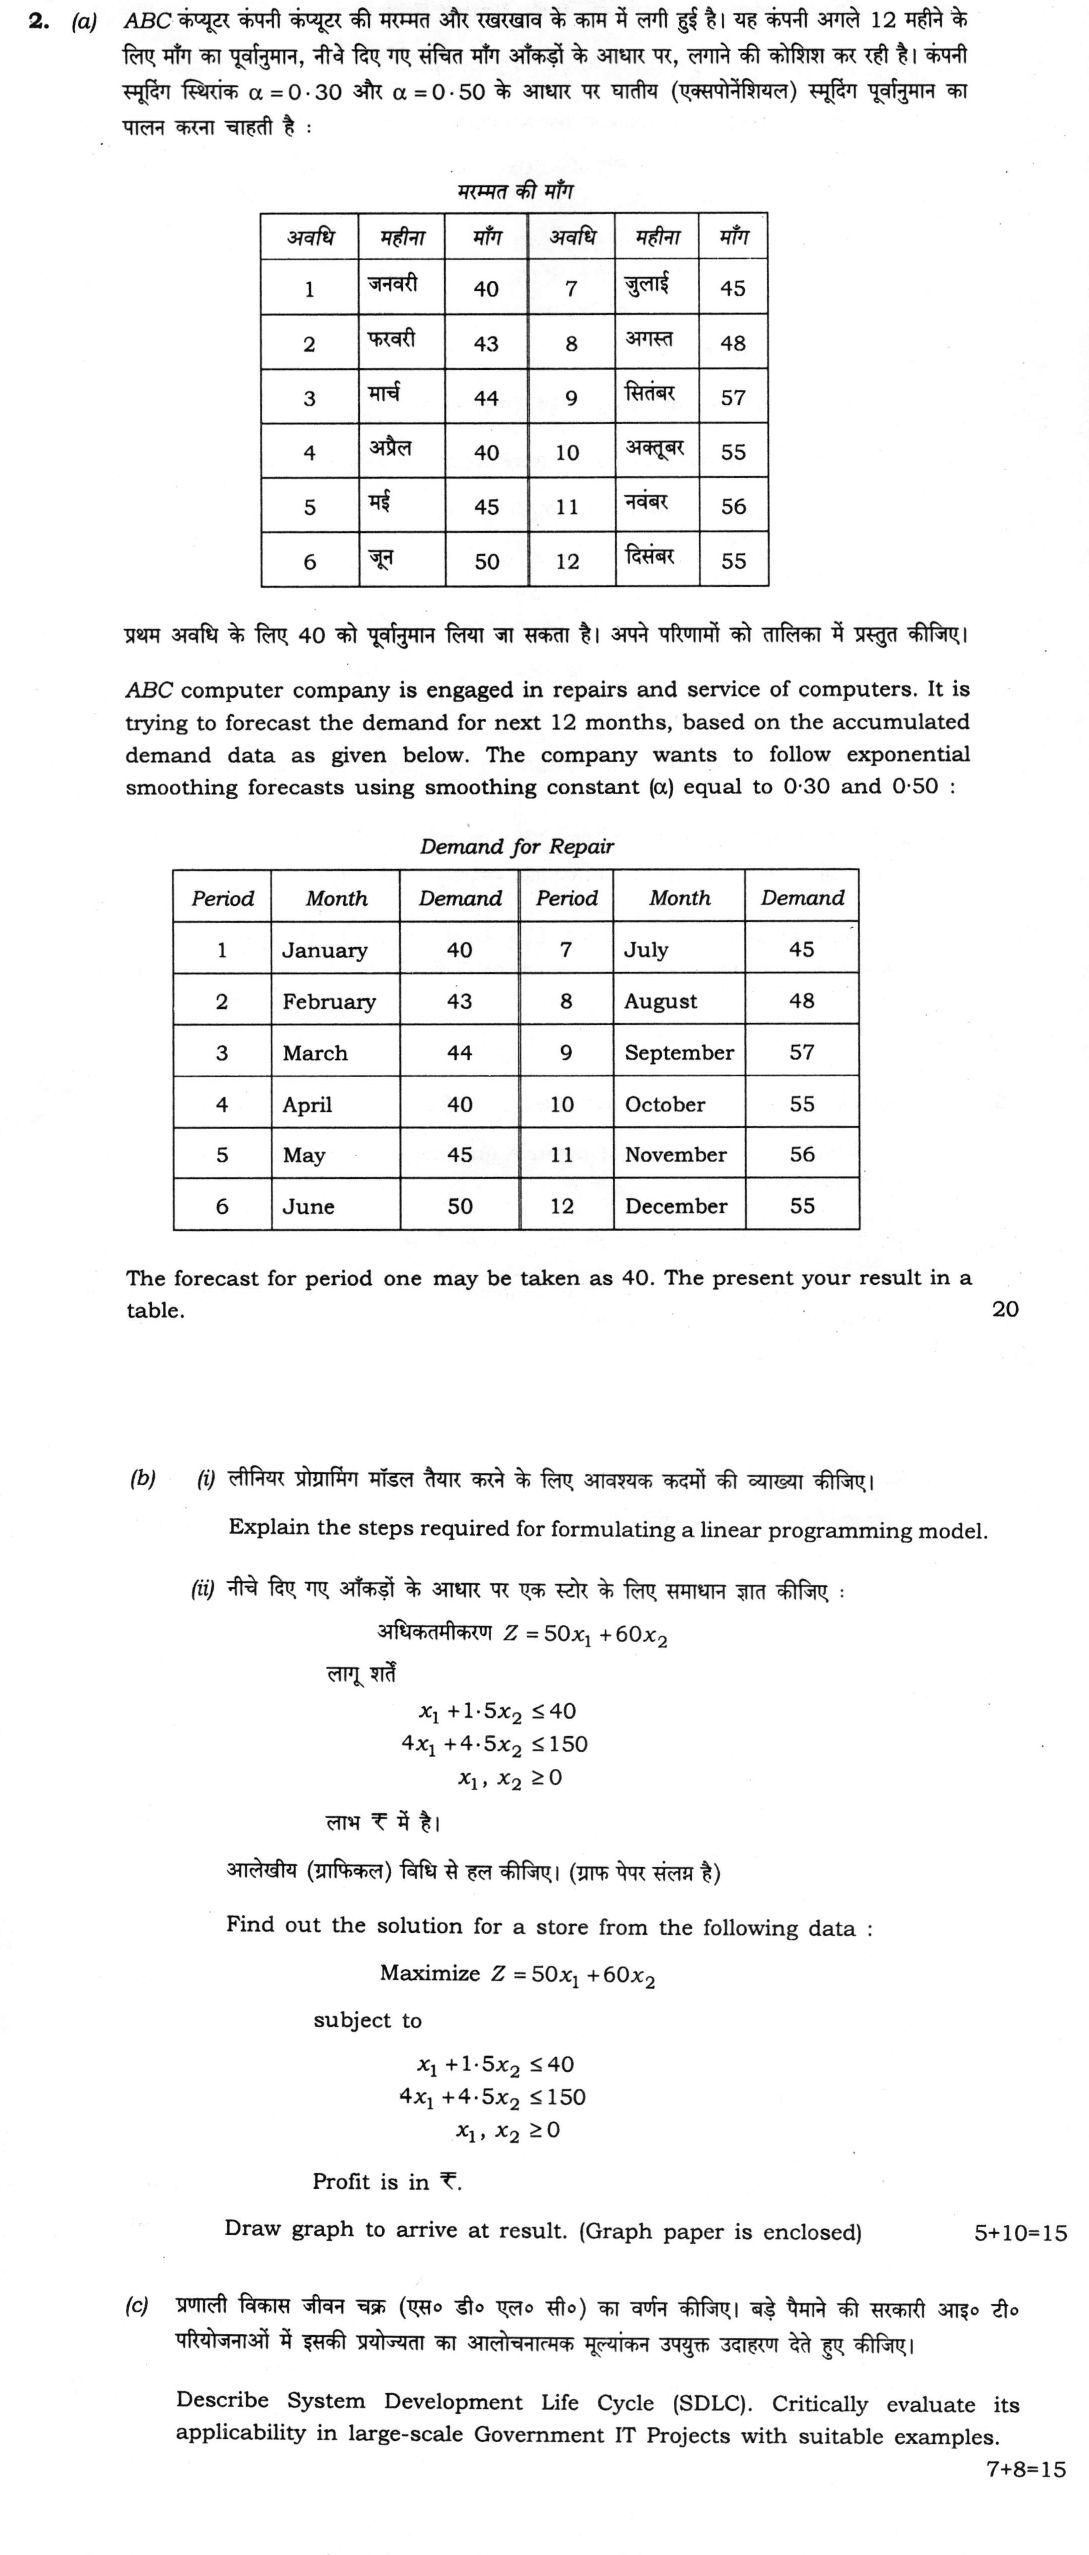
ABC computer company is engaged in repairs and service of computers. It is trying to forecast the demand for next 12 months, based on the accumulated demand data as given below. The company wants to follow exponential smoothing forecasts using smoothing constant (α) equal to 0·30 and 0·50 :
Demand for Repair
| Period | Month | Demand | Period | Month | Demand |
|---|---|---|---|---|---|
| 1 | January | 40 | 7 | July | 45 |
| 2 | February | 43 | 8 | August | 48 |
| 3 | March | 44 | 9 | September | 57 |
| 4 | April | 40 | 10 | October | 55 |
| 5 | May | 45 | 11 | November | 56 |
| 6 | June | 50 | 12 | December | 55 |
The forecast for period one may be taken as 40. The present your result in a table. 20 marks
Explain the steps required for formulating a linear programming model.
Find out the solution for a store from the following data : Maximize Z = 50x₁ + 60x₂ subject to x₁ + 1·5x₂ ≤ 40 4x₁ + 4·5x₂ ≤ 150 x₁, x₂ ≥ 0 Profit is in ₹. Draw graph to arrive at result. (Graph paper is enclosed) 15 marks
Describe System Development Life Cycle (SDLC). Critically evaluate its applicability in large-scale Government IT Projects with suitable examples. 15 marks
हिंदी में प्रश्न पढ़ें
ABC कंप्यूटर कंपनी कंप्यूटर की मरम्मत और रखरखाव के काम में लगी हुई है। यह कंपनी अगले 12 महीने के लिए माँग का पूर्वानुमान, नीचे दिए गए संचित माँग आँकड़ों के आधार पर, लगाने की कोशिश कर रही है। कंपनी स्मूदिंग स्थिरांक α = 0·30 और α = 0·50 के आधार पर घातीय (एक्सपोनेन्शियल) स्मूदिंग पूर्वानुमान का पालन करना चाहती है :
मरम्मत की माँग
| अवधि | महीना | माँग | अवधि | महीना | माँग |
|---|---|---|---|---|---|
| 1 | जनवरी | 40 | 7 | जुलाई | 45 |
| 2 | फरवरी | 43 | 8 | अगस्त | 48 |
| 3 | मार्च | 44 | 9 | सितंबर | 57 |
| 4 | अप्रैल | 40 | 10 | अक्टूबर | 55 |
| 5 | मई | 45 | 11 | नवंबर | 56 |
| 6 | जून | 50 | 12 | दिसंबर | 55 |
प्रथम अवधि के लिए 40 को पूर्वानुमान लिया जा सकता है। अपने परिणामों को तालिका में प्रस्तुत कीजिए। (20 अंक)
लीनियर प्रोग्रामिंग मॉडल तैयार करने के लिए आवश्यक कदमों की व्याख्या कीजिए।
नीचे दिए गए आँकड़ों के आधार पर एक स्टोर के लिए समाधान ज्ञात कीजिए : अधिकतमीकरण Z = 50x₁ + 60x₂ लागू शर्तें x₁ + 1·5x₂ ≤ 40 4x₁ + 4·5x₂ ≤ 150 x₁, x₂ ≥ 0 लाभ ₹ में है। आलेखीय (ग्राफिकल) विधि से हल कीजिए। (ग्राफ पेपर संलग्न है) (15 अंक)
प्रणाली विकास जीवन चक्र (एस० डी० एल० सी०) का वर्णन कीजिए। बड़े पैमाने की सरकारी आई० टी० परियोजनाओं में इसकी प्रयोज्यता का आलोचनात्मक मूल्यांकन उपयुक्त उदाहरण देते हुए कीजिए। (15 अंक)
Model answer
Drafted with AI by UPSC Answer Check against this question's marking rubric, to the expected length. UPSC does not publish answers for Mains — this is one way to score well, not an official key. How we build rubrics and answers.
(a) Exponential Smoothing Forecast Single exponential smoothing: F(t+1) = αD(t) + (1 − α)F(t), with F(1) = 40 for both series.
Illustration (α = 0.30): F(2) = 0.3 × 40 + 0.7 × 40 = 40.00; F(3) = 0.3 × 43 + 0.7 × 40 = 40.90; F(4) = 0.3 × 44 + 0.7 × 40.90 = 41.83. (α = 0.50): F(3) = 0.5 × 43 + 0.5 × 40 = 41.50; F(4) = 0.5 × 44 + 0.5 × 41.50 = 42.75.
| Period | Month | Demand D | F (α = 0.30) | abs(D − F) | F (α = 0.50) | abs(D − F) |
|---|---|---|---|---|---|---|
| 1 | January | 40 | 40.00 | 0.00 | 40.00 | 0.00 |
| 2 | February | 43 | 40.00 | 3.00 | 40.00 | 3.00 |
| 3 | March | 44 | 40.90 | 3.10 | 41.50 | 2.50 |
| 4 | April | 40 | 41.83 | 1.83 | 42.75 | 2.75 |
| 5 | May | 45 | 41.28 | 3.72 | 41.38 | 3.62 |
| 6 | June | 50 | 42.40 | 7.60 | 43.19 | 6.81 |
| 7 | July | 45 | 44.68 | 0.32 | 46.59 | 1.59 |
| 8 | August | 48 | 44.77 | 3.23 | 45.80 | 2.20 |
| 9 | September | 57 | 45.74 | 11.26 | 46.90 | 10.10 |
| 10 | October | 55 | 49.12 | 5.88 | 51.95 | 3.05 |
| 11 | November | 56 | 50.88 | 5.12 | 53.47 | 2.53 |
| 12 | December | 55 | 52.42 | 2.58 | 54.74 | 0.26 |
| 13 | Next January | — | 53.19 | 54.87 |
Error comparison: sum of absolute errors = 47.64 (α = 0.30) and 38.42 (α = 0.50). MAD over 12 periods = 47.64 ÷ 12 = 3.97 and 38.42 ÷ 12 = 3.20 (over the 11 genuine forecasts: 4.33 and 3.49).
Conclusion: α = 0.50 gives the lower MAD and is preferred; a higher α weights recent demand more and tracks the rise after August faster. Single exponential smoothing gives a flat forecast for all future months — 53.19 (α = 0.30) or 54.87 (α = 0.50) for each of the next 12 months — and lags a trend, so Holt's trend-adjusted smoothing would be better for the coming year.
(b)(i) Steps in Formulating a Linear Programming Model
- Identify the decision variables (e.g., x₁, x₂ units of each product).
- State the objective function as a linear expression to be maximised (profit) or minimised (cost).
- Express each resource limitation as a linear constraint (≤, ≥ or =).
- Add non-negativity restrictions (x₁, x₂ ≥ 0).
- Check the LP assumptions: proportionality, additivity, divisibility, certainty and linearity.
(b)(ii) Graphical Solution Maximise Z = 50x₁ + 60x₂ subject to x₁ + 1.5x₂ ≤ 40, 4x₁ + 4.5x₂ ≤ 150, x₁, x₂ ≥ 0.
Plotting (x₁ on the horizontal axis): Constraint 1 line x₁ + 1.5x₂ = 40 passes through (40, 0) and (0, 26.67). Constraint 2 line 4x₁ + 4.5x₂ = 150 passes through (37.5, 0) and (0, 33.33). The feasible region is the area below both lines in the first quadrant, bounded by O, A, B and C.
Intersection B: multiply constraint 1 by 4: 4x₁ + 6x₂ = 160. Subtract constraint 2: 1.5x₂ = 10, so x₂ = 20/3 = 6.67 and x₁ = 40 − 1.5 × 20/3 = 30.
Corner points and Z (corner-point theorem): O (0, 0): Z = 0 A (37.5, 0): Z = 1,875 B (30, 6.67): Z = 50 × 30 + 60 × 20/3 = 1,500 + 400 = 1,900 C (0, 26.67): Z = 60 × 80/3 = 1,600
Optimal solution: x₁ = 30, x₂ = 20/3 ≈ 6.67, maximum profit Z = ₹1,900. Both constraints are binding at B (zero slack in both resources).

(c) SDLC and Large Government IT Projects The System Development Life Cycle is a structured sequence for building information systems:
- Feasibility study: technical, economic and operational viability.
- Requirement analysis: user needs captured in a Software Requirements Specification (SRS).
- Design: architecture, data-flow diagrams and database design.
- Coding.
- Testing: unit, integration, system and user-acceptance testing.
- Implementation: changeover by direct, parallel, pilot or phased methods, with training.
- Maintenance: corrective, adaptive, perfective and preventive.
Process models range from the classical waterfall to prototyping, spiral (Barry Boehm), incremental, V-model and Agile.
Critical evaluation for large government projects: Strengths: SDLC's documentation, stage gates and audit trail suit public procurement, accountability and security certification (STQC testing, CERT-In audits); the IndEA (India Enterprise Architecture) framework and NeGD guidelines build on it.
Weaknesses: rigid waterfall execution struggles when rules change mid-project. GSTN faced return-filing glitches and deadline extensions after its 2017 launch as GST rules kept changing, and the migration to MCA21 Version 3 in 2023 caused portal glitches that forced the ministry to extend filing deadlines — showing weaknesses in testing and changeover.
Adaptations: Aadhaar was rolled out in phases on a scalable architecture, and UPI has evolved through successive versions — examples of iterative delivery within an SDLC discipline.
Verdict: SDLC remains necessary for control and accountability in government IT, but it should be applied through iterative or hybrid models, with pilot and phased changeover and strong user-acceptance testing.

How this answer will be evaluated
Evaluation rubric
Each sub-part is marked on its own, against the marks and word limit printed on the paper.
- (a) Compute single exponential smoothing forecasts for the 12 monthly repair demands with alpha = 0.30 and alpha = 0.50, taking F1 = 40, present both series in a table (including the forecast for the next period), and compare the two smoothing constants on forecast error. 20 marks
Must cover
- F(t+1) = alpha.D(t) + (1 - alpha).F(t)
- F1 = 40 (January) for both series
- alpha = 0.30 December forecast = 52.42; next-period (January) forecast = 53.19
- alpha = 0.50 December forecast = 54.74; next-period (January) forecast = 54.87
- MAD(0.30) = 3.97 and MAD(0.50) = 3.20
- Recommendation: alpha = 0.50 (lower MAD, faster response to the upward trend)
- Single exponential smoothing lags a trend; Holt's model corrects it
Loses marks
- Shifting the series by one period - reporting F(t) against the demand of period t+1, or updating the forecast using the current period's own demand
- Using a simple moving average or weighted average instead of the recursive smoothing formula
- Rounding to whole numbers at every step so that the later forecasts drift by 1-2 units from the true values
- Stopping at December and not giving the forecast for the next period, though the company wants the forecast for the coming months
- Not presenting a table, although the question specifically asks for the result in tabular form, and not comparing the two alphas at all
Earns more
- Error comparison computed: MAD(alpha = 0.30) = 47.64/12 = 3.97 versus MAD(alpha = 0.50) = 38.42/12 = 3.20, so alpha = 0.50 is the better constant
- Interpretation: higher alpha gives more weight to recent observations and responds faster to the rising demand after August; single exponential smoothing lags a trend, so Holt's trend-adjusted model would be preferable
- (b) Part (i), 5 marks: explain the steps in formulating a linear programming model. Part (ii), 10 marks: solve, graphically, Maximize Z = 50x1 + 60x2 subject to x1 + 1.5x2 <= 40, 4x1 + 4.5x2 <= 150, x1, x2 >= 0, and state the optimal product mix and profit in rupees. Both a drawn graph and the corner-point evaluation are required. 15 marks
Must cover
- Decision variables, objective function, constraints, non-negativity restrictions
- LP assumptions: proportionality, additivity, divisibility, certainty, linearity
- Intercepts (40, 0), (0, 26.67), (37.5, 0), (0, 33.33)
- Corner points O(0,0), A(37.5, 0), B(30, 6.67), C(0, 26.67)
- Extreme point / corner point theorem
- FINAL ANSWER: x1 = 30, x2 = 20/3 = 6.67, Z(max) = Rs 1,900
- Both constraints binding; slack = 0 in both resources
Loses marks
- Not drawing the graph at all, or drawing it without shading and labelling the feasible region, although graph paper is supplied and the question says 'draw graph to arrive at result'
- Reading the intersection point off the graph as (30, 7) or (30, 6) instead of solving the two equations simultaneously to get x2 = 20/3
- Testing only the axis intercepts and missing the intersection corner, which yields the wrong maximum of Rs 1,875
- Arithmetic slip in the substitution: writing 4(40 - 1.5x2) as 160 - 4.5x2 instead of 160 - 6x2
- Forgetting the rupee unit or stopping at the coordinates without computing Z; or rounding the optimum to (30, 6) and reporting Rs 1,860 (integers were not required; even the true integer optimum would be Rs 1,890 at (33, 4))
- (c) Two tasks worth 7 + 8: describe the System Development Life Cycle with its phases, then critically evaluate - strengths and weaknesses both - whether the classical SDLC is suited to large-scale government IT projects, backed by named Indian examples. 15 marks
Must cover
- SDLC phases: feasibility, requirement analysis, design, coding, testing, implementation, maintenance
- SRS - Software Requirements Specification; DFD
- Changeover methods: direct, parallel, pilot, phased
- Waterfall, prototyping, spiral (Barry Boehm), incremental, RAD, V-model, Agile
- Maintenance types: corrective, adaptive, perfective, preventive
- Named Indian projects: Aadhaar/UIDAI, GSTN, UPI/NPCI, PFMS, CCTNS, MCA21, IRCTC
- STQC / CERT-In audit, GIGW, NeGD, IndEA (India Enterprise Architecture)
Loses marks
- Writing only the phase list and skipping the 'critically evaluate' half, which carries 8 of the 15 marks
- One-sided praise or one-sided condemnation of SDLC instead of a balanced critical evaluation
- Generic examples ('many government projects fail') with no named project
- Confusing SDLC with the waterfall model and therefore arguing that SDLC can never be iterative
- Omitting the implementation/changeover and maintenance phases, which are exactly where government projects most often stumble
Earns more
- Process models distinguished - waterfall/classical, prototyping, spiral (Boehm), incremental/iterative, RAD, V-model, Agile - and the point made that the choice of model, not SDLC itself, drives flexibility
What "Discuss" is asking you to do
Lay the issue out from more than one side — how it arose, what is claimed for it, what is held against it, and where it now stands. UPSC attaches discuss to broad topics with several live dimensions, so coverage of the dimensions earns more than the strength of your opinion.
Structure that answers it
Set the issue up → the case as it is made → the case against → the dimension both sides leave out → where the balance now lies
Where marks are lost
Listing facts with no thread between them, or arguing one side throughout and calling it a discussion.
Practice this exact question
Write your answer and it is marked point by point against the model answer above — what you covered, what you missed, what you got wrong.
Evaluate my answer →More from Management 2026 Paper II
- Q1 Answer each of the following questions in about 150 words : (a) Explain parametric test a…
- Q2 (a) ABC computer company is engaged in repairs and service of computers. It is trying to…
- Q3 (a) (i) What is the meaning of positive and negative correlation? Explain with suitable e…
- Q4 (a) A clock manufacturing company is planning an assembly line to produce 195 clocks per…
- Q5 Answer each of the following questions in about 150 words : (a) Give a fair overview of r…