Paper I — Q8
(a) What are the various computer languages used for NC machines? Explain the merits and limitations of each language. (10…
What are the various computer languages used for NC machines? Explain the merits and limitations of each language. 10 marks
A small manufacturing unit produces bolts and the weight of each bolt is measured. The target weight for a bolt is 60 grams. A sample of 5 bolts is taken every day for 30 days. The weight (in grams) for first 5 days is given below: Calculate the control limits for the X̄ (X-bar) chart. The constant A₂ for a sample size of 5 is 0·577. 20 marks
A certain component can be manufactured either by welding or by forging process. The factory has an order for 5,00,000 units. The costs involved for both methods of manufacturing are as follows:
| Cost | Welding | Forging |
|---|---|---|
| Fixed cost | ₹ 15,000 | ₹ 94,000 |
| Variable cost/unit | ₹ 5 | ₹ 4·25 |
Which is the most economical method of manufacturing the component? Draw the indicative graph also for BEP.
What will be the loss if a wrong choice is made? 20 marks
हिंदी में प्रश्न पढ़ें
NC मशीनों के लिए उपयोग की जाने वाली विभिन्न कंप्यूटर भाषाएं कौन-सी हैं? प्रत्येक भाषा के लाभ एवं सीमाएं स्पष्ट कीजिए। 10 marks
एक छोटी विनिर्माण इकाई में बोल्ट का उत्पादन होता है तथा प्रत्येक बोल्ट का भार मापा जाता है। एक बोल्ट का लक्षित भार 60 ग्राम है। प्रतिदिन 5 बोल्ट के नमूने 30 दिन तक लिए गए हैं। पहले 5 दिनों का भार (ग्राम में) नीचे दिया गया है: X̄ (X-bar) चार्ट के लिए नियंत्रण सीमाएं परिकलित कीजिए। नमूना आकार 5 के लिए स्थिरांक A₂ 0·577 है। 20 marks
एक निश्चित घटक को या तो वेल्डन से या फिर फोजन (फोर्जिंग) प्रक्रिया से निर्मित किया जा सकता है। कारखाने के पास 5,00,000 इकाइयों का एक आदेश है। निर्माण की दोनों विधियों में संलग्न लागत इस प्रकार है:
| लागत | वेल्डन | फोजन |
|---|---|---|
| अचल लागत | ₹ 15,000 | ₹ 94,000 |
| परिवर्तनीय लागत/इकाई | ₹ 5 | ₹ 4·25 |
घटक का उत्पादन करने का सबसे किफायती तरीका कौन-सा है? BEP के लिए सांकेतिक ग्राफ भी बनाइए।
गलत चुनाव करने पर क्या नुकसान होगा? 20 marks
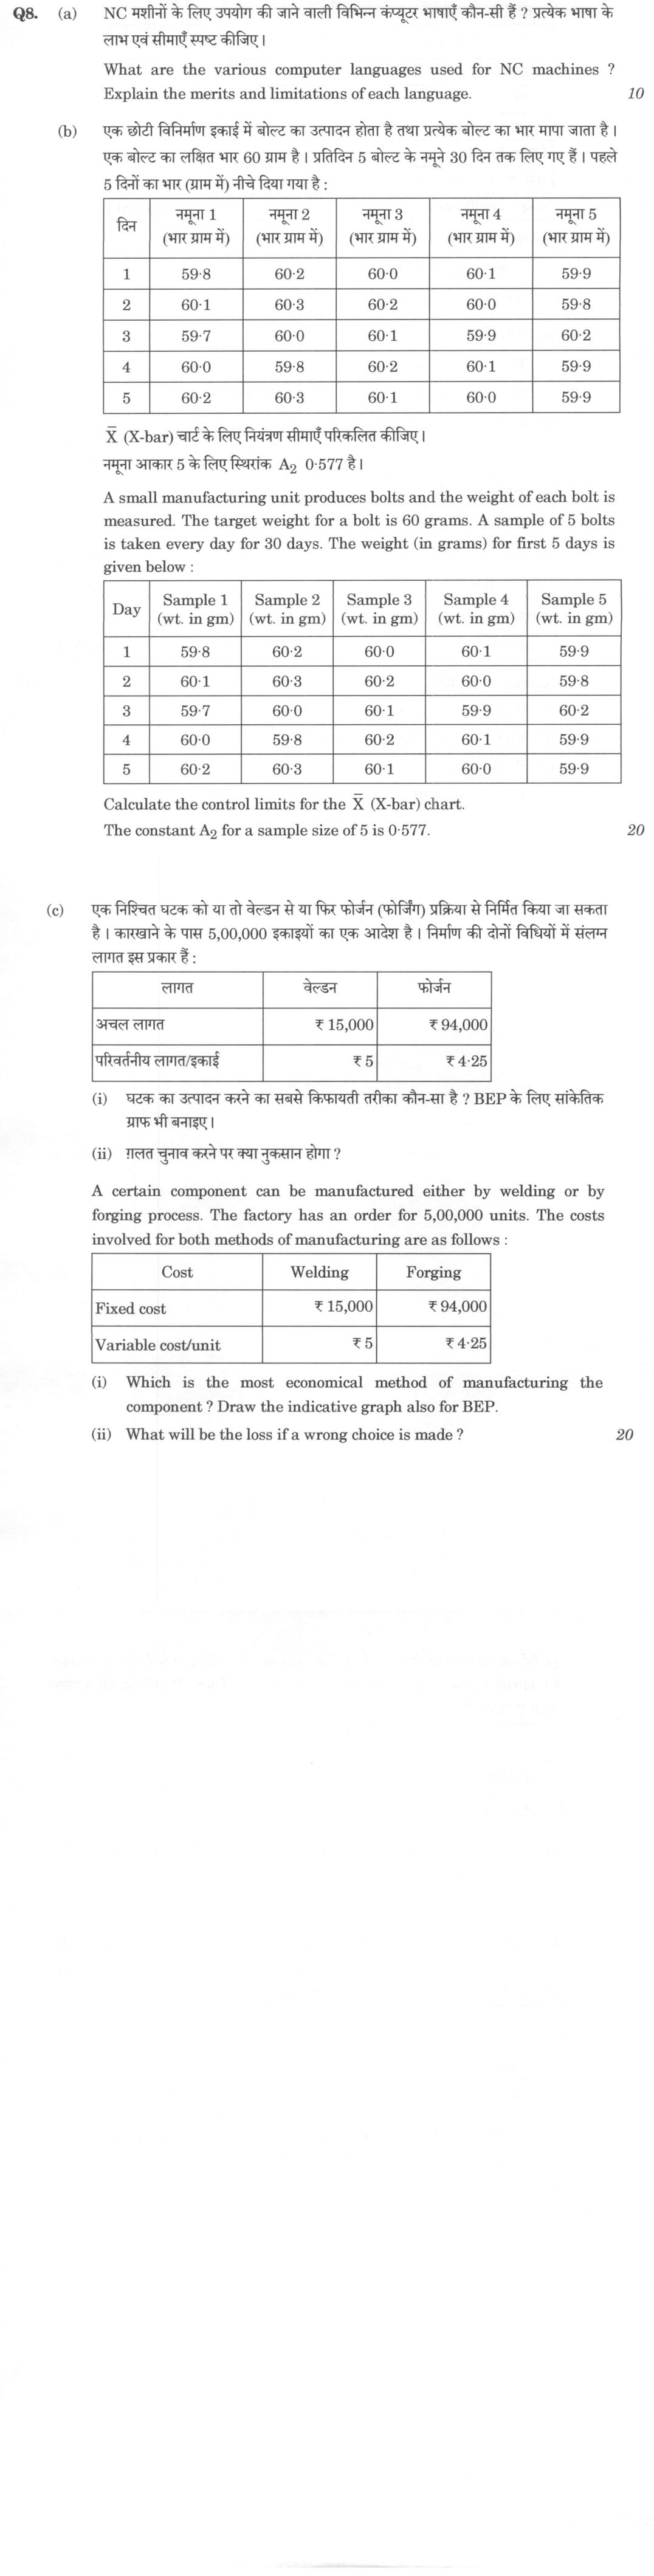
The figure this question refers to, in words
The question paper is a scan and the diagram did not survive as text. This is the figure as read from the original page — every component, value and label — so the question can be worked from the text below.
(b) Table with columns: Day, Sample 1 (wt. in gm), Sample 2 (wt. in gm), Sample 3 (wt. in gm), Sample 4 (wt. in gm), Sample 5 (wt. in gm). Rows: Day 1: 59.8, 60.2, 60.0, 60.1, 59.9; Day 2: 60.1, 60.3, 60.2, 60.0, 59.8; Day 3: 59.7, 60.0, 60.1, 59.9, 60.2; Day 4: 60.0, 59.8, 60.2, 60.1, 59.9; Day 5: 60.2, 60.3, 60.1, 60.0, 59.9.
(c) Table with header row: Cost, Welding, Forging. Row 1: Fixed cost, ₹ 15,000, ₹ 94,000. Row 2: Variable cost/unit, ₹ 5, ₹ 4.25.
What "Calculate" is asking you to do
Apply the standard formula or schedule to data the question has already supplied — a table of readings, cost records, a balance sheet — and produce the number. The method is rarely in doubt; the marks sit in the named intermediate quantities, each of which has to appear as a labelled line.
Structure that answers it
Data as given → formula or standard treatment, named → substitution → each intermediate, labelled → result with units
Where marks are lost
Omitting an intermediate the marking scheme pays for separately, or rounding at an intermediate line so the final figure drifts. In commerce and accountancy, any figure in a statement that no numbered working note supports is treated as unearned.
How this answer will be evaluated
Approach
Framework: UPSC Mechanical Engineering Paper 1. (a) explain: definition/context > points in order > small example > short close | (b) calculate: given > formula > substitution > result with units > interpretation | (c(i)) calculate: given > formula > substitution > result with units > interpretation | (c(ii)) calculate: given > formula > substitution > result with units > interpretation Full marks: Precise calculations, clear graphs, and comprehensive language analysis.
Key points expected
- Identify at least two NC languages (e.g., APT, G-code)
- State merits for each language identified
- State limitations for each language identified
- Distinguish between high-level and low-level languages
- Calculate the mean (X-bar) for each of the 5 days
- Determine the grand mean (X-double-bar)
- Calculate the range (R) for each day and mean range (R-bar)
- Apply formula UCL/LCL = X-double-bar ± A2 * R-bar
Evaluation rubric
Each sub-part is marked on its own, against the marks and word limit printed on the paper.
- (a) List NC languages and detail their merits and limitations. 10 marks
explain— definition/context → points in order → small example → short close
Must cover
- Identify at least two NC languages (e.g., APT, G-code)
- State merits for each language identified
- State limitations for each language identified
- Distinguish between high-level and low-level languages
Loses marks
- Listing languages without specific merits/limitations
- Confusing NC with general-purpose programming
Earns more
- Mention specific features like macro capabilities
- Reference standardization bodies (e.g., ISO)
Extra mark
- Provide a code snippet example
- (b) Compute X-bar chart control limits using the provided data. 20 marks
calculate— given → formula → substitution → result with units → interpretation
Must cover
- Calculate the mean (X-bar) for each of the 5 days
- Determine the grand mean (X-double-bar)
- Calculate the range (R) for each day and mean range (R-bar)
- Apply formula UCL/LCL = X-double-bar ± A2 * R-bar
Loses marks
- Using incorrect A2 constant for n=5
- Arithmetic errors in mean or range calculations
Earns more
- Presenting data in a clear tabular format
- Explicitly stating the A2 constant used
Extra mark
- Plotting the calculated points on a chart
- (c(i)) Determine the most economical method and draw the BEP graph. 20 marks
calculate— given → formula → substitution → result with units → interpretation
Must cover
- Calculate Break-Even Point (BEP) quantity
- Compare total costs at 5,00,000 units
- Identify the lower cost method as most economical
- Draw a labelled graph showing cost lines and BEP
Loses marks
- Failing to draw the indicative graph
- Incorrect BEP formula application
Earns more
- Writing the cost equations for both methods
- Clearly marking the intersection point on the graph
Extra mark
- Calculating the exact cost difference at 5,00,000 units
- (c(ii)) Quantify the financial loss from choosing the wrong method.
calculate— given → formula → substitution → result with units → interpretation
Must cover
- Calculate total cost for the chosen method
- Calculate total cost for the rejected method
- Subtract the lower cost from the higher cost
Loses marks
- Confusing fixed and variable cost components
- Failing to show the subtraction step
Earns more
- Expressing the loss in currency units (₹)
Extra mark
- Expressing the loss as a percentage of the optimal cost
Model answer coming soon
Every evaluation on this site is marked against a verified model answer. This question's answer is still being written; evaluation opens the moment it lands.
More from Mechanical Engineering 2025 Paper I
- Q5 (a) A low carbon steel stock of thickness 25 mm is to be rolled in two stages. In the fir…
- Q6 (a) (i) If the power source characteristic in a Metal Inert Arc welding process is V_P =…
- Q7 (a) HSS cutting tool with 9° rake angle, the following data were observed in an orthogona…
- Q8 (a) What are the various computer languages used for NC machines? Explain the merits and…