Paper I — Q8
(a) A 2²-factorial design was used to develop the yield of a crop. Two factors A and B were used at two levels: low (–1) and high…
A 2²-factorial design was used to develop the yield of a crop. Two factors A and B were used at two levels: low (–1) and high (+1). The experiment was replicated two times with completely randomized way. The data obtained are as follows:
| Factor A | Factor B | Estimated Average Effect |
|---|---|---|
| – | – | |
| + | – | 8 |
| – | + | –5 |
| + | + | 2 |
The sum of squares of all the yields = 510.5 The grand total of all the yields = 50.00
Analyze the data and identify the significant factors. 12 marks
Develop the regression model and predict the yield when A and B both are at low level (–1). (8 marks) [Given, F₍₁, ₄, ₀.₀₅₎ = 7.71]
To estimate the population mean Ȳ of a characteristic Y, a simple random sample of size 1000 was selected from a population of size 1000000 by without replacement. The population mean of an auxiliary character X is X̄ = 15. The other results are given below: s²ᵧ = 20, s²ₓ = 25, sₓᵧ = 15, x̄ = 14, ȳ = 10. Estimate Ȳ using difference, ratio and regression estimators. 6 marks
Estimate the MSE of these estimators. Which estimator should we choose to estimate Ȳ? 9 marks
Write down the model used in the analysis of a two-way classification with interactions, stating the assumptions. What are the hypotheses tested in this scenario? Obtain the expression for the sum of squares and complete the ANOVA. 15 marks
हिंदी में प्रश्न पढ़ें
एक फसल की उपज विकसित करने के लिए एक ²-बहु-उपदानी अभिकल्पना का उपयोग किया गया है। दो घटकों A और B का उपयोग दो स्तरों, निम्न (−1) और उच्च (+1), पर किया गया है। प्रयोग को पूर्णतः यादृच्छीकृत तरीके से दो बार पुनरावृत्ति किया गया है। प्राप्त आँकड़े इस प्रकार हैं:
| घटक A | घटक B | आकलित औसत प्रभाव |
|---|---|---|
| − | − | |
| + | − | 8 |
| − | + | −5 |
| + | + | 2 |
सभी उपजों के वर्गों का योग = 510.5 सभी उपजों का कुल योग = 50.00
आँकड़ों का विश्लेषण कीजिए और महत्त्वपूर्ण घटकों की पहचान कीजिए। (12 अंक)
समाश्रयन निदर्श विकसित कीजिए और जब A तथा B दोनों निम्न स्तर (−1) पर हों, तब उपज का पूर्वानुमान कीजिए। (8 अंक) [दिया गया है, F₍₁, ₄, ₀.₀₅₎ = 7.71]
एक अभिलक्षण Y के समष्टि माध्य Ȳ का आकलन करने के लिए, 1000 आमाप का एक सरल यादृच्छिक प्रतिदर्श 1000000 आमाप की समष्टि में से प्रतिस्थापन रहित चुना गया है। सहायक अभिलक्षण X का समष्टि माध्य X̄ = 15 है। अन्य परिणाम नीचे दिये गये हैं: s²ᵧ = 20, s²ₓ = 25, sₓᵧ = 15, x̄ = 14, ȳ = 10। अंतर, अनुपात और समाश्रयण आकलकों का उपयोग करते हुए Ȳ का आकलन कीजिए। (6 अंक)
इन आकलकों की MSE का आकलन कीजिए। Ȳ का आकलन करने के लिए हमें कौन-सा आकलक चुनना चाहिए? (9 अंक)
मान्यताओं का उल्लेख करते हुए अन्योन्यक्रियाओं सहित द्विविधा वर्गीकरण के विश्लेषण में उपयोग किये गये निदर्श को लिखिए। इसके संदर्भ में किन परिकल्पनाओं का परीक्षण किया जाता है? वर्गों के योग का व्यंजक प्राप्त कीजिए और ANOVA को पूर्ण कीजिए। (15 अंक)
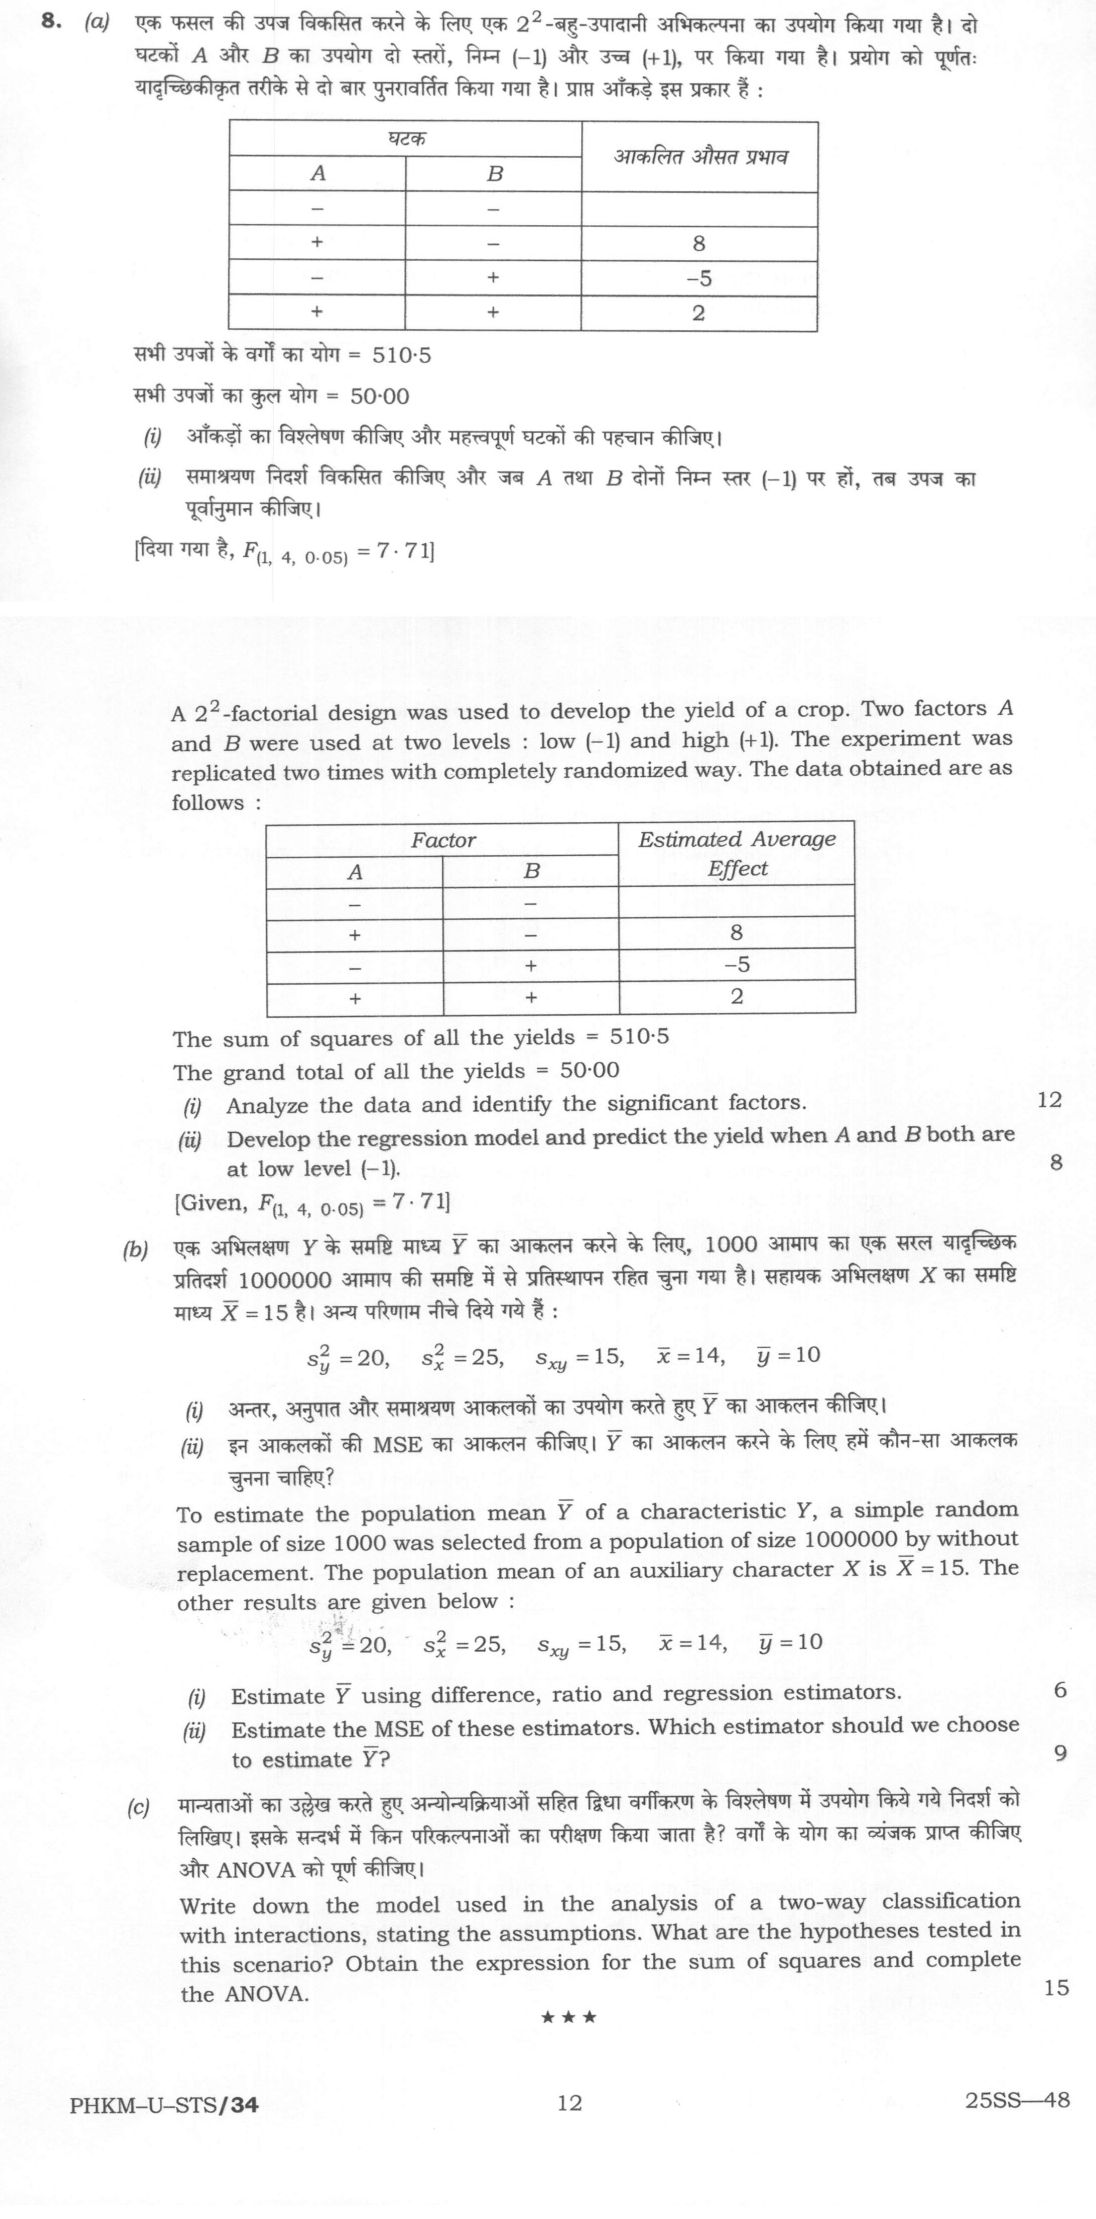
The figure this question refers to, in words
The question paper is a scan and the diagram did not survive as text. This is the figure as read from the original page — every component, value and label — so the question can be worked from the text below.
(a) Table with columns: Factor A, Factor B, Estimated Average Effect. Rows: 1. A: -, B: -, Effect: (blank); 2. A: +, B: -, Effect: 8; 3. A: -, B: +, Effect: -5; 4. A: +, B: +, Effect: 2.
Model answer
Written by UPSC Answer Check against this question's marking rubric, to the expected length. UPSC does not publish answers for Mains — this is one way to score well, not an official key.
(a)(i) The three non-blank entries are the estimated factorial effects A, B and AB; the (–,–) row is the reference. Here r = 2, N = 8, G = 50.00, ∑y² = 510.5. Grand mean = 50/8 = 6.25 yield units. Total SS = ∑y² – G²/N = 510.5 – 50²/8 = 510.5 – 312.5 = 198.0 (yield units)². For a 2² design with r replicates, SS_effect = r(effect)². Thus SS_A = 2(8)² = 128, SS_B = 2(–5)² = 50, SS_AB = 2(2)² = 8. Treatment SS = 186. Error SS = 198.0 – 186 = 12.0. df: A 1, B 1, AB 1, Error 4, Total 7. MS_A = 128, MS_B = 50, MS_AB = 8, MS_E = 12/4 = 3. F_A = 128/3 = 42.67, F_B = 50/3 = 16.67, F_AB = 8/3 = 2.67. With F(1,4,0.05) = 7.71, A and B are significant; AB is not. The F tests require independent normal errors with common variance.
(a)(ii) Use coded factors x_A and x_B, each –1 or +1. The full 2² regression model is ŷ = β₀ + β₁x_A + β₂x_B + β₃x_Ax_B. The intercept is the grand mean, and each slope is one half of the corresponding factorial effect. Hence β₀ = 6.25, β₁ = 8/2 = 4, β₂ = –5/2 = –2.5, β₃ = 2/2 = 1. So ŷ = 6.25 + 4x_A – 2.5x_B + x_Ax_B. At x_A = x_B = –1, x_Ax_B = +1, so ŷ = 6.25 – 4 + 2.5 + 1 = 5.75 yield units. If the non-significant AB term is dropped, the reduced model ŷ = 6.25 + 4x_A – 2.5x_B gives 4.75 yield units. Full-model prediction = 5.75; reduced significant-term prediction = 4.75.
(b)(i) For SRS without replacement, n = 1000, N = 1,000,000, f = 0.001.
- Difference estimator, valid if X and Y are on the same scale: Ȳ_D = ȳ + (X̄ – x̄) = 10 + (15 – 14) = 11 Y units.
- Ratio estimator: Ȳ_R = (ȳ/x̄)X̄ = (10/14)(15) = 75/7 ≈ 10.7143 Y units.
- Regression estimator: b = sₓᵧ/s²ₓ = 15/25 = 0.6 Y units per X unit; Ȳ_reg = ȳ + b(X̄ – x̄) = 10 + 0.6(1) = 10.6 Y units.
(b)(ii) The finite-population correction is (1 – f)/n = 0.999/1000 = 0.000999.
- Difference: MSE_D = 0.000999[s²ᵧ + s²ₓ – 2sₓᵧ] = 0.000999(20 + 25 – 30) = 0.014985 (Y units)².
- Ratio: R̂ = ȳ/x̄ = 5/7. MSE_R ≈ 0.000999[s²ᵧ + R̂²s²ₓ – 2R̂sₓᵧ] = 0.000999[20 + (25/49)(25) – 2(5/7)(15)] = 0.000999(555/49) = 0.011315 (Y units)². This is the usual large-sample approximation; X is positive, so the ratio is valid.
- Regression: MSE_reg = 0.000999[s²ᵧ – (sₓᵧ)²/s²ₓ] = 0.000999(20 – 225/25) = 0.010989 (Y units)². The regression estimator has the smallest estimated MSE, so choose the regression estimator.
(c) The fixed-effects two-way model with interaction is Y_ijk = μ + α_i + β_j + (αβ)_ij + ε_ijk, i = 1,...,a, j = 1,...,b, k = 1,...,n. Assumptions: ε_ijk are independent N(0,σ²); effects are fixed with ∑α_i = 0, ∑β_j = 0, ∑_i(αβ)_ij = 0, ∑_j(αβ)_ij = 0; n ≥ 2. Hypotheses:
- H0: α_i = 0 for all i, against some α_i ≠ 0.
- H0: β_j = 0 for all j, against some β_j ≠ 0.
- H0: (αβ)_ij = 0 for all i,j, against some interaction ≠ 0. Let Y_i.. = ∑_j∑_kY_ijk, Y_.j. = ∑_i∑_kY_ijk, Y_ij. = ∑_kY_ijk, Y_.... = ∑_i∑_j∑_kY_ijk, N = abn, CF = Y_....²/N.
- SS_Total = ∑Y_ijk² – CF.
- SS_A = (1/bn)∑Y_i..² – CF.
- SS_B = (1/an)∑Y_.j.² – CF.
- SS_AB = (1/n)∑∑Y_ij.² – (1/bn)∑Y_i..² – (1/an)∑Y_.j.² + CF.
- SS_Error = ∑Y_ijk² – (1/n)∑∑Y_ij.². ANOVA:
- A: df a–1, MS = SS_A/(a–1), F = MS_A/MS_E.
- B: df b–1, MS = SS_B/(b–1), F = MS_B/MS_E.
- AB: df (a–1)(b–1), MS = SS_AB/[(a–1)(b–1)], F = MS_AB/MS_E.
- Error: df ab(n–1), MS = SS_Error/[ab(n–1)].
- Total: df N–1. Expected mean squares: E(MS_E) = σ²; E(MS_A) = σ² + bn∑α_i²/(a–1); E(MS_B) = σ² + an∑β_j²/(b–1); E(MS_AB) = σ² + n∑∑(αβ)_ij²/[(a–1)(b–1)].
What "Solve" is asking you to do
Choose the method, then carry it through to a final answer. Identifying what kind of problem this is and why that method applies is the first thing marked; a correct figure arrived at invisibly earns almost nothing.
Structure that answers it
Given data and what is required → method chosen, with the reason it applies → set-up (equation, circuit, free body, trial balance) → working, step by step → answer with units and any condition of validity
Where marks are lost
Doing the middle steps mentally and writing only the result. In mathematics papers, a further loss comes from giving a decimal where the exact value in surds or fractions was wanted, or from skipping the justification a part explicitly asks for.
How this answer will be evaluated
Approach
Framework: UPSC Statistics Paper 1. (a(i)) analyse: intro > causes > effects > stakeholders/linkages > way forward | (a(ii)) calculate: given > formula > substitution > result with units > interpretation | (b(i)) calculate: given > formula > substitution > result with units > interpretation | (b(ii)) calculate: given > formula > substitution > result with units > interpretation | (c) describe: define > structure or process in order > labelled diagram > significance Full marks: All calculations correct, clear interpretation, complete ANOVA tables
Key points expected
- Calculate SS for A, B, AB, and Error
- Compute Mean Squares and F-ratios
- Compare F-values with F(1,4,0.05)=7.71
- State which factors are significant
- Derive coefficients from average effects
- Write full regression equation
- Substitute x1=-1, x2=-1 for prediction
- State final predicted yield
Evaluation rubric
Each sub-part is marked on its own, against the marks and word limit printed on the paper.
- (a(i)) ANOVA table for 2^2 design and F-test for significance 12 marks
analyse— intro → causes → effects → stakeholders/linkages → way forward
Must cover
- Calculate SS for A, B, AB, and Error
- Compute Mean Squares and F-ratios
- Compare F-values with F(1,4,0.05)=7.71
- State which factors are significant
Loses marks
- Missing Error SS calculation
- F-test without stated critical value
Earns more
- Correct degrees of freedom (1,1,1,4)
- Explicit null and alternative hypotheses
Extra mark
- Correct calculation of Grand Mean (6.25)
- (a(ii)) Regression model equation and prediction at (-1, -1) 8 marks
calculate— given → formula → substitution → result with units → interpretation
Must cover
- Derive coefficients from average effects
- Write full regression equation
- Substitute x1=-1, x2=-1 for prediction
- State final predicted yield
Loses marks
- Missing regression equation
- Prediction without substitution steps
Earns more
- Correct identification of intercept (Grand Mean)
Extra mark
- Verification of prediction against raw data
- (b(i)) Estimate Y-bar using difference, ratio, and regression 6 marks
calculate— given → formula → substitution → result with units → interpretation
Must cover
- Calculate Difference Estimator (ybar + Xbar - xbar)
- Calculate Ratio Estimator (ybar * Xbar / xbar)
- Calculate Regression Estimator (ybar + b(Xbar - xbar))
- Show all three numerical values
Loses marks
- Missing any one of the three estimators
- Incorrect formula for regression coefficient
Earns more
- Correct calculation of regression coefficient b
Extra mark
- Comparison of the three estimates
- (b(ii)) MSE for each estimator and selection of best one 9 marks
calculate— given → formula → substitution → result with units → interpretation
Must cover
- Calculate MSE for Difference Estimator
- Calculate MSE for Ratio Estimator
- Calculate MSE for Regression Estimator
- Select estimator with minimum MSE
Loses marks
- Missing MSE calculation for any estimator
- Selection without comparing MSE values
Earns more
- Correct application of finite population correction
- Explicit statement of why chosen estimator is best
Extra mark
- Comparison of relative efficiencies
- (c) Two-way ANOVA model, assumptions, hypotheses, and ANOVA table 15 marks
describe— define → structure or process in order → labelled diagram → significance
Must cover
- State linear model with interaction term
- List assumptions (normality, independence, homogeneity)
- State null hypotheses for A, B, and AB
- Provide complete ANOVA table with SS, df, MS, F
Loses marks
- Missing interaction term in model
- Incomplete ANOVA table
Earns more
- Correct expression for Sum of Squares
- Clear distinction between fixed and random effects
Extra mark
- Example of interaction interpretation
Practice this exact question
Write your answer and it is marked point by point against the model answer above — what you covered, what you missed, what you got wrong.
Evaluate my answer →More from Statistics 2024 Paper I
- Q5 (a) How will you justify the usage of the principle of least squares in estimating the pa…
- Q6 (a) (X, Y) has bivariate normal distribution BN(μ₁, μ₂, σ₁², σ₂², ρ). (i) Show that X and…
- Q7 (a) A very big population is divided into two strata. The allocation of units of stratifi…
- Q8 (a) A 2²-factorial design was used to develop the yield of a crop. Two factors A and B we…