Paper II — Q2
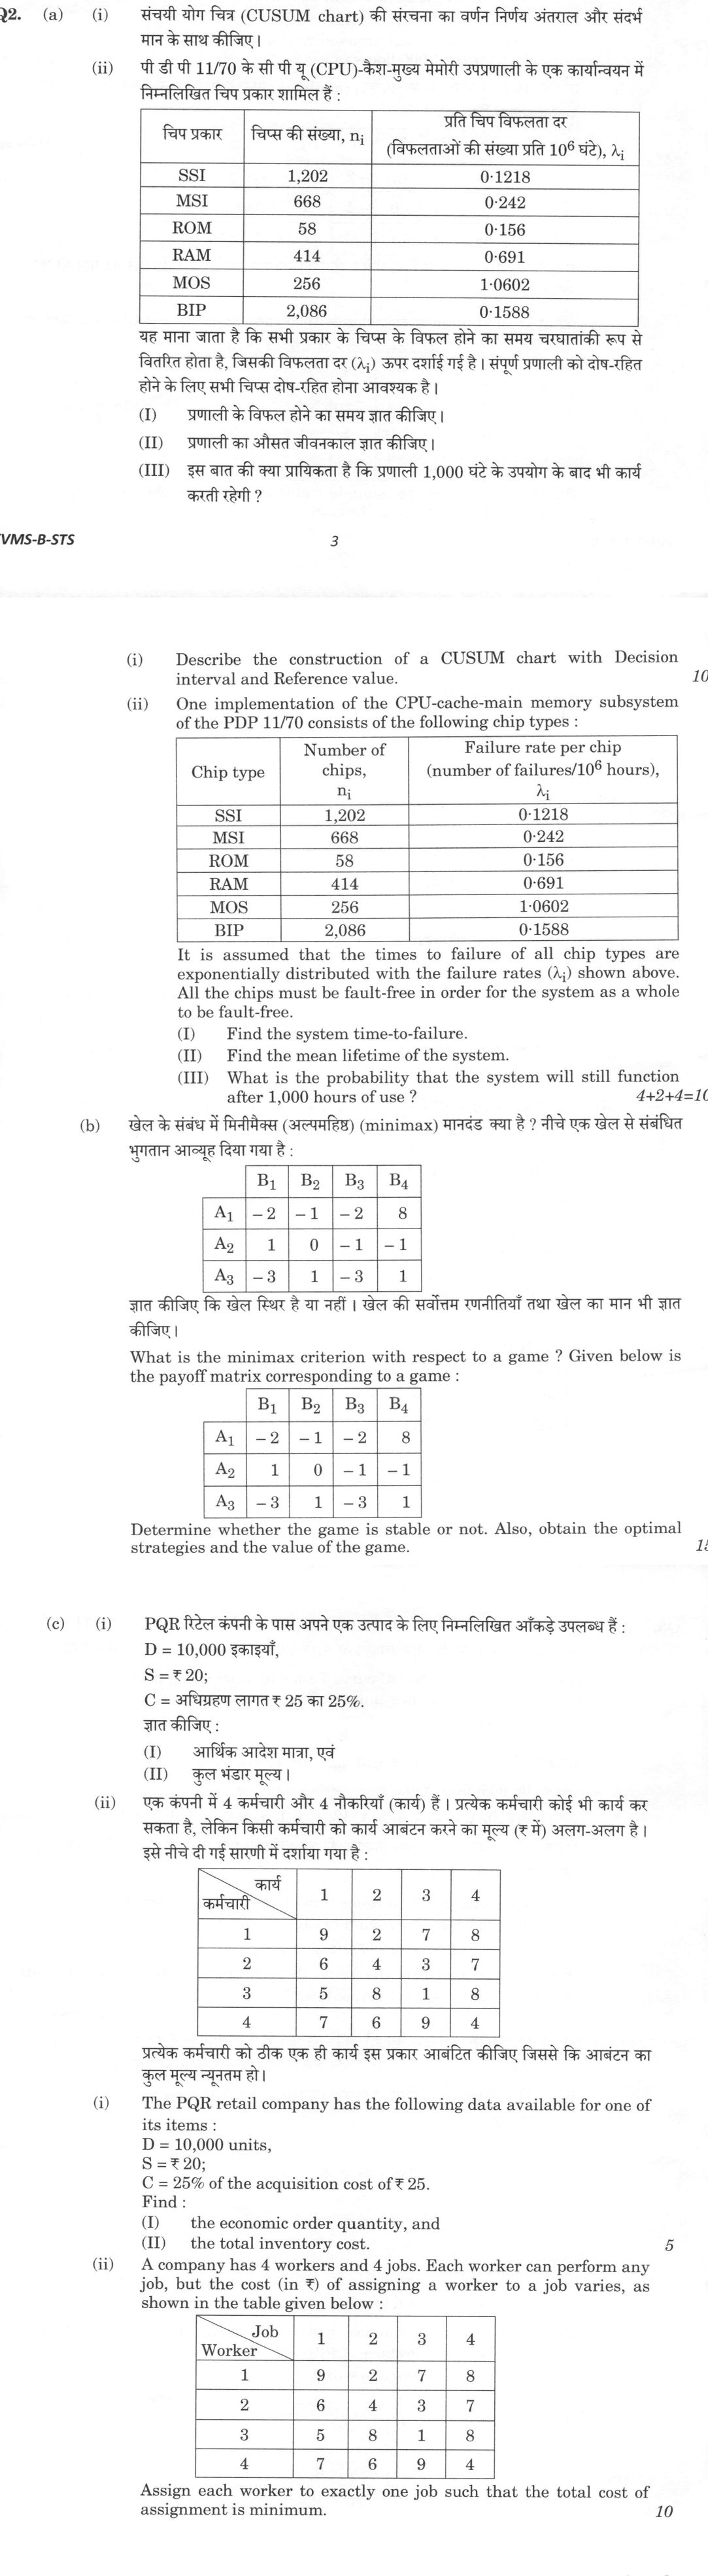
(a) (i) Describe the construction of a CUSUM chart with Decision interval and Reference value. (10 marks) (ii) One…
Describe the construction of a CUSUM chart with Decision interval and Reference value. 10 marks
One implementation of the CPU-cache-main memory subsystem of the PDP 11/70 consists of the following chip types :
Chip type | Number of chips, n_i | Failure rate per chip (number of failures/10^6 hours), λ_i SSI | 1,202 | 0·1218 MSI | 668 | 0·242 ROM | 58 | 0·156 RAM | 414 | 0·691 MOS | 256 | 1·0602 BIP | 2,086 | 0·1588
It is assumed that the times to failure of all chip types are exponentially distributed with the failure rates (λ_i) shown above. All the chips must be fault-free in order for the system as a whole to be fault-free. (I) Find the system time-to-failure. (II) Find the mean lifetime of the system. (III) What is the probability that the system will still function after 1,000 hours of use ? 10 marks
What is the minimax criterion with respect to a game ? Given below is the payoff matrix corresponding to a game :
| B_1 | B_2 | B_3 | B_4 |
|---|
A_1 | −2 | −1 | −2 | 8 A_2 | 1 | 0 | −1 | −1 A_3 | −3 | 1 | −3 | 1
Determine whether the game is stable or not. Also, obtain the optimal strategies and the value of the game. 15 marks
The PQR retail company has the following data available for one of its items : D = 10,000 units, S = ₹ 20; C = 25% of the acquisition cost of ₹ 25. Find : (I) the economic order quantity, and (II) the total inventory cost. 5 marks
A company has 4 workers and 4 jobs. Each worker can perform any job, but the cost (in ₹) of assigning a worker to a job varies, as shown in the table given below :
| Job / Worker | 1 | 2 | 3 | 4 |
|---|---|---|---|---|
| 1 | 9 | 2 | 7 | 8 |
| 2 | 6 | 4 | 3 | 7 |
| 3 | 5 | 8 | 1 | 8 |
| 4 | 7 | 6 | 9 | 4 |
Assign each worker to exactly one job such that the total cost of assignment is minimum. 10 marks
हिंदी में प्रश्न पढ़ें
निर्णय अंतराल तथा संदर्भ मान के साथ एक CUSUM चार्ट की बनावट का वर्णन कीजिए। (10 अंक)
PDP 11/70 के CPU-कैश-मुख्य स्मृति उपतंत्र के एक कार्यान्वयन में निम्नलिखित चिप प्रकार सम्मिलित होते हैं :
चिप प्रकार | चिपों की संख्या, n_i | प्रति चिप विफलता दर (10^6 घंटों में विफलताओं की संख्या), λ_i SSI | 1,202 | 0·1218 MSI | 668 | 0·242 ROM | 58 | 0·156 RAM | 414 | 0·691 MOS | 256 | 1·0602 BIP | 2,086 | 0·1588
यह मान लिया जाता है कि सभी चिप प्रकारों के विफल होने के समय घातांकीय रूप से बंटित हैं जिनकी विफलता दरें (λ_i) ऊपर दर्शाई गई हैं। समग्र तंत्र के दोष-मुक्त होने के लिए सभी चिपों का दोष-मुक्त होना आवश्यक है। (I) तंत्र का विफलता-पर्यंत समय ज्ञात कीजिए। (II) तंत्र का माध्य जीवनकाल ज्ञात कीजिए। (III) 1,000 घंटे के उपयोग के पश्चात् तंत्र के अब भी कार्यरत रहने की प्रायिकता क्या है ? (10 अंक)
खेल के संबंध में मिनिमैक्स (अल्पमहिष्ठ) (minimax) मानदंड क्या है ? नीचे एक खेल से संबंधित भुगतान आव्यूह दिया गया है :
| B_1 | B_2 | B_3 | B_4 |
|---|
A_1 | −2 | −1 | −2 | 8 A_2 | 1 | 0 | −1 | −1 A_3 | −3 | 1 | −3 | 1
ज्ञात कीजिए कि खेल स्थिर है या नहीं। खेल की सर्वोत्तम रणनीतियाँ तथा खेल का मान भी ज्ञात कीजिए। (15 अंक)
PQR रिटेल कंपनी के पास अपने एक उत्पाद के लिए निम्नलिखित आँकड़े उपलब्ध हैं : D = 10,000 इकाइयाँ, S = ₹ 20; C = अधिग्रहण लागत ₹ 25 का 25%. ज्ञात कीजिए : (I) आर्थिक आदेश मात्रा, एवं (II) कुल भंडार लागत। (5 अंक)
एक कंपनी में 4 कर्मचारी और 4 नौकरियाँ (कार्य) हैं । प्रत्येक कर्मचारी कोई भी कार्य कर सकता है, लेकिन किसी कर्मचारी को कार्य आबंटित करने की लागत (₹ में) अलग-अलग है । इसे नीचे दी गई सारणी में दर्शाया गया है :
| कार्य / कर्मचारी | 1 | 2 | 3 | 4 |
|---|---|---|---|---|
| 1 | 9 | 2 | 7 | 8 |
| 2 | 6 | 4 | 3 | 7 |
| 3 | 5 | 8 | 1 | 8 |
| 4 | 7 | 6 | 9 | 4 |
प्रत्येक कर्मचारी को ठीक एक ही कार्य इस प्रकार आबंटित कीजिए जिससे कि आबंटन की कुल लागत न्यूनतम हो। (10 अंक)
Model answer
Drafted with AI by UPSC Answer Check against this question's marking rubric, to the expected length. UPSC does not publish answers for Mains — this is one way to score well, not an official key. How we build rubrics and answers.
(a) (i) Construction of a CUSUM chart
A CUSUM chart accumulates deviations of successive observations (or subgroup means) from the target μ₀, so that a small sustained shift builds up into a clear drift; it uses the whole history, not just the last point.
Design parameters (σ = process standard deviation, δσ = shift to be detected): Reference value (allowance, slack) K = (δ/2)σ, conventionally K = 0.5σ, half-way between μ₀ and the shifted mean μ₁ = μ₀ + δσ. Decision interval H = hσ, conventionally H = 4σ or 5σ.
Tabular CUSUM, starting from C₀⁺ = C₀⁻ = 0: Cᵢ⁺ = max[0, xᵢ − (μ₀ + K) + Cᵢ₋₁⁺] (accumulates upward deviations); Cᵢ⁻ = max[0, (μ₀ − K) − xᵢ + Cᵢ₋₁⁻] (accumulates downward deviations). The max[0, ·] resets a sum to zero whenever the evidence favours μ₀, so only deviations larger than K accumulate.
Both Cᵢ⁺ and Cᵢ⁻ are plotted against i with a horizontal line at H. The process is declared out of control at the first i with Cᵢ⁺ > H (mean increased) or Cᵢ⁻ > H (mean decreased). The count N⁺ of consecutive non-zero Cᵢ⁺ dates the shift, and the new mean is estimated by μ̂ = μ₀ + K + Cᵢ⁺/N⁺. With K = 0.5σ and H = 5σ the in-control ARL is about 465 and a 1σ shift is detected in about 10.4 samples on average (a Shewhart X̄ chart needs about 44). The same scheme can be drawn as a V-mask with H = d tan θ and K = A tan θ. CUSUM is slower than a Shewhart chart for large (3σ) shifts, so the two are often used together.
(a) (ii) Reliability of a series system of chips
All chips must work, so the chips form a series system: R_s(t) = Πᵢ [e^(−λᵢt)]^(nᵢ) = e^(−λ_s t) with λ_s = Σ nᵢλᵢ.
| Chip | nᵢ | λᵢ (per 10⁶ h) | nᵢλᵢ |
|---|---|---|---|
| SSI | 1202 | 0.1218 | 146.40 |
| MSI | 668 | 0.242 | 161.66 |
| ROM | 58 | 0.156 | 9.05 |
| RAM | 414 | 0.691 | 286.07 |
| MOS | 256 | 1.0602 | 271.41 |
| BIP | 2086 | 0.1588 | 331.26 |
| Total | 4684 | 1205.85 |
(I) λ_s = 1205.85 per 10⁶ hours = 1.2058 × 10⁻³ per hour. The system time to failure is exponential with rate λ_s: f(t) = 1.2058 × 10⁻³ e^(−0.0012058t), R_s(t) = e^(−0.0012058t), t ≥ 0.
(II) MTTF = 1/λ_s = 10⁶/1205.85 ≈ 829.3 hours.
(III) R_s(1000) = e^(−1.2058) ≈ 0.299, i.e. about a 30% chance that the system is still working after 1000 hours.
(b) Minimax criterion; stability and value of the game
In a two-person zero-sum game the maximising player A uses the maximin criterion: for each strategy he notes the worst payoff (row minimum) and picks the strategy with the largest of these. The minimising player B uses the minimax criterion: he notes the largest loss in each column (column maximum) and picks the column with the smallest of these. Always maximin ≤ minimax; if they are equal, the game has a saddle point, is stable (strictly determined), and the common value is the value of the game.
| B₁ | B₂ | B₃ | B₄ | Row minimum | |
|---|---|---|---|---|---|
| A₁ | −2 | −1 | −2 | 8 | −2 |
| A₂ | 1 | 0 | −1 | −1 | −1 |
| A₃ | −3 | 1 | −3 | 1 | −3 |
| Column maximum | 1 | 1 | −1 | 8 |
Maximin = max(−2, −1, −3) = −1 (row A₂); minimax = min(1, 1, −1, 8) = −1 (column B₃). Since maximin = minimax = −1, the cell (A₂, B₃) is a saddle point: the game is stable; A's optimal strategy is the pure strategy A₂, B's is the pure strategy B₃, and the value of the game is v = −1 (A loses 1 unit per play).
(c) (i) Economic order quantity and total inventory cost
D = 10,000 units per year, S = ₹20 per order, C = 25% of ₹25 = ₹6.25 per unit per year. (I) **Q* = √(2DS/C) = √(2 × 10,000 × 20/6.25) = √64,000 ≈ 252.98 ≈ 253 units.** (II) Total inventory cost = DS/Q* + CQ*/2 = 790.57 + 790.57 = √(2DSC) = √2,500,000 = ₹1,581.14 per year (₹2,51,581.14 if the purchase cost D × ₹25 = ₹2,50,000 is included).
(c) (ii) Assignment problem (Hungarian method)
Cost matrix (rows 1–4, columns 1–4 as printed): (9, 2, 7, 8), (6, 4, 3, 7), (5, 8, 1, 8), (7, 6, 9, 4).
Row reduction (row minima 2, 3, 1, 4):
| 1 | 2 | 3 | 4 | |
|---|---|---|---|---|
| 1 | 7 | 0 | 5 | 6 |
| 2 | 3 | 1 | 0 | 4 |
| 3 | 4 | 7 | 0 | 7 |
| 4 | 3 | 2 | 5 | 0 |
Column reduction (column minima 3, 0, 0, 0):
| 1 | 2 | 3 | 4 | |
|---|---|---|---|---|
| 1 | 4 | 0 | 5 | 6 |
| 2 | 0 | 1 | 0 | 4 |
| 3 | 1 | 7 | 0 | 7 |
| 4 | 0 | 2 | 5 | 0 |
The zeros need 4 covering lines (rows 2 and 4, columns 2 and 3), equal to the order of the matrix, so an optimal assignment exists among the zeros. Row 1 has a single zero (column 2); row 3 a single zero (column 3); then row 2 takes column 1 and row 4 column 4.
Optimal assignment: Worker 1 → Job 2 (₹2), Worker 2 → Job 1 (₹6), Worker 3 → Job 3 (₹1), Worker 4 → Job 4 (₹4); minimum total cost = ₹13. The assignment pairs 1↔2, 3↔3, 4↔4 are symmetric, so the answer is the same whether the table's rows are read as workers or as jobs; the next best assignment costs ₹14.
How this answer will be evaluated
Evaluation rubric
Each sub-part is marked on its own, against the marks and word limit printed on the paper.
- (a)(i) Describe how a CUSUM control chart is constructed, specifically in its tabular (algorithmic) form, explaining and using the two design parameters named in the question: the reference value (allowance) K and the decision interval H. 10 marks
Must cover
- Reference value / allowance / slack K = (delta/2) sigma = 0.5 sigma
- Decision interval H = h sigma, h = 4 or 5 (H = 5 sigma)
- C_i^+ = max[0, x_i - (mu_0 + K) + C_{i-1}^+]
- C_i^- = max[0, (mu_0 - K) - x_i + C_{i-1}^-]
- ARL_0 about 465 and ARL_1 about 10.4 for k = 0.5, h = 5
- V-mask: lead distance d, half-angle theta, H = d tan(theta)
Loses marks
- Omitting the max[0, .] reset, so the CUSUMs are allowed to go negative - this destroys the one-sided decision rule and is the commonest error
- Confusing K with H, or calling H the 'reference value' and K the 'decision interval' - the question names both, so the labels must be right
- Giving only the V-mask and never stating the tabular form, or vice versa, when the question's wording ('Decision interval and Reference value') points squarely at the tabular scheme
- Stating K = delta sigma instead of (delta/2) sigma
- Claiming CUSUM is uniformly better than Shewhart - it is slower for large (3-sigma and above) shifts
Earns more
- Defines the cumulative sum C_i = sum (x_bar_j - mu_0) and explains that CUSUM uses the whole history, making it far more sensitive than a Shewhart chart to small persistent shifts
- Adds either the post-signal estimate mu-hat = mu_0 + K + C^+/N^+ or the equivalent V-mask construction with H = d tan(theta), K = A tan(theta)
- (a)(ii) A series-system reliability numerical (sub-marks 4 + 2 + 4 printed on the paper). All 6 chip types with the tabulated counts n_i and failure rates lambda_i must be fault-free, and all times to failure are exponential. Find (I) the system time-to-failure distribution (i.e. the system failure rate and reliability function R(t)), (II) the mean lifetime (MTTF), and (III) R(1000). 10 marks
Must cover
- Series system: R_s(t) = product of component reliabilities
- lambda_s = sum n_i lambda_i = 1205.8496 per 10^6 hours
- lambda_s = 1.2058 x 10^-3 per hour
- System time-to-failure is exponential, R_s(t) = e^{-lambda_s t}
- MTTF = 829 hours
- R(1000) = 0.299 (about 29.9 per cent)
Loses marks
- Forgetting to multiply each lambda_i by the number of chips n_i - simply adding the six lambda_i values gives 2.4298 per 10^6 h and a wildly wrong MTTF of about 411,500 hours
- Treating the system as parallel/redundant (taking 1 - product of unreliabilities) when the question explicitly says ALL chips must be fault-free
- Unit errors: leaving lambda_s in 'per 10^6 hours' and reporting MTTF as 1/1205.85 = 0.00083 hours instead of 10^6/1205.85 = 829 hours
- Computing R(1000) as 1 - exp(-1.2058) = 0.701 - that is the failure probability, not the reliability
- Answering (I) with a number (e.g. quoting the MTTF) rather than identifying the distribution of the system time to failure
Earns more
- Identifies a SERIES system and states R_s(t) = product [exp(-lambda_i t)]^{n_i} = exp(-(sum n_i lambda_i) t), so the system life is exponential with lambda_s = sum n_i lambda_i
- (I) States the system time-to-failure distribution: exponential with pdf f(t) = lambda_s e^{-lambda_s t}, R_s(t) = e^{-0.0012058 t}
- (b) Three things are asked: (i) explain the minimax (and maximin) criterion in the theory of games; (ii) test the given 3 x 4 payoff matrix for stability, i.e. for the existence of a saddle point; and (iii) obtain the optimal (pure) strategies of both players and the value of the game. 15 marks
Must cover
- Two-person zero-sum game, maximin and minimax criteria
- Row minima: -2, -1, -3; maximin = -1
- Column maxima: 1, 1, -1, 8; minimax = -1
- Saddle point at (A2, B3)
- Game is stable / strictly determined
- Optimal strategies A2 and B3; value of the game v = -1
Loses marks
- Taking row MAXIMA and column MINIMA (the criteria reversed), which produces a spurious 'saddle point' at the payoff 8
- Sign errors with the negative entries - e.g. treating -3 as larger than -1 when finding maximin
- Declaring the game unstable and launching into dominance reduction and mixed-strategy algebra: since maximin = minimax = -1 there IS a saddle point, so all that work is wasted and the answer is wrong
- Stating the value as +1 or as 1 without sign, or forgetting to say the value is the payoff TO A
- Answering only the numerical part and never defining the minimax criterion, which is explicitly asked and carries substantial marks
Earns more
- Explains minimax/maximin: A chooses max_i min_j a_ij, B chooses min_j max_i a_ij; maximin <= minimax always, and equality means a saddle point / stable game
- States the optimal strategies A2 for A and B3 for B, and the value of the game v = -1
- (c)(i) A basic deterministic EOQ numerical. With annual demand D = 10,000 units, ordering cost S = Rs 20 per order and holding cost C = 25 per cent of the Rs 25 acquisition cost, find (I) the economic order quantity and (II) the total inventory cost. Both sub-parts must be answered. 5 marks
Must cover
- EOQ formula Q* = sqrt(2DS/C)
- C = 0.25 x 25 = Rs 6.25 per unit per year
- Q* = 252.98 ~ 253 units
- Total inventory cost = sqrt(2DSC) = Rs 1581.14
- At optimum ordering cost = carrying cost = Rs 790.57
Loses marks
- Using C = 25 (the acquisition cost) or C = 0.25 instead of the correct Rs 6.25 per unit per year - this is the trap the question is set to catch
- Reporting the total cost including purchase (Rs 2,51,581) without saying so, when the question asks for the total INVENTORY cost
- Forgetting the factor 2 in the numerator or dividing by 2 instead of multiplying, giving Q* = 126.5 or 358
- Omitting units (units, rupees per year) from the final answers
- Rounding Q* to 250 or 260 without noting the rounding, then computing a total cost that no longer equals sqrt(2DSC)
Earns more
- States and applies EOQ = sqrt(2DS/C)
- Notes that at the EOQ the ordering cost equals the carrying cost (Rs 790.57 each), or gives the number of orders D/Q* = 39.5 per year
- (c)(ii) A 4 x 4 minimisation assignment problem. Using the Hungarian (Kuhn-Munkres) method, assign each of the 4 workers to exactly one of the 4 jobs so that total cost is minimum, and state the optimal assignment together with its total cost. 10 marks
Must cover
- Hungarian (Kuhn-Munkres) assignment method
- Row reduction by row minima 2, 3, 1, 4
- Column reduction of column 1 by 3
- Minimum number of covering lines = order of matrix (4) is the optimality test
- Optimal assignment 1-2, 2-1, 3-3, 4-4
- Minimum total cost = Rs 13
Loses marks
- Reading costs from the wrong cells (e.g. mixing rows and columns within the same assignment) — note the optimal pairing 1↔2, 3↔3, 4↔4 is symmetric, so reading rows as jobs or as workers gives the same answer and must not be penalised
- Stopping after row and column reduction and picking zeros greedily without checking that the minimum number of covering lines equals 4
- Choosing the assignment W1-J2, W2-J3, W3-J1, W4-J4 (cost Rs 14) because W2-J3 and W3-J1 also sit on zeros - a careless zero-selection order gives a sub-optimal answer
- Forgetting to convert the reduced-matrix assignment back to ORIGINAL costs when computing the total
- Treating the problem as a transportation problem and using VAM/MODI, which is inefficient and usually produces a degenerate, wrong answer here
Earns more
- Performs row reduction correctly by subtracting the row minima 2, 3, 1, 4
- Performs column reduction (only column 1 needs reduction, by 3) and obtains W1 (4, 0, 5, 6); W2 (0, 1, 0, 4); W3 (1, 7, 0, 7); W4 (0, 2, 5, 0)
What "Describe" is asking you to do
Give a full, ordered account of the thing named — its parts, stages or mechanism — in the sequence in which it actually exists or occurs. Most describe questions come from the science optionals, where the marks sit in correct technical detail and, where the stem says so, a labelled diagram.
Structure that answers it
One-line identification of the subject → the parts or stages in their real order, each with its defining detail → labelled diagram where the subject is structural → closing line on function or significance
Where marks are lost
Loose general prose where the examiner is ticking named parts, correct terminology and their sequence; and in the General Studies papers, turning to evaluation before the description is finished.
Practice this exact question
Write your answer and it is marked point by point against the model answer above — what you covered, what you missed, what you got wrong.
Evaluate my answer →More from Statistics 2026 Paper II
- Q1 (a) Suppose that a given individual in a population has a survival time which is exponent…
- Q2 (a) (i) Describe the construction of a CUSUM chart with Decision interval and Reference v…
- Q3 (a) How will you draw the OC curve for a single sampling plan with sample size 5, if the…
- Q4 (a) (i) Discuss the theoretical basis of the sequential probability ratio test (SPRT) in…
- Q5 (a) Explain the 2-stage least squares (2SLS) method of estimation for the following simul…