Paper II — Q5
(a) Explain the 2-stage least squares (2SLS) method of estimation for the following simultaneous equation systems : C_t = α +…
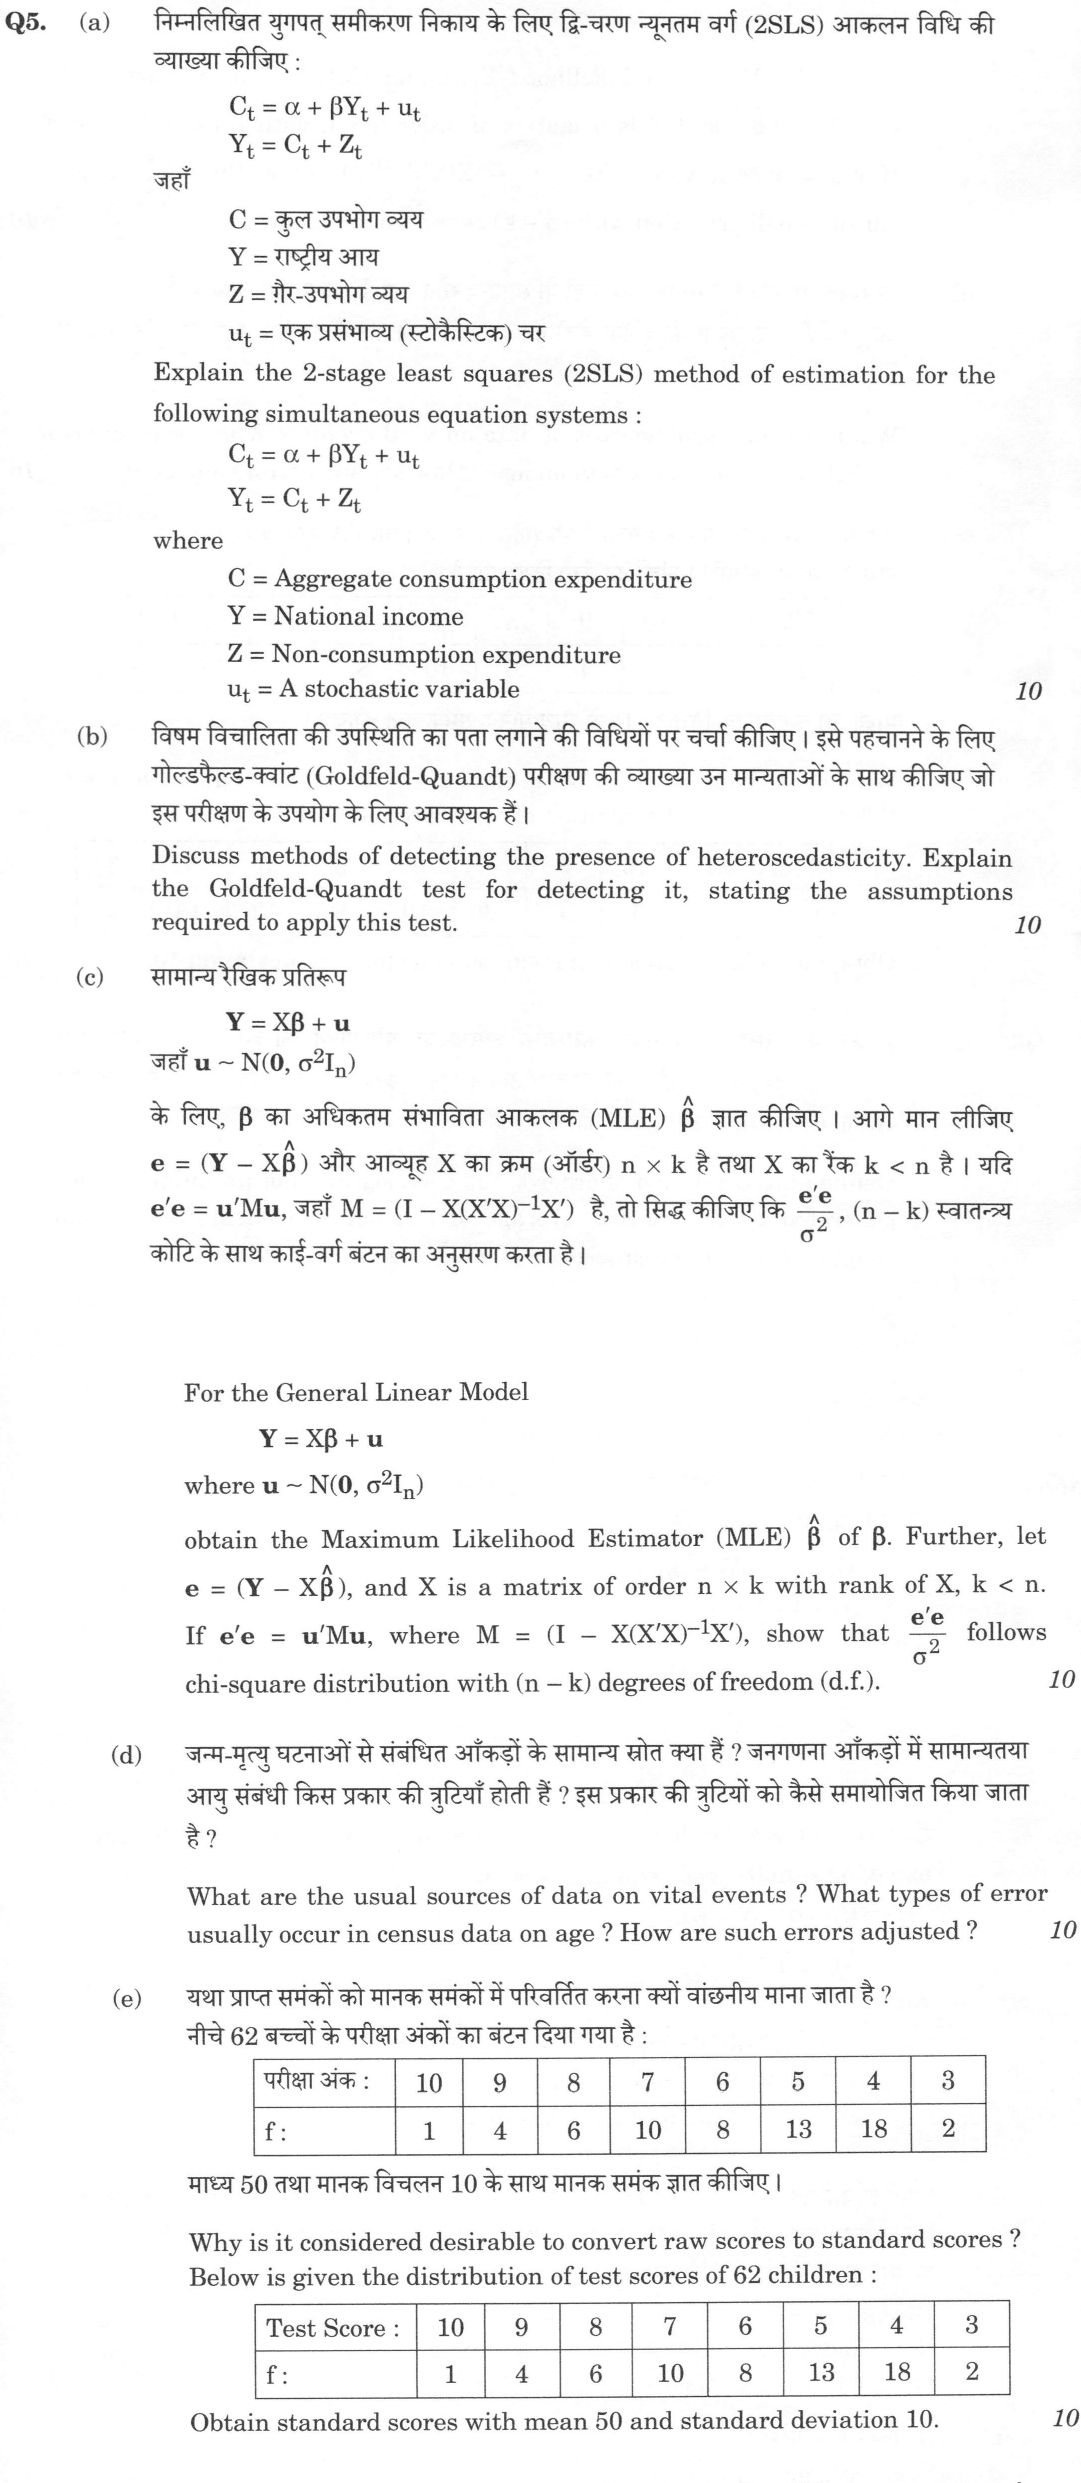
Explain the 2-stage least squares (2SLS) method of estimation for the following simultaneous equation systems : C_t = α + βY_t + u_t Y_t = C_t + Z_t where C = Aggregate consumption expenditure Y = National income Z = Non-consumption expenditure u_t = A stochastic variable 10 marks
Discuss methods of detecting the presence of heteroscedasticity. Explain the Goldfeld-Quandt test for detecting it, stating the assumptions required to apply this test. 10 marks
Normal linear model Y = Xβ + u where u ~ N(0, σ²I_n) find the maximum likelihood estimator (MLE) β̂ of β. Further, let e = (Y − Xβ̂) and the order of matrix X be n × k, and the rank of X be k < n. If e'e = u'Mu, where M = (I − X(X'X)⁻¹X'), then prove that e'e/σ² follows a chi-square distribution with (n − k) degrees of freedom. For the General Linear Model Y = Xβ + u where u ~ N(0, σ²Iₙ) obtain the Maximum Likelihood Estimator (MLE) β̂ of β. Further, let e = (Y − Xβ̂), and X is a matrix of order n × k with rank of X, k < n. If e'e = u'Mu, where M = (I − X(X'X)⁻¹X'), show that e'e/σ² follows chi-square distribution with (n − k) degrees of freedom (d.f.). 10 marks
What are the usual sources of data on vital events ? What types of error usually occur in census data on age ? How are such errors adjusted ? 10 marks
Why is it considered desirable to convert raw scores to standard scores ? Below is given the distribution of test scores of 62 children : Test Score : 10 9 8 7 6 5 4 3 f : 1 4 6 10 8 13 18 2 Obtain standard scores with mean 50 and standard deviation 10. 10 marks
हिंदी में प्रश्न पढ़ें
निम्नलिखित युगपत् समीकरण निकाय के लिए द्वि-चरण न्यूनतम वर्ग (2SLS) आकलन विधि की व्याख्या कीजिए : C_t = α + βY_t + u_t Y_t = C_t + Z_t जहाँ C = कुल उपभोग व्यय Y = राष्ट्रीय आय Z = गैर-उपभोग व्यय u_t = एक प्रसंभाव्य (स्टोकैस्टिक) चर (10 अंक)
विषम विचलिता की उपस्थिति का पता लगाने की विधियों पर चर्चा कीजिए। इसे पहचानने के लिए गोल्डफेल्ड-क्वांट (Goldfeld-Quandt) परीक्षण की व्याख्या उन मान्यताओं के साथ कीजिए जो इस परीक्षण के उपयोग के लिए आवश्यक हैं। (10 अंक)
सामान्य रैखिक प्रतिरूप Y = Xβ + u जहाँ u ~ N(0, σ²I_n) के लिए, β का अधिकतम संभाविता आकलक (MLE) β̂ ज्ञात कीजिए। आगे मान लीजिए e = (Y − Xβ̂) और आव्यूह X का क्रम (ऑर्डर) n × k है तथा X का रैंक k < n है। यदि e'e = u'Mu, जहाँ M = (I − X(X'X)⁻¹X') है, तो सिद्ध कीजिए कि e'e/σ², (n − k) स्वातंत्र्य कोटि के साथ काई-वर्ग बंटन का अनुसरण करता है। For the General Linear Model Y = Xβ + u where u ~ N(0, σ²Iₙ) obtain the Maximum Likelihood Estimator (MLE) β̂ of β. Further, let e = (Y − Xβ̂), and X is a matrix of order n × k with rank of X, k < n. If e'e = u'Mu, where M = (I − X(X'X)⁻¹X'), show that e'e/σ² follows chi-square distribution with (n − k) degrees of freedom (d.f.). (10 अंक)
जन्म-मृत्यु घटनाओं से संबंधित आँकड़ों के सामान्य स्रोत क्या हैं ? जनगणना आँकड़ों में सामान्यतया आयु संबंधी किस प्रकार की त्रुटियाँ होती हैं ? इस प्रकार की त्रुटियों को कैसे समायोजित किया जाता है ? (10 अंक)
यथा प्राप्त समंकों को मानक समंकों में परिवर्तित करना क्यों वांछनीय माना जाता है ? नीचे 62 बच्चों के परीक्षा अंकों का बंटन दिया गया है : परीक्षा अंक : 10 9 8 7 6 5 4 3 f : 1 4 6 10 8 13 18 2 माध्य 50 तथा मानक विचलन 10 के साथ मानक समंक ज्ञात कीजिए । (10 अंक)
Model answer
Drafted with AI by UPSC Answer Check against this question's marking rubric, to the expected length. UPSC does not publish answers for Mains — this is one way to score well, not an official key. How we build rubrics and answers.
(a) Two-stage least squares for the Keynesian system (10 marks)
Here C and Y are endogenous and Z is predetermined; the second equation is an identity, so only the consumption function needs estimation. Substituting the identity gives the reduced form Y = α/(1 − β) + Z/(1 − β) + u/(1 − β). Hence Cov(Y, u) = σᵤ²/(1 − β) ≠ 0, and OLS on C = α + βY + u is inconsistent: plim β̂_OLS = β + (1 − β)σᵤ²/(σ_Z² + σᵤ²), an upward bias for 0 < β < 1.
The equation is identified: one exogenous variable (Z) is excluded and one endogenous variable (Y) appears on the right, so the order condition holds with equality (exact identification), and the rank condition holds since Z appears in the identity with a non-zero coefficient.
Stage 1: regress the endogenous regressor on all predetermined variables, Yₜ = π₀ + π₁Zₜ + vₜ, and obtain the fitted Ŷₜ = π̂₀ + π̂₁Zₜ, which is uncorrelated with u. Stage 2: regress Cₜ on Ŷₜ, which gives
β̂_2SLS = Σ(Ŷ − Ȳ)(C − C̄)/Σ(Ŷ − Ȳ)² = Σ(Z − Z̄)(C − C̄)/Σ(Z − Z̄)(Y − Ȳ), and α̂ = C̄ − β̂Ȳ.
The second form shows that 2SLS equals the instrumental-variable and indirect least squares estimators using Z as the instrument. The estimator is consistent but biased in small samples; the standard errors from the second-stage regression must be corrected by using residuals C − α̂ − β̂Y (actual Y), not those with Ŷ.
(b) Detecting heteroscedasticity and the Goldfeld-Quandt test (10 marks)
Heteroscedasticity means Var(uᵢ) = σᵢ² is not constant; OLS remains unbiased but is inefficient and its usual standard errors are wrong. Methods of detection:
- Informal: plot squared residuals against fitted values or against a suspected variable X; a systematic pattern (fan shape) indicates the problem.
- Park test: regress ln û² on ln X; a significant slope indicates heteroscedasticity.
- Glejser test: regress |û| on X^h (h = 1, ½, -1, -½); a significant slope indicates it.
- Spearman rank-correlation test between |û| and X, with t = r√(n − 2)/√(1 − r²).
- Goldfeld-Quandt, Breusch-Pagan-Godfrey (an LM test from the regression of û²/σ̃² on suspected variables) and White's general test (regress û² on regressors, their squares and cross-products; nR² ~ χ²).
Goldfeld-Quandt test: assume (1) normally distributed errors, (2) no autocorrelation, (3) a correctly specified model, and (4) that the error variance is positively related to one explanatory variable, σᵢ² = σ²Xᵢ². Procedure: order the observations by X; omit c central observations (about one-quarter to one-third of n, for example c = 8 when n = 30); run separate OLS regressions on the first and last (n − c)/2 observations; compute F = (RSS₂/df)/(RSS₁/df), with df = (n − c − 2k)/2 in each. Under homoscedasticity F follows the F distribution with (n − c − 2k)/2 and (n − c − 2k)/2 degrees of freedom; if F exceeds the critical value, reject homoscedasticity.
(c) MLE of β and the distribution of e′e/σ² (10 marks)
With u ~ N(0, σ²Iₙ), Y ~ N(Xβ, σ²Iₙ) and the log-likelihood is L = −(n/2)ln(2π) − (n/2)ln σ² − (Y − Xβ)′(Y − Xβ)/2σ². Setting ∂L/∂β = X′(Y − Xβ)/σ² = 0 gives the normal equations X′Xβ = X′Y, so β̂ = (X′X)⁻¹X′Y (rank of X is k, so X′X is invertible), and ∂L/∂σ² = 0 gives σ̂² = e′e/n.
Distribution: e = Y − Xβ̂ = (I − X(X′X)⁻¹X′)Y = MY = M(Xβ + u) = Mu, since MX = 0. Then e′e = u′M′Mu = u′Mu, because M is symmetric and idempotent (M² = M). Being idempotent, M has eigenvalues 0 or 1 only, and its rank equals its trace: tr M = tr Iₙ − tr[X(X′X)⁻¹X′] = n − tr[(X′X)⁻¹X′X] = n − k. So an orthogonal matrix P exists with P′MP = diag(Iₙ₋ₖ, 0). Let w = P′u/σ ~ N(0, Iₙ), since P is orthogonal. Then
e′e/σ² = u′Mu/σ² = w′P′MPw = w₁² + w₂² + … + w²ₙ₋ₖ,
a sum of n − k squares of independent standard normals, so e′e/σ² ~ χ² with (n − k) degrees of freedom.
(d) Vital events data, age errors and adjustment (10 marks)
Sources of vital-events data: the civil registration system (births and deaths registered under the Registration of Births and Deaths Act, 1969), the Sample Registration System (dual-record survey by the Registrar General), population censuses and their retrospective questions, national surveys (NFHS, NSS) and hospital or institutional records.
Errors in census age data: age heaping or digit preference (rounding to ages ending in 0 and 5, and preference for even numbers), age misstatement, with exaggeration of age by the elderly and understatement by young women, under-enumeration of children under five and of infants, and differential coverage by sex and age, giving irregular age-sex distributions.
Detection and adjustment: heaping is measured by Whipple's index (100 means no heaping, above about 175 indicates rough data) and Myers' blended index; the age-sex accuracy is judged by the United Nations Joint Score based on age and sex ratios. Errors are reduced by grouping into five- or ten-year intervals, which cancels heaping; by smoothing with Carrier-Farag, Karup-King, Sprague or Beers interpolation formulae; by applying stable- or quasi-stable-population methods; and by using post-enumeration surveys and reconciliation with registration data for children.
(e) Standard scores (10 marks)
Raw scores have no meaning by themselves: they depend on the difficulty and scale of the test. Converting to standard scores expresses each score as a distance from the mean in standard-deviation units, which (i) makes scores from different tests comparable, (ii) shows a person's relative position in the group, (iii) allows scores to be added or averaged across tests, and (iv) gives a standard scale (here mean 50 and SD 10, the T-score scale) that avoids negative values and decimals.
Computation. n = Σf = 62; Σfx = 10 + 36 + 48 + 70 + 48 + 65 + 72 + 6 = 355, so mean = 355/62 = 5.726. Σf(x − mean)² = 184.34, so σ = √(184.34/62) = √2.973 = 1.724. Standard score T = 50 + 10(x − 5.726)/1.724 = 50 + 5.80(x − 5.726):
- x = 10: 74.8; x = 9: 69.0; x = 8: 63.2; x = 7: 57.4
- x = 6: 51.6; x = 5: 45.8; x = 4: 40.0; x = 3: 34.2
The scores have mean 50 and SD 10, as required (with n − 1 as divisor the results differ only in the second decimal).
How this answer will be evaluated
Evaluation rubric
Each sub-part is marked on its own, against the marks and word limit printed on the paper.
- (a) Explain 2SLS estimation for C = α + βY + u, Y = C + Z (10). 10 marks
Must cover
- Classify variables (C, Y endogenous; Z exogenous; identity) and show Y is correlated with u, so OLS is inconsistent (Cov(Y,u) = σᵤ²/(1−β))
- Identification: exactly identified by order and rank conditions
- Stage 1: regress Y on Z; Stage 2: regress C on Ŷ
- Result: β̂ = Σ(Z−Z̄)(C−C̄)/Σ(Z−Z̄)(Y−Ȳ), equal to IV and ILS; consistent but biased in small samples
Loses marks
- Regressing C on Y directly and calling it 2SLS.
- Estimating the identity.
- Stage 1 regressing on the wrong variables.
Earns more
- Reduced form derived correctly.
- Standard-error correction using actual Y.
Extra mark
- plim of OLS bias stated
- (b) Discuss methods of detecting heteroscedasticity; explain the Goldfeld-Quandt test with its assumptions (10). 10 marks
Must cover
- At least four detection methods named with how each works (graphical, Park, Glejser, Spearman, BPG, White)
- GQ procedure: order by X, omit c central observations, two OLS fits, F = RSS₂/RSS₁
- GQ df = (n−c−2k)/2 each; reject when F exceeds critical value
- GQ assumptions: normality, no autocorrelation, correct specification, variance related to one variable
Loses marks
- Confusing GQ with Durbin-Watson.
- Not ordering data by the suspected variable.
- Missing the assumptions.
Earns more
- Correct typical c (about a quarter to a third of n).
- Statement of consequences of heteroscedasticity for OLS.
Extra mark
- Remedies (WLS or robust standard errors)
- (c) Find the MLE of β and show e′e/σ² ~ χ²(n−k) (10). 10 marks
Must cover
- Likelihood and normal equations giving β̂ = (X′X)⁻¹X′Y (and σ̂² = e′e/n)
- e = Mu since MX = 0; e′e = u′Mu with M symmetric idempotent
- rank M = tr M = n − k
- Orthogonal diagonalisation to a sum of n−k squared independent N(0,1), so χ²(n−k)
Loses marks
- Assuming the result without proof.
- Using rank k in place of n−k.
- Failing to use idempotency of M.
Earns more
- Each algebraic step shown, including tr M calculation.
- Statement that the ML variance divides by n, not n−k.
Extra mark
- Independence of β̂ and e′e
- (d) What are the usual sources of vital-events data; what age errors occur in census data; how are they adjusted (10). 10 marks
Must cover
- Sources: civil registration, SRS, census, surveys, hospital records
- Errors: age heaping, misstatement, under-enumeration of children, differential coverage
- Detection: Whipple's and Myers' indices, UN Joint Score
- Adjustment: grouping, smoothing formulae (Carrier-Farag, Karup-King, Sprague, Beers), stable-population and PES methods
Loses marks
- Listing errors without any adjustments.
- Confusing content and coverage errors.
- Wrong statement of what Whipple's index measures.
Earns more
- Indian sources named (CRS Act 1969, SRS).
- Interpretation of the Whipple index values.
Extra mark
- Age-ratio scores
- (e) Why convert raw scores to standard scores; obtain standard scores with mean 50 and SD 10 for the given distribution (10). 10 marks
Must cover
- At least two reasons (comparability, relative position, additivity, common scale)
- n = 62, mean 5.726 and σ = 1.724 correctly computed
- T = 50 + 10(x − 5.726)/1.724
- All eight standard scores: 74.8, 69.0, 63.2, 57.4, 51.6, 45.8, 40.0, 34.2
Loses marks
- Forgetting the frequencies in the mean and SD.
- Reporting z-scores instead of T-scores.
- Arithmetic errors carried through all eight values.
Earns more
- Mean and SD of the transformed scores verified.
- Using n as divisor stated (or n−1 with small difference).
Extra mark
- Percentile interpretation
What "Explain" is asking you to do
Make the working of something clear — what sets it off, what follows from what, and what it produces. Explain is the Commission's mechanism word: it dominates the technical papers and the “explain why” stems, where the marks sit in the causal chain and not in the label.
Structure that answers it
State what it is → the initiating condition → the chain of cause, step by step → an instance where it plays out → what the chain produces
Where marks are lost
Describing what something looks like instead of why it works that way. Naming the stages without linking them reads as description too.
Practice this exact question
Write your answer and it is marked point by point against the model answer above — what you covered, what you missed, what you got wrong.
Evaluate my answer →More from Statistics 2026 Paper II
- Q2 (a) (i) Describe the construction of a CUSUM chart with Decision interval and Reference v…
- Q3 (a) How will you draw the OC curve for a single sampling plan with sample size 5, if the…
- Q4 (a) (i) Discuss the theoretical basis of the sequential probability ratio test (SPRT) in…
- Q5 (a) Explain the 2-stage least squares (2SLS) method of estimation for the following simul…
- Q6 (a) Define autocorrelation of order k and correlogram. For an infinite series generated b…
- Q7 (a) (i) Define a life table and mention its uses. (5 marks) (ii) The number of persons dy…
- Q8 (a) Consider the following structural equation model assuming Y's as endogenous and X's a…