Paper II — Q7
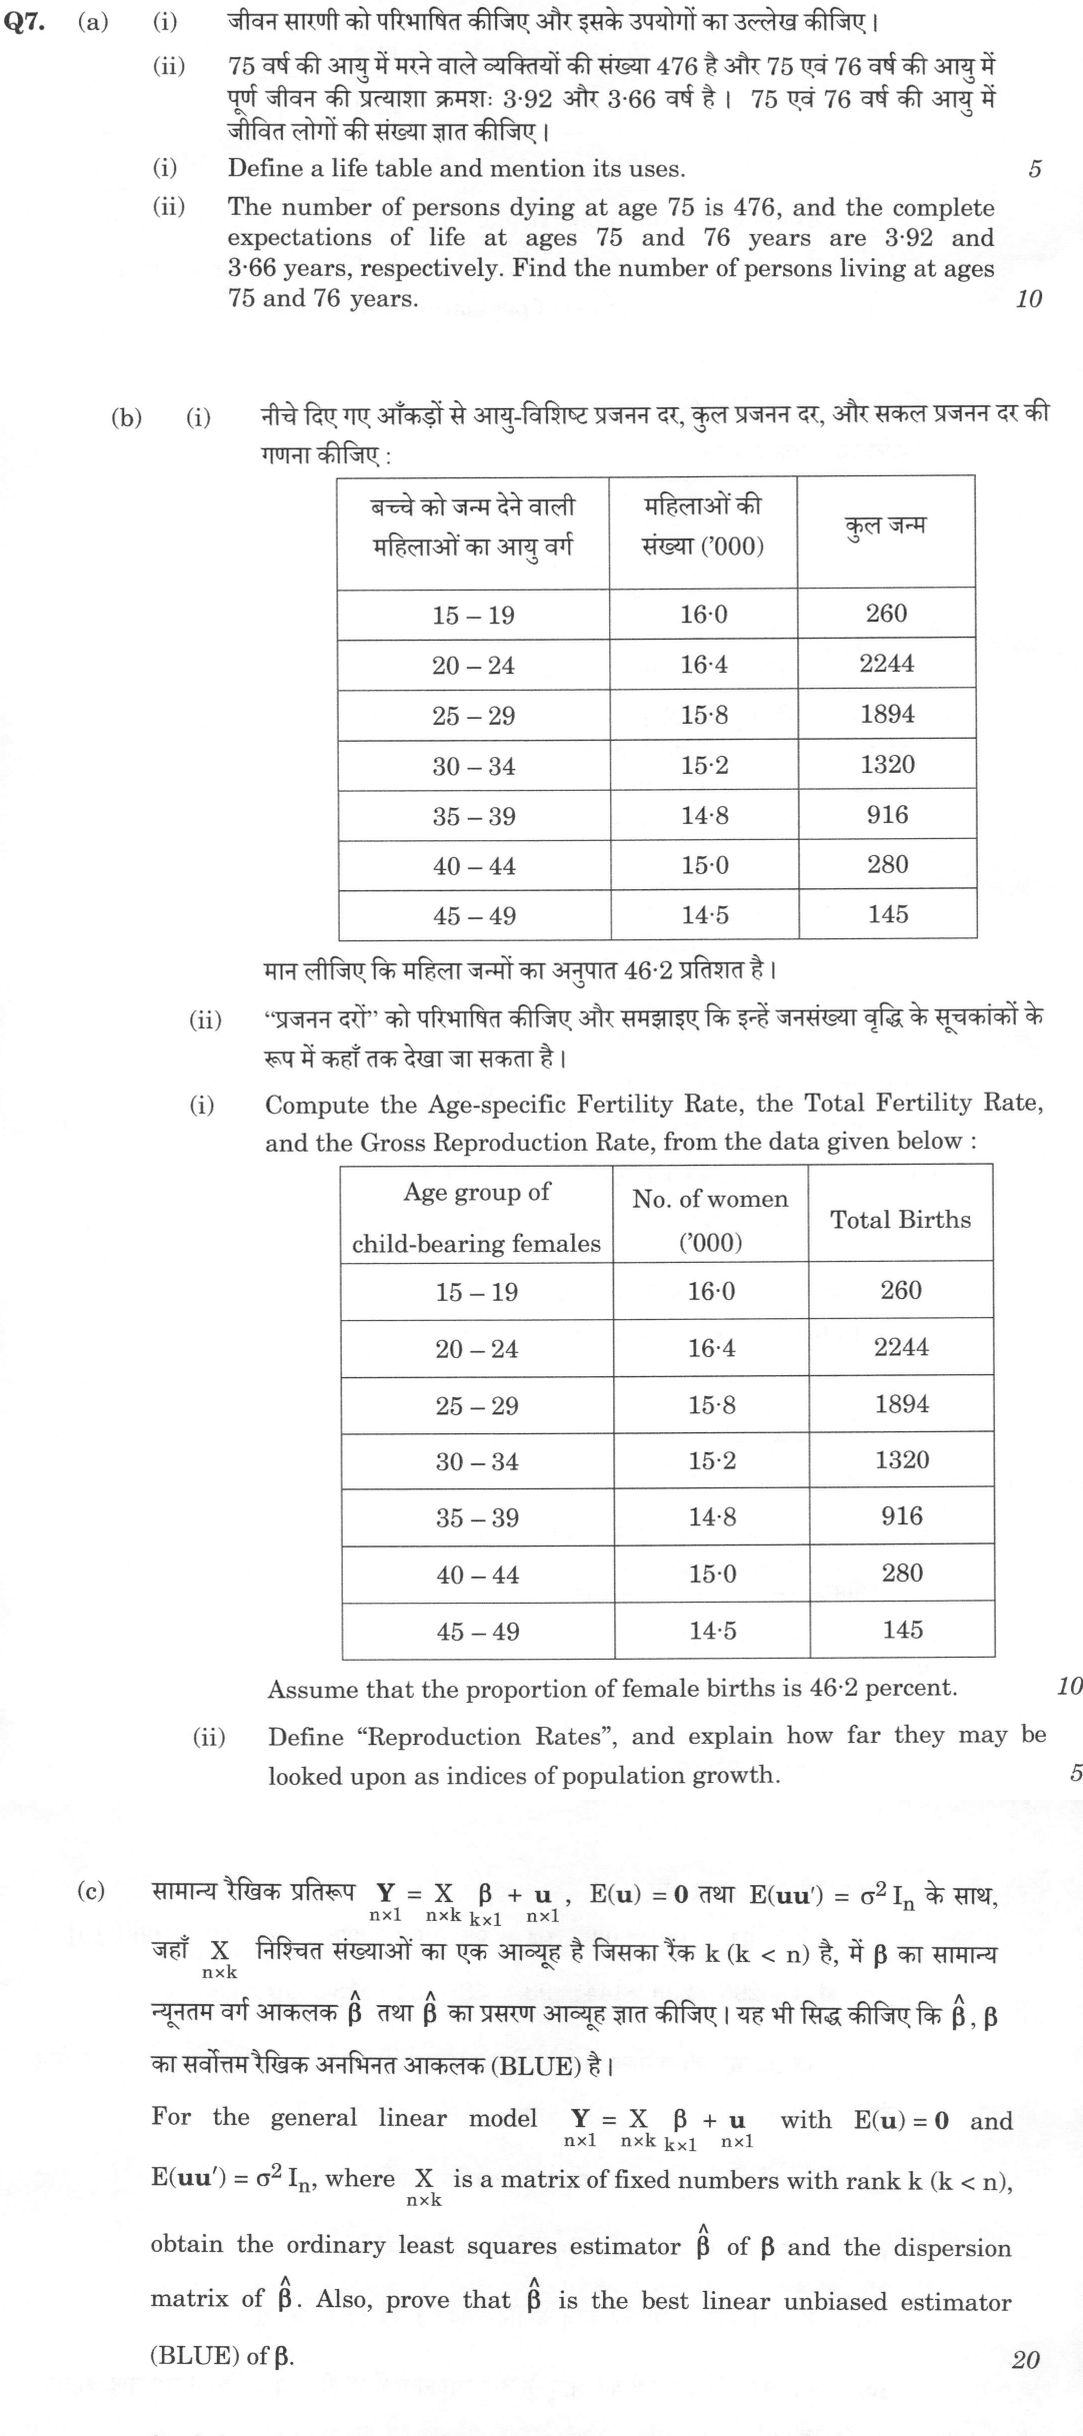
(a) (i) Define a life table and mention its uses. (5 marks) (ii) The number of persons dying at age 75 is 476, and the complete…
Define a life table and mention its uses. 5 marks
The number of persons dying at age 75 is 476, and the complete expectations of life at ages 75 and 76 years are 3·92 and 3·66 years, respectively. Find the number of persons living at ages 75 and 76 years. 10 marks
Compute the Age-specific Fertility Rate, the Total Fertility Rate, and the Gross Reproduction Rate, from the data given below :
[Table] Age group of child-bearing females | No. of women ('000) | Total Births 15 – 19 | 16·0 | 260 20 – 24 | 16·4 | 2244 25 – 29 | 15·8 | 1894 30 – 34 | 15·2 | 1320 35 – 39 | 14·8 | 916 40 – 44 | 15·0 | 280 45 – 49 | 14·5 | 145
Assume that the proportion of female births is 46·2 percent. 10 marks
Define “Reproduction Rates”, and explain how far they may be looked upon as indices of population growth. 5 marks
For the general linear model Y = X β + u with E(u) = 0 and E(uu') = σ² Iₙ, where X is a matrix of fixed numbers with rank k (k < n), obtain the ordinary least squares estimator β̂ of β and the dispersion matrix of β̂. Also, prove that β̂ is the best linear unbiased estimator (BLUE) of β. 20 marks
हिंदी में प्रश्न पढ़ें
जीवन सारणी को परिभाषित कीजिए और इसके उपयोगों का उल्लेख कीजिए। (5 अंक)
75 वर्ष की आयु में मरने वाले व्यक्तियों की संख्या 476 है और 75 एवं 76 वर्ष की आयु में पूर्ण जीवन की प्रत्याशा क्रमशः 3·92 और 3·66 वर्ष है । 75 एवं 76 वर्ष की आयु में जीवित लोगों की संख्या ज्ञात कीजिए। (10 अंक)
नीचे दिए गए आँकड़ों से आयु-विशिष्ट प्रजनन दर, कुल प्रजनन दर, और सकल प्रजनन दर की गणना कीजिए :
[सारणी] बच्चे को जन्म देने वाली महिलाओं का आयु वर्ग | महिलाओं की संख्या ('000) | कुल जन्म 15 – 19 | 16·0 | 260 20 – 24 | 16·4 | 2244 25 – 29 | 15·8 | 1894 30 – 34 | 15·2 | 1320 35 – 39 | 14·8 | 916 40 – 44 | 15·0 | 280 45 – 49 | 14·5 | 145
मान लीजिए कि महिला जन्मों का अनुपात 46·2 प्रतिशत है । (10 अंक)
“प्रजनन दरों” को परिभाषित कीजिए और समझाइए कि इन्हें जनसंख्या वृद्धि के सूचकांकों के रूप में कहाँ तक देखा जा सकता है । (5 अंक)
सामान्य रैखिक प्रतिरूप Y = X β + u , E(u) = 0 तथा E(uu') = σ² Iₙ के साथ, जहाँ X निश्चित संख्याओं का एक आव्यूह है जिसका रैंक k (k < n) है, में β का सामान्य न्यूनतम वर्ग आकलक β̂ तथा β̂ का प्रसरण आव्यूह ज्ञात कीजिए । यह भी सिद्ध कीजिए कि β̂, β का सर्वोत्तम रैखिक अनभिनत आकलक (BLUE) है । (20 अंक)
Model answer
Drafted with AI by UPSC Answer Check against this question's marking rubric, to the expected length. UPSC does not publish answers for Mains — this is one way to score well, not an official key. How we build rubrics and answers.
(a)(i) Life table and its uses (5 marks)
A life table is a statistical table showing how a hypothetical cohort (radix l₀, usually 100,000 births) diminishes with age under a fixed set of age-specific mortality rates, and so summarises the mortality experience of a population. Its columns are lₓ (survivors at age x), dₓ = lₓ − lₓ₊₁ (deaths), qₓ = dₓ/lₓ and pₓ = 1 − qₓ (probabilities of dying and surviving), Lₓ (person-years lived between x and x + 1), Tₓ (person-years lived above x) and eₓ = Tₓ/lₓ (expectation of life). Assumptions: a closed cohort with no migration, mortality rates constant in time, and deaths spread uniformly within each year of age. Uses: computing life expectancy and comparing mortality across regions and periods; premiums and annuities in insurance and pension planning; population projections and survival ratios; building stable-population models and net reproduction rates; and planning health services.
(a)(ii) Persons living at ages 75 and 76 (10 marks)
With deaths spread uniformly in a year, the complete expectation of life satisfies eₓ = ½ + pₓ(eₓ₊₁ + ½) (the curtate expectation is pₓ(1 + e^cₓ₊₁), and eₓ = eₓ^c + ½).
Hence p₇₅ = (e₇₅ − ½)/(e₇₆ + ½) = (3.92 − 0.5)/(3.66 + 0.5) = 3.42/4.16 = 0.8221, and q₇₅ = 1 − p₇₅ = 0.1779.
Since d₇₅ = l₇₅ q₇₅ = 476, l₇₅ = 476/0.1779 = 2,676 (approximately, 2,675.9).
Then l₇₆ = l₇₅ − d₇₅ = 2,676 − 476 = 2,200 (check: 2,676 × 0.8221 = 2,200).
So the number living at age 75 is about 2,676 and at age 76 about 2,200.
(b)(i) Fertility rates (10 marks)
Age-specific fertility rate, ASFR = births to women of the group/number of women in the group × 1,000. The women are in thousands, so for 15-19: 260/16,000 × 1,000 = 16.25.
Age group, ASFR per 1,000:
- 15-19: 260/16,000 = 16.25
- 20-24: 2,244/16,400 = 136.83
- 25-29: 1,894/15,800 = 119.87
- 30-34: 1,320/15,200 = 86.84
- 35-39: 916/14,800 = 61.89
- 40-44: 280/15,000 = 18.67
- 45-49: 145/14,500 = 10.00
The sum of ASFRs is 450.35 per 1,000. Total fertility rate TFR = 5 × ΣASFR (five-year groups) = 5 × 450.35/1,000 = 2.252 births per woman (or 2,252 per 1,000 women).
Gross reproduction rate GRR = TFR × proportion of female births = 2.252 × 0.462 = 1.040 daughters per woman. (Equivalently, ASFRs of female births are 7.51, 63.22, 55.38, 40.12, 28.59, 8.62, 4.62, which sum to 208.06 and give 5 × 0.20806 = 1.040.)
(b)(ii) Reproduction rates as indices of population growth (5 marks)
The gross reproduction rate is the average number of daughters a woman would bear in her lifetime if she experienced the current age-specific fertility rates and all survived to the end of the reproductive period. The net reproduction rate (NRR) allows for mortality: NRR = Σ fₓ (Lₓ/l₀), the number of daughters who would survive to their mother's age at birth.
As indices of growth: NRR = 1 means exact replacement and eventual zero growth, NRR > 1 growth and NRR < 1 decline; the long-run growth rate is r ≈ ln(NRR)/T, with T the mean generation length. They are better than crude rates because they are not affected by age structure. But they are limited: they describe eventual, not current, growth, since a young age structure carries momentum for decades; they assume constant fertility and mortality; they ignore migration and males; and tempo effects can distort period measures. Thus they are indices of replacement rather than exact indicators of population growth. GRR overstates because it ignores mortality.
(c) OLS estimator, dispersion matrix and BLUE property (20 marks)
Model: Y = Xβ + u, E(u) = 0, E(uu′) = σ²Iₙ, X fixed with rank k, so X′X is non-singular.
Estimator: minimise S = (Y − Xβ)′(Y − Xβ) = Y′Y − 2β′X′Y + β′X′Xβ. Setting ∂S/∂β = −2X′Y + 2X′Xβ = 0 gives the normal equations X′Xβ̂ = X′Y, so β̂ = (X′X)⁻¹X′Y. The second derivative 2X′X is positive definite, so this is a minimum.
Unbiasedness: β̂ = (X′X)⁻¹X′(Xβ + u) = β + (X′X)⁻¹X′u, so E(β̂) = β.
Dispersion matrix: β̂ − β = (X′X)⁻¹X′u, so D(β̂) = E[(X′X)⁻¹X′uu′X(X′X)⁻¹] = (X′X)⁻¹X′(σ²Iₙ)X(X′X)⁻¹ = σ²(X′X)⁻¹.
BLUE (Gauss-Markov): let β* = CY be any linear estimator, and write C = (X′X)⁻¹X′ + D, D an arbitrary k × n matrix. E(β*) = CXβ = β + DXβ, which equals β for all β only if DX = 0. Under this condition, β* − β = Cu = [(X′X)⁻¹X′ + D]u, and
D(β*) = σ²CC′ = σ²[(X′X)⁻¹X′X(X′X)⁻¹ + (X′X)⁻¹X′D′ + DX(X′X)⁻¹ + DD′] = σ²[(X′X)⁻¹ + DD′],
since the cross terms vanish because DX = 0 (and X′D′ = 0). Therefore D(β*) − D(β̂) = σ²DD′, which is positive semi-definite, so for every vector λ, Var(λ′β*) ≥ Var(λ′β̂), with equality only when D = 0. Thus β̂ has the minimum variance among linear unbiased estimators of every linear function of β; it is BLUE.
How this answer will be evaluated
Evaluation rubric
Each sub-part is marked on its own, against the marks and word limit printed on the paper.
- (a)(i) Define a life table and mention its uses (5). 5 marks
Must cover
- Definition: cohort surviving under fixed age-specific mortality, radix l₀
- Columns l_x, d_x, q_x, p_x, L_x, T_x, e_x
- Assumptions (closed cohort, constant rates, uniform deaths)
- At least three uses (life expectancy, insurance and pensions, projections, stable-population and NRR)
Loses marks
- Confusing life table with a mortality table alone.
- Listing uses only, no definition or columns.
- Wrong definitions of q_x or e_x.
Earns more
- Types: cohort versus period, complete versus abridged.
Extra mark
- Health-planning use
- (a)(ii) Given d₇₅ = 476, e₇₅ = 3.92 and e₇₆ = 3.66, find the numbers living at 75 and 76 (10). 10 marks
Must cover
- Relation e_x = ½ + p_x(e_{x+1} + ½)
- p₇₅ = 3.42/4.16 = 0.8221 and q₇₅ = 0.1779
- l₇₅ = 476/0.1779 ≈ 2,676
- l₇₆ = 2,676 − 476 = 2,200
Loses marks
- Using e_x = p_x(1 + e_{x+1}) without the ½ correction.
- Answer l₇₅ = 476/0.822.
- Arithmetic error in q.
Earns more
- Statement of the uniform-death assumption.
- Verification l₇₅p₇₅ ≈ l₇₆.
Extra mark
- Alternative T_x approach noted
- (b)(i) Compute ASFR, TFR and GRR from the data with 46.2% female births (10). 10 marks
Must cover
- ASFR = births/women × 1,000 for each of the seven groups: 16.25, 136.83, 119.87, 86.84, 61.89, 18.67, 10.00
- ΣASFR = 450.35 per 1,000
- TFR = 5 × ΣASFR = 2.252 per woman
- GRR = TFR × 0.462 = 1.040
Loses marks
- Forgetting the factor 5 for five-year groups.
- Missing conversion of thousands.
- Using 0.462 as percent (46.2).
Earns more
- Female ASFRs given as a check (sum 208.06).
- Correct treatment of women in thousands.
Extra mark
- Comparison of TFR with replacement level about 2.1
- (b)(ii) Define reproduction rates and explain how far they indicate population growth (5). 5 marks
Must cover
- GRR and NRR defined (daughters, mortality allowance)
- NRR = 1 replacement; >1 growth; <1 decline
- Limitations: eventual rather than current growth, age-structure momentum, constant rates, migration, tempo effects
- Balanced conclusion
Loses marks
- Confusing GRR with TFR.
- Ignoring the limitations.
- Claiming NRR gives the current growth rate.
Earns more
- r ≈ ln(NRR)/T relation.
- Comparison with crude rates.
Extra mark
- Indian TFR near replacement level
- (c) Obtain the OLS estimator of β and its dispersion matrix; prove BLUE (20). 20 marks
Must cover
- β̂ = (X′X)⁻¹X′Y from the normal equations, with rank condition
- Unbiasedness E(β̂) = β
- D(β̂) = σ²(X′X)⁻¹
- Gauss-Markov: β* = CY with C = (X′X)⁻¹X′ + D, DX = 0 from unbiasedness
- D(β*) = σ²[(X′X)⁻¹ + DD′], DD′ positive semi-definite so β̂ has minimum variance
Loses marks
- Skipping the DX = 0 step.
- Stating the result without the cross-term cancellation.
- Confusing BLUE with maximum-likelihood optimality.
Earns more
- Second-order condition shown.
- Statement for every linear function λ′β.
Extra mark
- Note that no normality is required
What "Mention" is asking you to do
Put specific factual content on record — the names, features, targets or instances the stem asks for. Mention is usually the subordinate half of a larger question, so it must be done fully but quickly, leaving room for the part that carries the main directive.
Structure that answers it
The items named directly, without preamble → one qualifying detail against each → straight on to the part of the stem the marks actually sit in
Where marks are lost
Gesturing at the category instead of naming the particulars, or expanding it until the analytical half of the question is squeezed.
Practice this exact question
Write your answer and it is marked point by point against the model answer above — what you covered, what you missed, what you got wrong.
Evaluate my answer →More from Statistics 2026 Paper II
- Q4 (a) (i) Discuss the theoretical basis of the sequential probability ratio test (SPRT) in…
- Q5 (a) Explain the 2-stage least squares (2SLS) method of estimation for the following simul…
- Q6 (a) Define autocorrelation of order k and correlogram. For an infinite series generated b…
- Q7 (a) (i) Define a life table and mention its uses. (5 marks) (ii) The number of persons dy…
- Q8 (a) Consider the following structural equation model assuming Y's as endogenous and X's a…