Paper II — Q6
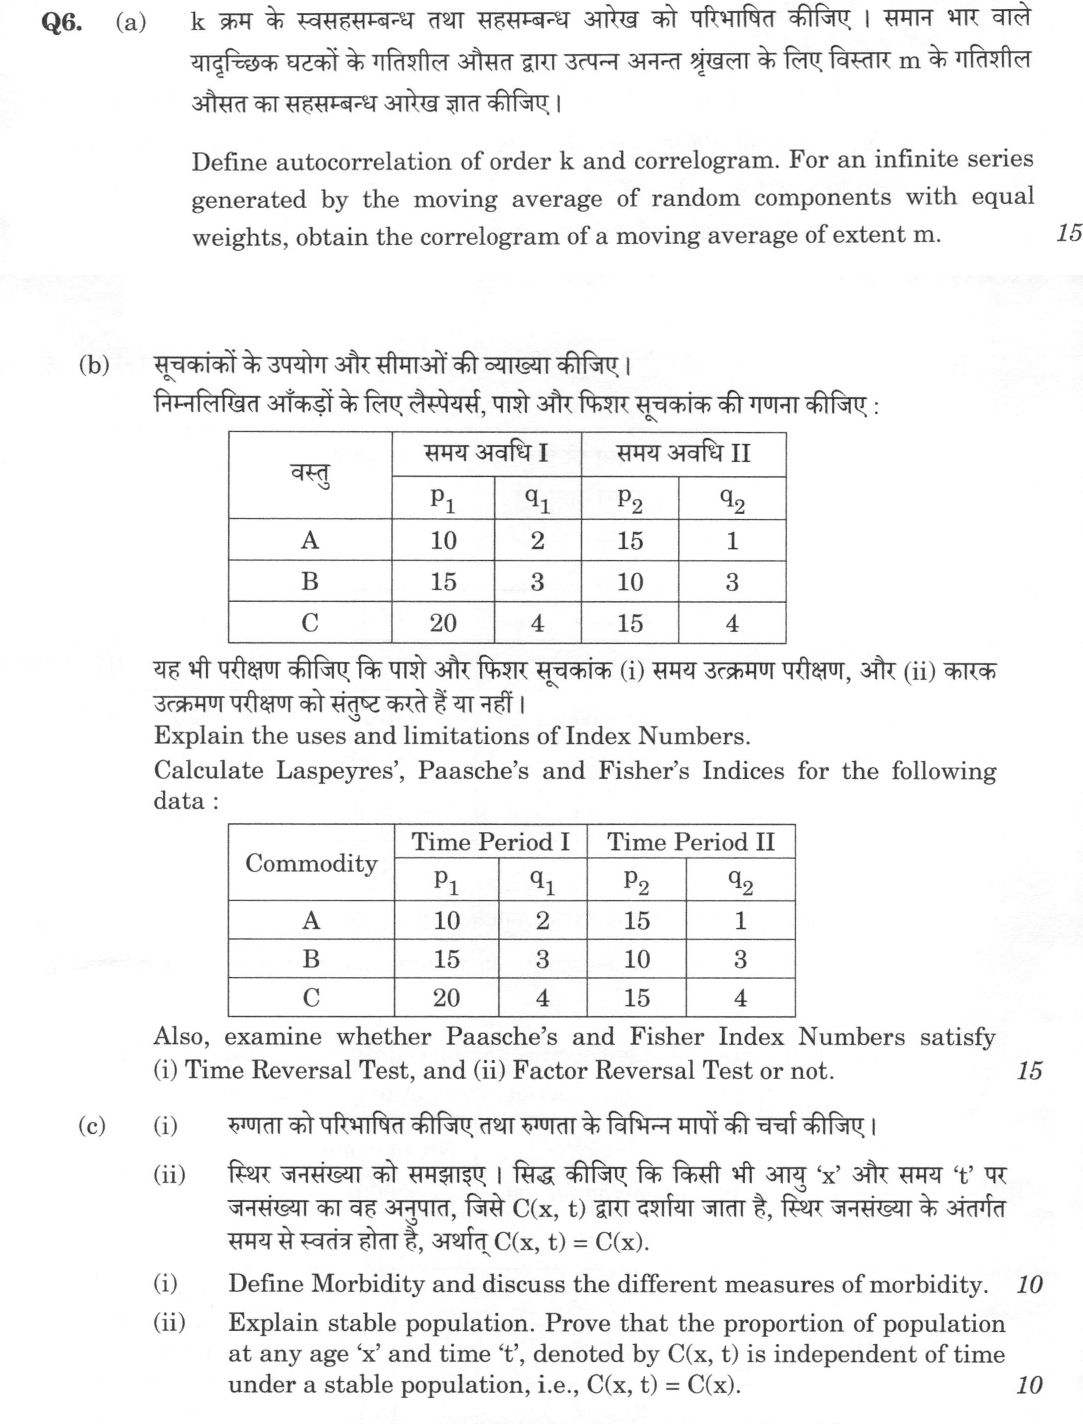
(a) Define autocorrelation of order k and correlogram. For an infinite series generated by the moving average of random…
Define autocorrelation of order k and correlogram. For an infinite series generated by the moving average of random components with equal weights, obtain the correlogram of a moving average of extent m. 15 marks
Explain the uses and limitations of Index Numbers. Calculate Laspeyres', Paasche's and Fisher's Indices for the following data : Commodity | Time Period I (P1, q1) | Time Period II (P2, q2) A | 10, 2 | 15, 1 B | 15, 3 | 10, 3 C | 20, 4 | 15, 4 Also, examine whether Paasche's and Fisher Index Numbers satisfy (i) Time Reversal Test, and (ii) Factor Reversal Test or not. 15 marks
Define Morbidity and discuss the different measures of morbidity. 10 marks
Explain stable population. Prove that the proportion of population at any age 'x' and time 't', denoted by C(x, t) is independent of time under a stable population, i.e., C(x, t) = C(x). 10 marks
हिंदी में प्रश्न पढ़ें
k क्रम के स्वसहसम्बन्ध तथा सहसम्बन्ध आरेख को परिभाषित कीजिए । समान भार वाले यादृच्छिक घटकों के गतिशील औसत द्वारा उत्पन्न अनन्त शृंखला के लिए विस्तार m के गतिशील औसत का सहसम्बन्ध आरेख ज्ञात कीजिए । (15 अंक)
सूचकांकों के उपयोग और सीमाओं की व्याख्या कीजिए। निम्नलिखित आँकड़ों के लिए लैस्पेयर्स, पाशे और फिशर सूचकांक की गणना कीजिए : वस्तु | समय अवधि I (P1, q1) | समय अवधि II (P2, q2) A | 10, 2 | 15, 1 B | 15, 3 | 10, 3 C | 20, 4 | 15, 4 यह भी परीक्षण कीजिए कि पाशे और फिशर सूचकांक (i) समय उत्क्रमण परीक्षण, और (ii) कारक उत्क्रमण परीक्षण को संतुष्ट करते हैं या नहीं। (15 अंक)
ऋणता को परिभाषित कीजिए तथा ऋणता के विभिन्न मापों की चर्चा कीजिए। (10 अंक)
स्थिर जनसंख्या को समझाइए । सिद्ध कीजिए कि किसी भी आयु 'x' और समय 't' पर जनसंख्या का वह अनुपात, जिसे C(x, t) द्वारा दर्शाया जाता है, स्थिर जनसंख्या के अंतर्गत समय से स्वतंत्र होता है, अर्थात् C(x, t) = C(x). (10 अंक)
Model answer
Drafted with AI by UPSC Answer Check against this question's marking rubric, to the expected length. UPSC does not publish answers for Mains — this is one way to score well, not an official key. How we build rubrics and answers.
(a) Autocorrelation, correlogram and the moving-average series (15 marks)
The autocorrelation of order k of a stationary series is ρₖ = γₖ/γ₀ = Cov(xₜ, xₜ₊ₖ)/Var(xₜ), the correlation between observations k periods apart, with ρ₀ = 1 and ρ₋ₖ = ρₖ. The correlogram is the plot of ρₖ (sample estimates rₖ) against the lag k = 0, 1, 2, …; it displays the structure of the series and is used to identify its type, for example a slowly damped pattern for a trend, oscillation for a seasonal or cyclical series, and rapid fall to zero for a random series.
Let εₜ be uncorrelated random components with mean 0 and variance σ², and let the series be the equal-weight moving average of extent m:
xₜ = (1/m)(εₜ + εₜ₋₁ + … + εₜ₋ₘ₊₁).
Then E(xₜ) = 0 and γ₀ = Var(xₜ) = m σ²/m² = σ²/m. For lag k, xₜ and xₜ₊ₖ have the terms εₜ₊ₖ, …, εₜ₊ₖ₋ₘ₊₁ and εₜ, …, εₜ₋ₘ₊₁, which share the m − k random components common to both windows when k < m, and none when k ≥ m. Hence
γₖ = (m − k)σ²/m² for k ≤ m, and γₖ = 0 for k ≥ m,
and therefore
ρₖ = γₖ/γ₀ = (m − k)/m = 1 − k/m for 0 ≤ k ≤ m; ρₖ = 0 for k ≥ m.
The correlogram is thus a straight line falling from 1 at k = 0 to 0 at k = m (a triangle), and zero beyond the lag m. The figure shows the case m = 6, where ρₖ = 1, 5/6, 4/6, 3/6, 2/6, 1/6, 0. The oscillations and correlations that a moving average creates in a purely random series are the Slutsky-Yule effect: the series is autocorrelated although its underlying components are independent.

(b) Index numbers: uses, limitations and calculation (15 marks)
Uses: index numbers measure relative changes in prices, quantities or values over time or place; they act as economic barometers (the CPI, WPI and IIP), are used for deflating nominal values to real values, for indexing wages and dearness allowance, for policy and forecasting, and for comparing standards of living.
Limitations: they are only approximate averages; the choice of base year, of items and of weights affects the result, and old weights become out of date; different formulae give different answers, with substitution bias in the Laspeyres index; quality changes and new goods are hard to capture; and an index for one group or place may not be valid for another.
Calculation, with base period I and current period II. Σp₁q₁ = 10·2 + 15·3 + 20·4 = 145; Σp₂q₁ = 15·2 + 10·3 + 15·4 = 120; Σp₁q₂ = 10·1 + 15·3 + 20·4 = 135; Σp₂q₂ = 15·1 + 10·3 + 15·4 = 105.
Laspeyres P_L = Σp₂q₁/Σp₁q₁ × 100 = 120/145 × 100 = 82.76. Paasche P_P = Σp₂q₂/Σp₁q₂ × 100 = 105/135 × 100 = 77.78. Fisher P_F = √(P_L × P_P) = √(0.8276 × 0.7778) × 100 = 80.23.
Time reversal test: P₀₁ × P₁₀ = 1. For Fisher, P₁₀ = √[(Σp₁q₂/Σp₂q₂)(Σp₁q₁/Σp₂q₁)] = 1/P₀₁, so the test is satisfied. For Paasche, P₀₁ = 105/135 = 0.7778 and P₁₀ = Σp₁q₁/Σp₂q₁ = 145/120 = 1.2083, and the product is 0.9398 ≠ 1, so the test fails.
Factor reversal test: P₀₁ × Q₀₁ = Σp₂q₂/Σp₁q₁ = 105/145 = 0.7241. For Fisher, Q₀₁ = √[(Σp₁q₂/Σp₁q₁)(Σp₂q₂/Σp₂q₁)] = √(0.9310 × 0.8750) = 0.9026, and 0.8023 × 0.9026 = 0.7241, so it is satisfied. For Paasche, Q₀₁ = Σp₂q₂/Σp₂q₁ = 105/120 = 0.875, and 0.7778 × 0.875 = 0.6806 ≠ 0.7241, so it fails. Hence Fisher's index satisfies both tests, whereas Paasche satisfies neither.
(c)(i) Morbidity and its measures (10 marks)
Morbidity is any departure, subjective or objective, from a state of physiological or psychological well-being, so that illness, injury or disability is present. It is measured by:
- Incidence rate: new cases occurring in a period divided by the population at risk, times a constant (for example 1,000). It measures the risk of falling ill.
- Prevalence: all existing cases (old and new) divided by population, at a point in time (point prevalence) or over a period (period prevalence). Approximately prevalence = incidence × average duration.
- Attack rate: cases among those exposed during an epidemic, and secondary attack rate among contacts.
- Case-fatality rate: deaths from a disease divided by the cases of that disease; and the duration of illness.
- Disability-based measures: days of disability or sickness absence, disability-free life expectancy, and the composite DALY (years of life lost plus years lived with disability) and its Sullivan-method relatives.
- Sources are surveys (NSS, NFHS, self-reports), hospital records and disease registries, with limitations from reporting bias and differing definitions.
(c)(ii) Stable population and C(x, t) = C(x) (10 marks)
A stable population is one that has had constant age-specific fertility and mortality rates for a long time and is closed to migration; it grows or declines at a constant rate r, and its age distribution is fixed. Let l(a) be the survival function from birth (l(0) = 1) and B(t) the annual births. By Lotka's renewal equation B(t) = ∫B(t − a)l(a)m(a)da, with m(a) the maternity function fixed; its solution is B(t) = B(0)e^rt, where r is the real root of ∫e^-ral(a)m(a)da = 1.
Persons aged x at time t are those born at t − x who have survived to x, so N(x, t) = B(t − x)l(x) = B(0)e^r(t − x)l(x). The total population is N(t) = ∫₀^ω N(a, t)da = B(0)e^rt∫₀^ω e^-ral(a)da. Hence the proportion at age x is
C(x, t) = N(x, t)/N(t) = e^-rxl(x)/∫₀^ω e^-ral(a)da,
in which t does not appear. Thus C(x, t) = C(x), independent of time: the age distribution of a stable population is constant, and it depends only on r and the survival function.
How this answer will be evaluated
Evaluation rubric
Each sub-part is marked on its own, against the marks and word limit printed on the paper.
- (a) Define autocorrelation of order k and correlogram; for the equal-weight m-term moving average of random components, obtain the correlogram (15). 15 marks
Must cover
- ρ_k = γ_k/γ₀ and the correlogram as the plot of ρ_k against k
- γ₀ = σ²/m and γ_k = (m−k)σ²/m² from the m − k common components
- ρ_k = (m − k)/m for k ≤ m and 0 for k ≥ m
- Correlogram drawn: linear fall from 1 at k = 0 to 0 at k = m, zero beyond
Loses marks
- Using variance σ² instead of σ²/m in ρ_k.
- Correlogram not returning to zero at k = m.
- Confusing autocorrelation with the ordinary correlation coefficient.
Earns more
- Derivation with the counting of common terms shown.
- Interpretation of what the correlogram reveals (or Slutsky-Yule effect).
Extra mark
- Sample estimate r_k and its use in identifying series type
- (b) Explain uses and limitations of index numbers; compute Laspeyres, Paasche and Fisher indices; test time reversal and factor reversal for Paasche and Fisher (15). 15 marks
Must cover
- At least three uses and three limitations
- Laspeyres 82.76, Paasche 77.78 and Fisher 80.23 with the four sums 145, 120, 135, 105
- Time reversal: Fisher satisfies (P₀₁P₁₀ = 1); Paasche fails (0.9398)
- Factor reversal: Fisher satisfies (P·Q = 0.7241); Paasche fails (0.6806)
Loses marks
- Swapping Laspeyres and Paasche weights.
- Concluding Paasche satisfies a test without computation.
- Arithmetic errors in the sums.
Earns more
- Fisher quantity index Q₀₁ = 0.9026 computed correctly.
- Shown Paasche P₁₀ = 145/120.
Extra mark
- Remark that Fisher is the ideal index
- (c)(i) Define morbidity and discuss the measures of morbidity (10). 10 marks
Must cover
- Definition of morbidity as departure from well-being
- Incidence and prevalence with formulae and their relation (P ≈ I × D)
- Attack rate, case-fatality rate or duration of illness
- Disability-based or composite measures (DALY, disability days) and data sources
Loses marks
- Confusing morbidity with mortality.
- Incidence and prevalence given the same definition.
- No formulae or denominators.
Earns more
- Denominators (population at risk) stated correctly.
- Limitations of morbidity data (reporting bias).
Extra mark
- Sullivan's method or HALE
- (c)(ii) Explain stable population; prove that C(x, t) = C(x) (10). 10 marks
Must cover
- Definition: fixed fertility and mortality for a long time, closed to migration, constant growth rate r
- B(t) = B(0)e^{rt} from Lotka's equation
- N(x, t) = B(t−x)l(x) = B(0)e^{r(t−x)}l(x)
- C(x, t) = e^{-rx}l(x)/∫e^{-ra}l(a)da, independent of t
Loses marks
- Assuming the result without derivation.
- Omitting the survival function l(x).
- Confusing stable with stationary population.
Earns more
- Total population N(t) integrated correctly over ages.
- Statement that C depends only on r and l(x).
Extra mark
- Distinction from stationary (r = 0) and quasi-stable populations
What "Define" is asking you to do
Give the precise meaning together with the boundary that separates it from neighbouring concepts. In the optionals a define clause almost always opens a longer part, so it has to be exact and short enough to leave room for what follows.
Structure that answers it
Core definition → essential attributes → what it excludes → example
Where marks are lost
A loose paraphrase. A definition earns its mark by excluding as much as by including.
Practice this exact question
Write your answer and it is marked point by point against the model answer above — what you covered, what you missed, what you got wrong.
Evaluate my answer →More from Statistics 2026 Paper II
- Q3 (a) How will you draw the OC curve for a single sampling plan with sample size 5, if the…
- Q4 (a) (i) Discuss the theoretical basis of the sequential probability ratio test (SPRT) in…
- Q5 (a) Explain the 2-stage least squares (2SLS) method of estimation for the following simul…
- Q6 (a) Define autocorrelation of order k and correlogram. For an infinite series generated b…
- Q7 (a) (i) Define a life table and mention its uses. (5 marks) (ii) The number of persons dy…
- Q8 (a) Consider the following structural equation model assuming Y's as endogenous and X's a…