Paper I — Q6
(a) Define regression. Explain different methods and applications of regression analysis. (20 marks) (b) Define food chain…
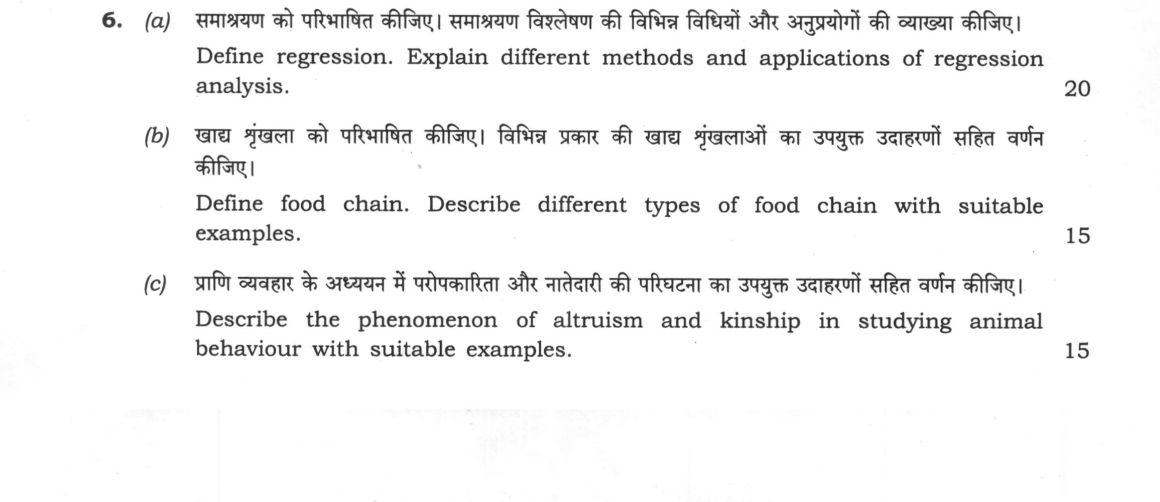
Define regression. Explain different methods and applications of regression analysis. 20 marks
Define food chain. Describe different types of food chain with suitable examples. 15 marks
Describe the phenomenon of altruism and kinship in studying animal behaviour with suitable examples. 15 marks
हिंदी में प्रश्न पढ़ें
समाश्रयण को परिभाषित कीजिए। समाश्रयण विश्लेषण की विभिन्न विधियों और अनुप्रयोगों की व्याख्या कीजिए। (20 अंक)
खाद्य श्रृंखला को परिभाषित कीजिए। विभिन्न प्रकार की खाद्य श्रृंखलाओं का उपयुक्त उदाहरणों सहित वर्णन कीजिए। (15 अंक)
प्राणि व्यवहार के अध्ययन में परोपकारिता और नातेदारी की परिघटना का उपयुक्त उदाहरणों सहित वर्णन कीजिए। (15 अंक)
Model answer
Written by UPSC Answer Check against this question's marking rubric, to the expected length. UPSC does not publish answers for Mains — this is one way to score well, not an official key.
Regression is a statistical technique that models how a dependent variable (Y) changes with one or more independent variables (X), allowing prediction and inference. It differs from correlation, which only measures the strength and direction of association, by estimating an equation and quantifying the effect of X on Y. The simplest form is linear regression, Y = a + bX + e, fitted by least squares, which minimises the sum of squared residuals. Multiple regression, Y = b0 + b1X1 + b2X2 + …, separates the effects of several factors; logistic regression, logit(p) = b0 + b1X, models binary outcomes such as presence/absence; polynomial regression, Y = a + bX + cX², captures curvilinear trends. The coefficient of determination (R²) measures goodness of fit, i.e. the proportion of variance in Y explained by the model, while standard error indicates uncertainty in estimates. In ecology, regression underpins species distribution models that use temperature, rainfall and elevation to predict climate-change impacts on Himalayan biodiversity; in epidemiology it relates disease incidence to climate or vector density; in wildlife management it forecasts population trends from census and habitat data.
A food chain is a linear sequence of energy transfer from producers to consumers, each trophic level losing most energy as heat so that only about 10% is passed on, producing ecological pyramids that narrow upward. Pyramids of number, biomass and energy therefore reflect these losses. A grazing chain begins with living plants: in grasslands, grass → grasshopper → frog → snake → hawk; similar chains operate in Western Ghats grassland and forest-edge habitats. A detritus chain begins with dead organic matter: on a forest floor, leaf litter → earthworm → centipede → shrew; in Sundarbans mangroves, mangrove leaf litter → detritivorous crabs or fish → fish → crocodile. These chains show how energy and nutrients move through ecosystems, but real communities are better represented by food webs, because most organisms feed at more than one level.
Altruism is behaviour in which an actor incurs a cost (C) while a recipient gains a benefit (B). Kinship explains its evolution through inclusive fitness, the sum of direct and indirect fitness: an allele can spread if the actor’s relatedness to the recipient (r) makes rB > C, Hamilton’s rule. In meerkats, alarm calls expose the caller to predators (C), but alert kin (B), so calls are favoured when relatedness is high. Indian blue-bearded bee-eaters show cooperative breeding: helpers delay their own reproduction to feed nestlings, gaining indirect fitness by aiding siblings or parents. In Apis cerana honeybees, eusociality involves workers forgoing reproduction to maintain the colony; because queens are polyandrous, worker-worker relatedness is lower than 0.75 and often below 0.5, so the advantage cannot be reduced to full-sister relatedness. Instead, workers gain inclusive fitness from helping the queen and colony when relatedness to colony members, queen control and colony-level benefits make rB exceed C. Reciprocal altruism extends the logic to non-kin: vampire bats share blood meals with helpers who have fed them, favoured by repeated encounters and memory. This explains why altruism is common in family groups and rare where kinship is weak. Thus altruism is a cost-benefit strategy shaped by kinship, reciprocity and ecological constraints.
Together, these concepts show how zoology links statistical and behavioural ecology to conservation. Regression models can forecast how warming will shift Himalayan species ranges and disease risk, while understanding food chains and altruistic kinship helps protect energy flows, social colonies and cooperative species in protected areas such as Western Ghats and Sundarbans. Such evidence-based approaches support monitoring by the Wildlife Institute of India and state forest departments, enabling targeted interventions for climate-vulnerable Himalayan fauna.
What "Explain" is asking you to do
Make the working of something clear — what sets it off, what follows from what, and what it produces. Explain is the Commission's mechanism word: it dominates the technical papers and the “explain why” stems, where the marks sit in the causal chain and not in the label.
Structure that answers it
State what it is → the initiating condition → the chain of cause, step by step → an instance where it plays out → what the chain produces
Where marks are lost
Describing what something looks like instead of why it works that way. Naming the stages without linking them reads as description too.
How this answer will be evaluated
Approach
Framework: Zoology Paper 1: Define > Structure/Mechanism > Diagram > Example. (a) explain: definition/context > points in order > small example > short close | (b) describe: define > structure or process in order > labelled diagram > significance | (c) describe: define > structure or process in order > labelled diagram > significance Full marks: Precise definitions, clear distinction of methods/types, specific biological examples, and correct application of theories.
Key points expected
- Precise definition of regression analysis
- Distinction between simple and multiple regression
- Explanation of least squares method
- Specific applications in biological data
- Definition of food chain and trophic levels
- Description of grazing food chain
- Description of detritus food chain
- Suitable examples for each type
Evaluation rubric
Each sub-part is marked on its own, against the marks and word limit printed on the paper.
- (a) Definition of regression, methods (Simple/Multiple), and applications. 20 marks
explain— definition/context → points in order → small example → short close
Must cover
- Precise definition of regression analysis
- Distinction between simple and multiple regression
- Explanation of least squares method
- Specific applications in biological data
Loses marks
- Confusing correlation with regression
- Lack of biological examples
- Vague description of methods
Earns more
- Mention of correlation coefficient (r)
- Reference to regression coefficient (b)
- Example of linear vs non-linear regression
- Use of scatter plot for illustration
Extra mark
- Equation of regression line (y = a + bx)
- Mention of ANOVA in regression
- (b) Definition of food chain and types with examples. 15 marks
describe— define → structure or process in order → labelled diagram → significance
Must cover
- Definition of food chain and trophic levels
- Description of grazing food chain
- Description of detritus food chain
- Suitable examples for each type
Loses marks
- Missing detritus food chain
- No examples provided
- Confusing food chain with food web
Earns more
- Mention of energy flow direction
- Reference to ecological pyramids
- Distinction between producers and consumers
- Mention of decomposers in detritus chain
Extra mark
- Diagram of a specific food chain
- Mention of food web complexity
- (c) Phenomenon of altruism and kinship in animal behaviour. 15 marks
describe— define → structure or process in order → labelled diagram → significance
Must cover
- Definition of altruism in ethology
- Explanation of kinship/kin selection
- Mention of Hamilton's rule (rB > C)
- Suitable examples (e.g., social insects)
Loses marks
- Confusing altruism with mutualism
- No mention of kin selection
- Lack of specific animal examples
Earns more
- Reference to inclusive fitness
- Example of alarm calls in birds
- Mention of reciprocal altruism
- Explanation of genetic relatedness
Extra mark
- Specific example of eusociality (ants/bees)
- Mention of W.D. Hamilton by name
Practice this exact question
Write your answer and it is marked point by point against the model answer above — what you covered, what you missed, what you got wrong.
Evaluate my answer →More from Zoology 2023 Paper I
- Q3 (a) Explain the general features, life cycle and pathogenicity of Taenia. (20 marks) (b)…
- Q4 (a) Draw a well-labelled diagram of adrenal gland and discuss the functions of its hormon…
- Q5 Write short notes on the following in about 150 words each: (a) Ecological niche (10 mark…
- Q6 (a) Define regression. Explain different methods and applications of regression analysis.…
- Q7 (a) What is lac culture? Explain the life cycle of lac insect and describe cultivation an…
- Q8 (a) What is ELISA? Explain the principle, types, procedure and applications of ELISA. (20…