Paper II — Q2
(a) For a project consisting of several activities, the allotted time and the dependencies of the activities are presented…
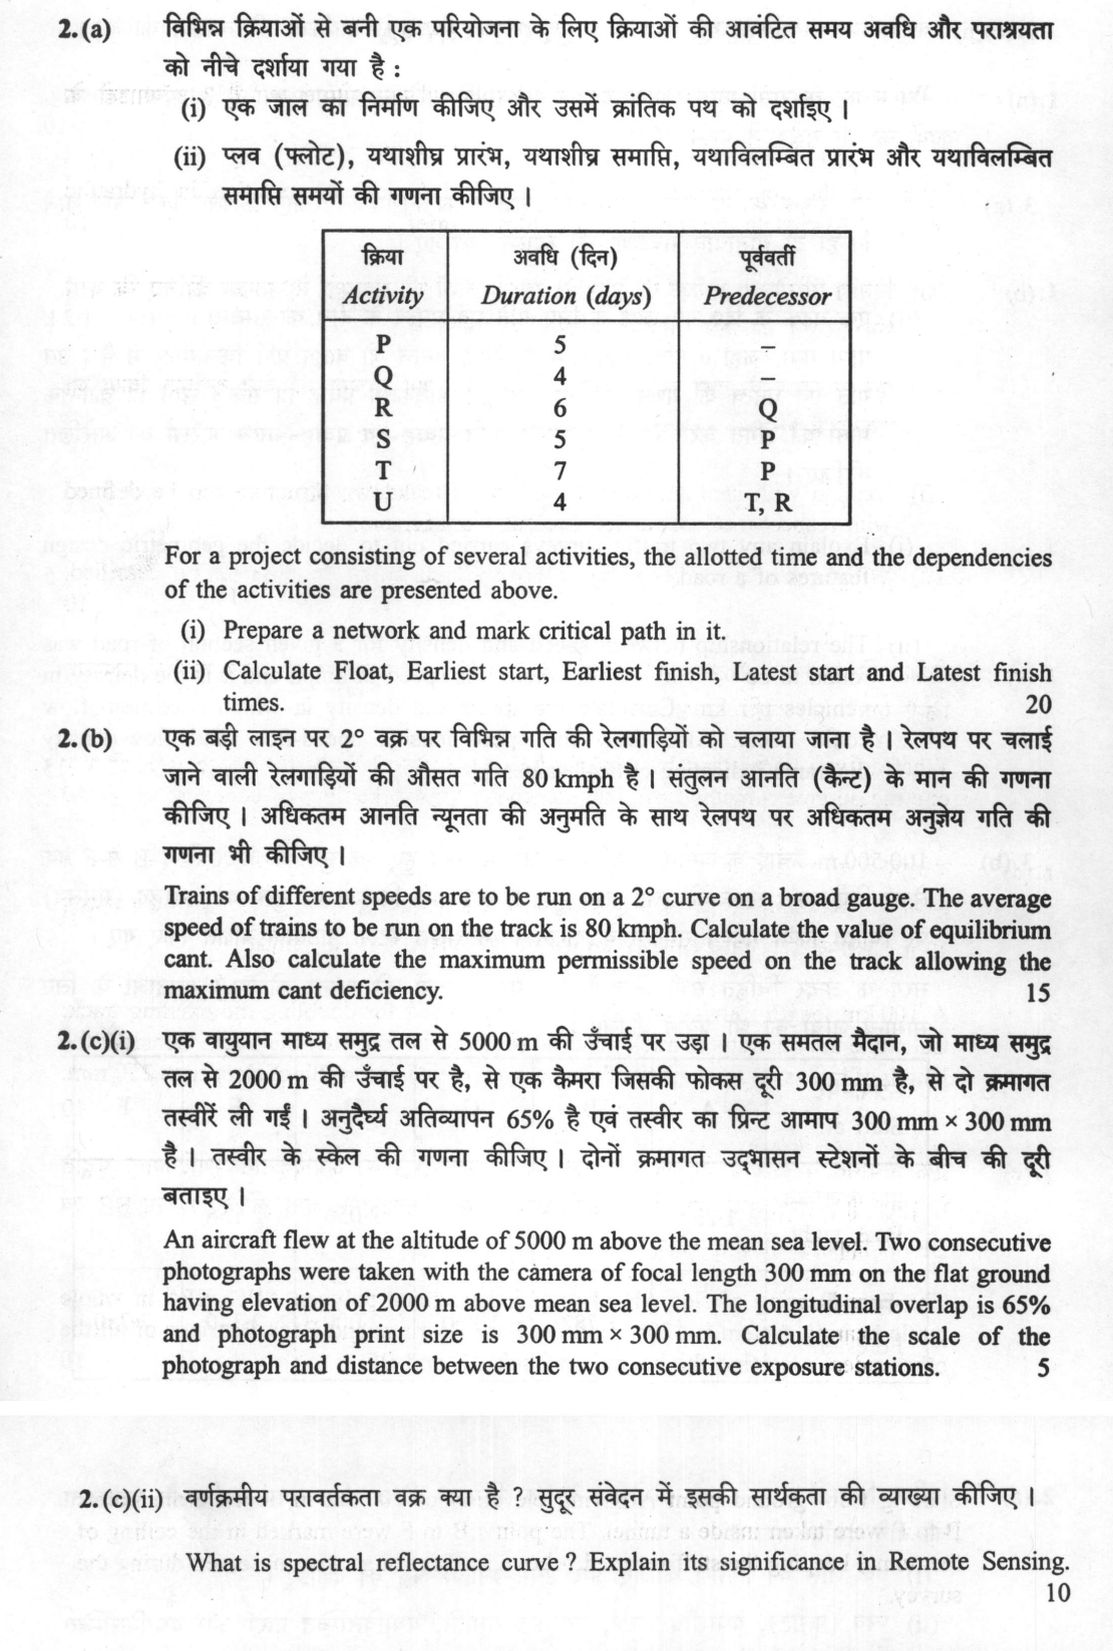
For a project consisting of several activities, the allotted time and the dependencies of the activities are presented below:
| Activity | Duration (days) | Predecessor |
|---|---|---|
| P | 5 | – |
| Q | 4 | – |
| R | 6 | Q |
| S | 5 | P |
| T | 7 | P |
| U | 4 | T, R |
Prepare a network and mark critical path in it.
Calculate Float, Earliest start, Earliest finish, Latest start and Latest finish times. 20 marks
Trains of different speeds are to be run on a 2° curve on a broad gauge. The average speed of trains to be run on the track is 80 kmph. Calculate the value of equilibrium cant. Also calculate the maximum permissible speed on the track allowing the maximum cant deficiency. 15 marks
An aircraft flew at the altitude of 5000 m above the mean sea level. Two consecutive photographs were taken with the camera of focal length 300 mm on the flat ground having elevation of 2000 m above mean sea level. The longitudinal overlap is 65% and photograph print size is 300 mm × 300 mm. Calculate the scale of the photograph and distance between the two consecutive exposure stations. 5 marks
What is spectral reflectance curve ? Explain its significance in Remote Sensing. 10 marks
हिंदी में प्रश्न पढ़ें
विभिन्न क्रियाओं से बनी एक परियोजना के लिए क्रियाओं की आवंटित समय अवधि और पराश्रयता को नीचे दर्शाया गया है :
| क्रिया | अवधि (दिन) | पूर्ववर्ती |
|---|---|---|
| P | 5 | – |
| Q | 4 | – |
| R | 6 | Q |
| S | 5 | P |
| T | 7 | P |
| U | 4 | T, R |
एक जाल का निर्माण कीजिए और उसमें कांतिक पथ को दर्शाइए।
प्लव (फ्लोट), यथाशीघ्र प्रारंभ, यथाशीघ्र समाप्ति, यथाविलंबित प्रारंभ और यथाविलंबित समाप्ति समयों की गणना कीजिए। (20 अंक)
एक बड़ी लाइन पर 2° वक्र पर विभिन्न गति की रेलगाड़ियों को चलाया जाना है। रेलपथ पर चलाई जाने वाली रेलगाड़ियों की औसत गति 80 kmph है। संतुलन आनति (कैंट) के मान की गणना कीजिए। अधिकतम आनति न्यूनता की अनुमति के साथ रेलपथ पर अधिकतम अनुज्ञेय गति की गणना भी कीजिए। (15 अंक)
एक वायुयान माध्य समुद्र तल से 5000 m की ऊँचाई पर उड़ा। एक समतल मैदान, जो माध्य समुद्र तल से 2000 m की ऊँचाई पर है, से एक कैमरा जिसकी फोकस दूरी 300 mm है, से दो क्रमागत तस्वीरें ली गईं। अनुदैर्ध्य अतिव्यापन 65% है एवं तस्वीर का प्रिंट आमाप 300 mm × 300 mm है। तस्वीर के स्केल की गणना कीजिए। दोनों क्रमागत उद्भासन स्टेशनों के बीच की दूरी बताइए। (5 अंक)
वर्णक्रमीय परावर्तकता वक्र क्या है ? सुदूर संवेदन में इसकी सार्थकता की व्याख्या कीजिए। (10 अंक)
Model answer
Written by UPSC Answer Check against this question's marking rubric, to the expected length. UPSC does not publish answers for Mains — this is one way to score well, not an official key.
(a)(i) Using the Critical Path Method (CPM), the precedence links are: P precedes S and T; Q precedes R; T and R precede U. In activity-on-node form the network is:
- P(5) → S(5), P(5) → T(7)
- Q(4) → R(6)
- T(7) → U(4), R(6) → U(4)
Forward pass:
- P: ES = 0, EF = 5
- Q: ES = 0, EF = 4
- S: ES = 5, EF = 10
- T: ES = 5, EF = 12
- R: ES = 4, EF = 10
- U: ES = max(12, 10) = 12, EF = 16
Hence project duration = 16 days.
Backward pass, taking terminal activities S and U to finish at 16 days:
- U: LF = 16, LS = 12
- T: LF = 12, LS = 5
- R: LF = 12, LS = 6
- S: LF = 16, LS = 11
- P: LF = min(LS of S, LS of T) = min(11, 5) = 5, LS = 0
- Q: LF = LS of R = 6, LS = 2
Critical activities have Float = 0: P, T and U. Critical path: P → T → U, duration = 5 + 7 + 4 = 16 days.
(a)(ii) Using total float as Float = LS − ES = LF − EF:
- P: ES = 0, EF = 5, LS = 0, LF = 5, Float = 0
- Q: ES = 0, EF = 4, LS = 2, LF = 6, Float = 2
- R: ES = 4, EF = 10, LS = 6, LF = 12, Float = 2
- S: ES = 5, EF = 10, LS = 11, LF = 16, Float = 6
- T: ES = 5, EF = 12, LS = 5, LF = 12, Float = 0
- U: ES = 12, EF = 16, LS = 12, LF = 16, Float = 0
Final times: P(0,5,0,5,0); Q(0,4,2,6,2); R(4,10,6,12,2); S(5,10,11,16,6); T(5,12,5,12,0); U(12,16,12,16,0).
(b) For broad gauge, G = 1.676 m = 167.6 cm. For a 2° curve, using the chord definition for broad gauge: R = 1720/D = 1720/2 = 860 m.
Equilibrium cant formula: e = G V²/(127 R), where e is in cm, G in cm, V in kmph, R in m.
Given average speed V = 80 kmph: e = 167.6 × 80²/(127 × 860) e = 167.6 × 6400/109220 e = 9.82 cm.
Equilibrium cant = 9.82 cm.
For maximum permissible speed, allow maximum cant deficiency for broad gauge, taken as 7.5 cm. Then: e + cant deficiency = G Vmax²/(127 R) Vmax² = (9.82 + 7.5) × 127 × 860/167.6 Vmax² = 17.32 × 109220/167.6 = 11286.94 Vmax = √11286.94 = 106.24 kmph.
Maximum permissible speed ≈ 106.24 kmph ≈ 106 kmph. This is valid for the given average-speed cant and the standard maximum cant deficiency of 7.5 cm.
(c)(i) Focal length f = 300 mm = 0.300 m. Flying height above mean sea level = 5000 m. Ground elevation = 2000 m. Flying height above ground = 5000 − 2000 = 3000 m.
Scale of photograph = f/(H − h) = 0.300/3000 = 1/10000. Scale = 1:10,000.
Print size along flight = 300 mm = 0.300 m. Ground coverage along flight = 0.300 × 10000 = 3000 m. Longitudinal overlap = 65%, so new ground covered between exposures = (1 − 0.65) × 3000 = 0.35 × 3000 = 1050 m.
Distance between consecutive exposure stations = 1050 m.
(c)(ii) A spectral reflectance curve is a graph showing the reflectance, usually as a percentage, of an object or surface as a function of wavelength of electromagnetic radiation. It is also called a spectral signature. It shows how much incident energy is reflected at different wavelengths and where absorption occurs.
Its significance in remote sensing is that different materials have different spectral reflectance curves. For example, healthy vegetation reflects strongly in the near-infrared and green regions but absorbs red and blue; water reflects little in the near-infrared; dry soil shows increasing reflectance with wavelength. These characteristic curves help in identifying and classifying land cover, crops, forests, water bodies, soils, minerals and urban surfaces. They also guide selection of suitable spectral bands and sensors for a particular application, help in developing vegetation indices such as NDVI, and enable monitoring of crop health, moisture stress, pollution and environmental change. Thus, spectral reflectance curves form the physical basis of image interpretation and digital classification in remote sensing.
What "Solve" is asking you to do
Choose the method, then carry it through to a final answer. Identifying what kind of problem this is and why that method applies is the first thing marked; a correct figure arrived at invisibly earns almost nothing.
Structure that answers it
Given data and what is required → method chosen, with the reason it applies → set-up (equation, circuit, free body, trial balance) → working, step by step → answer with units and any condition of validity
Where marks are lost
Doing the middle steps mentally and writing only the result. In mathematics papers, a further loss comes from giving a decimal where the exact value in surds or fractions was wanted, or from skipping the justification a part explicitly asks for.
How this answer will be evaluated
Approach
(a) calculate: given > formula > substitution > result with units > interpretation | (b) calculate: given > formula > substitution > result with units > interpretation | (c(i)) calculate: given > formula > substitution > result with units > interpretation | (c(ii)) explain: definition/context > points in order > small example > short close Full marks: All parts fully answered with correct formulas, units, and clear diagrams; no calculation errors; code references where applicable.
Key points expected
- Correct network diagram with nodes and arrows
- Critical path identified and marked
- ES, EF, LS, LF calculated for all activities
- Total float calculated for each activity
- Equilibrium cant formula stated and applied
- Cant deficiency value stated (IS code)
- Maximum permissible speed calculated
- Units consistent (kmph, mm, degrees)
Evaluation rubric
Each sub-part is marked on its own, against the marks and word limit printed on the paper.
- (a) Network diagram with critical path and CPM time parameters for all activities. 20 marks
calculate— given → formula → substitution → result with units → interpretation
Must cover
- Correct network diagram with nodes and arrows
- Critical path identified and marked
- ES, EF, LS, LF calculated for all activities
- Total float calculated for each activity
Loses marks
- Missing float calculation for non-critical activities
- Critical path not marked on the diagram
- No units on time parameters
Earns more
- Forward and backward pass shown clearly
- Critical path duration stated explicitly
- Units (days) carried through all calculations
Extra mark
- Neatly labelled AON or AOA sketch
- (b) Equilibrium cant value and maximum permissible speed for a 2° curve on BG track. 15 marks
calculate— given → formula → substitution → result with units → interpretation
Must cover
- Equilibrium cant formula stated and applied
- Cant deficiency value stated (IS code)
- Maximum permissible speed calculated
- Units consistent (kmph, mm, degrees)
Loses marks
- Cant deficiency value not stated
- No formula shown for equilibrium cant
- Units inconsistent or missing
Earns more
- IS code clause for cant deficiency cited
- Step-by-step substitution shown
- Result checked against permissible limits
Extra mark
- Reference to IS 830 or relevant RDSO code
- (c(i)) Photograph scale and distance between consecutive exposure stations. 5 marks
calculate— given → formula → substitution → result with units → interpretation
Must cover
- Scale calculated from focal length and flying height
- Ground distance per photo derived from print size and scale
- Exposure station distance calculated using 65% overlap
- Units converted correctly (mm to m)
Loses marks
- Scale not calculated from given altitude and focal length
- Overlap percentage not applied correctly
- Unit conversion errors (mm vs m)
Earns more
- Formula for scale stated explicitly
- Overlap formula shown: D = (1 - overlap) × ground distance
Extra mark
- Neat sketch of consecutive photos with overlap
- (c(ii)) Definition of spectral reflectance curve and its significance in Remote Sensing. 10 marks
explain— definition/context → points in order → small example → short close
Must cover
- Definition of spectral reflectance curve given
- Significance in identifying land cover/vegetation explained
- Example of application (e.g., NDVI, water body detection)
- Link to electromagnetic spectrum bands
Loses marks
- No definition or vague description
- No example of application in RS
- No link to spectral bands or sensors
Earns more
- Graph or sketch of typical reflectance curve
- Mention of specific sensors (Landsat, Sentinel)
- Comparison of healthy vs stressed vegetation curves
Extra mark
- Reference to specific spectral bands (e.g., NIR, Red)
Practice this exact question
Write your answer and it is marked point by point against the model answer above — what you covered, what you missed, what you got wrong.
Evaluate my answer →More from Civil Engineering 2023 Paper II
- Q1 (a) What are the approximate limits of chemical (oxide) composition in hydraulic cement ?…
- Q2 (a) For a project consisting of several activities, the allotted time and the dependencie…
- Q3 (a) (i) Explain any two traffic surveys carried out to decide the geometric design featur…
- Q4 (a) A machine was purchased for ₹4,50,000 on 1st January 2001 and erection and installati…
- Q5 (a) A 6-hour unit hydrograph has the following ordinates : If φ index is 0·3 cm/hr and ba…