Paper II — Q6
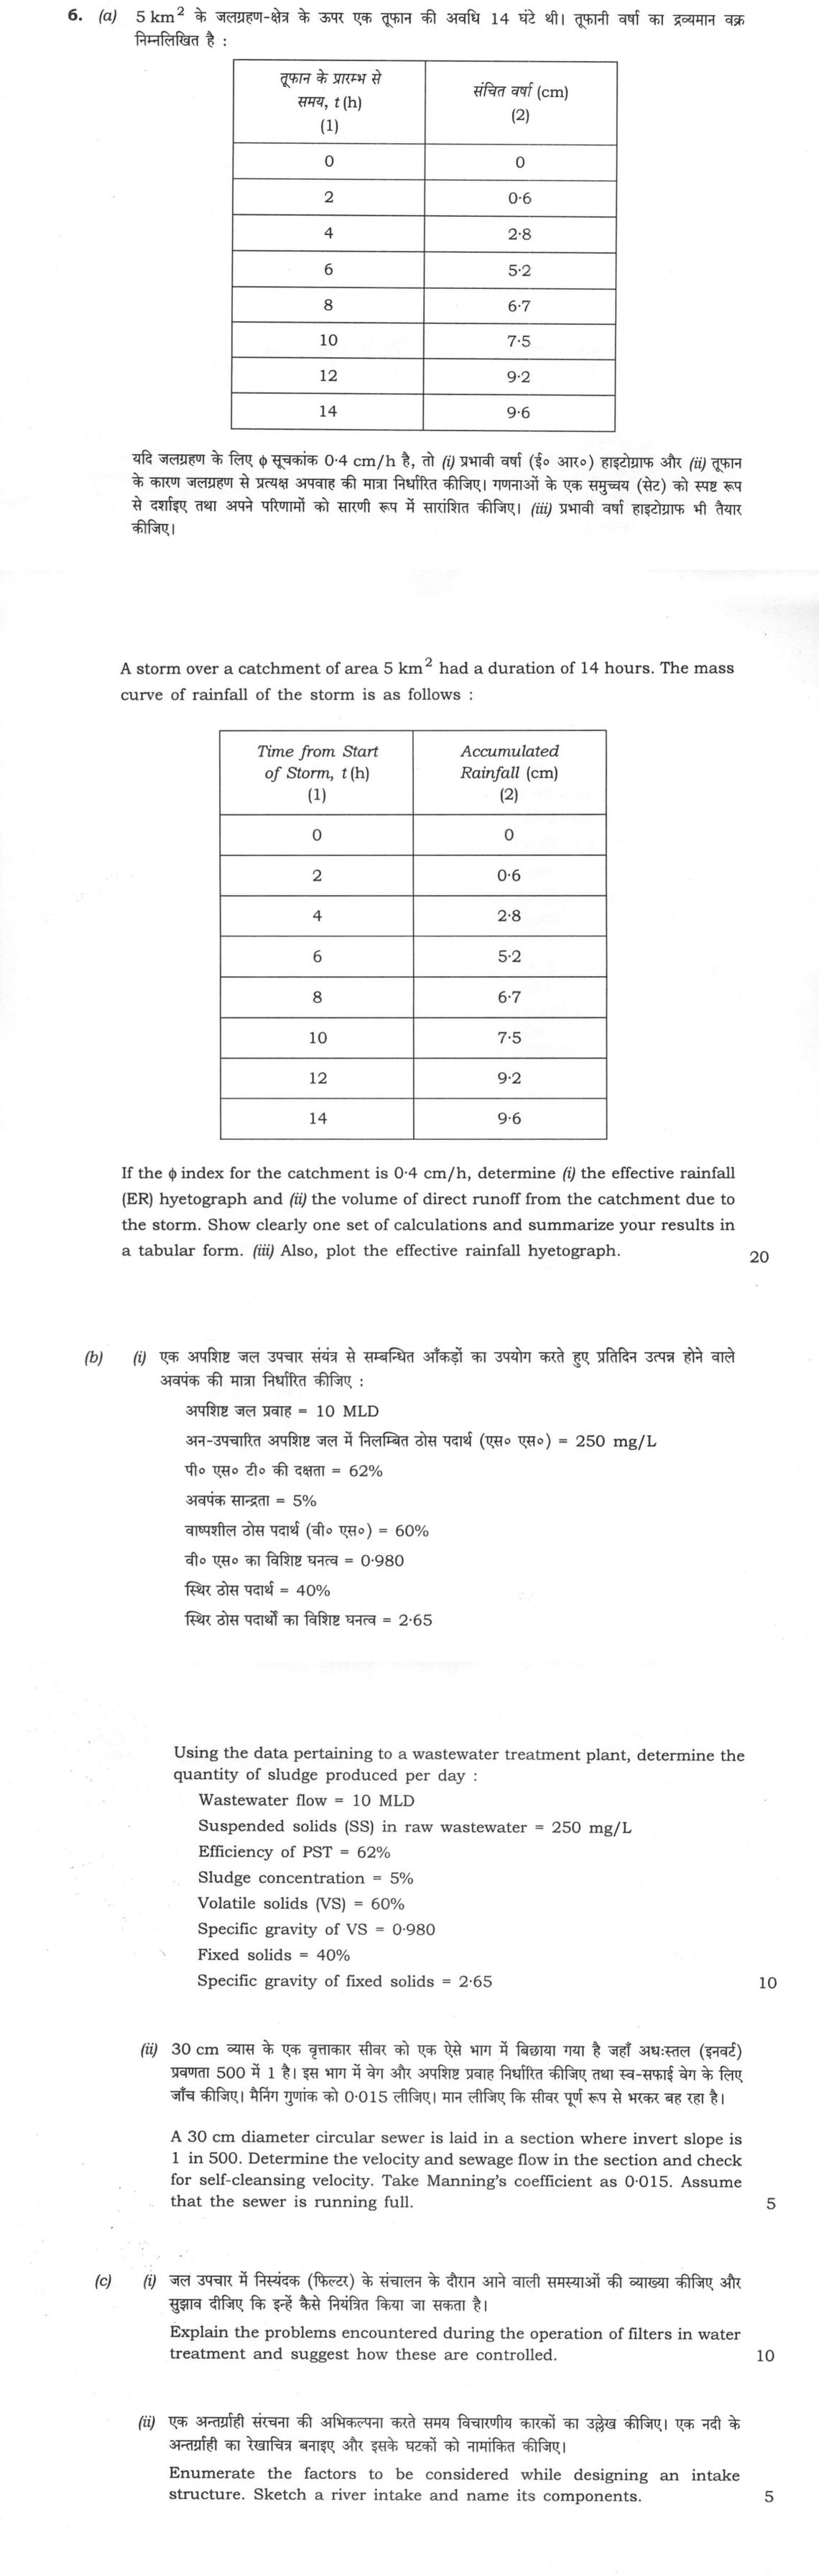
(a) A storm over a catchment of area 5 km² had a duration of 14 hours. The mass curve of rainfall of the storm is as follows: |…
A storm over a catchment of area 5 km² had a duration of 14 hours. The mass curve of rainfall of the storm is as follows:
| Time from Start of Storm, t (h) (1) | Accumulated Rainfall (cm) (2) |
|---|---|
| 0 | 0 |
| 2 | 0·6 |
| 4 | 2·8 |
| 6 | 5·2 |
| 8 | 6·7 |
| 10 | 7·5 |
| 12 | 9·2 |
| 14 | 9·6 |
If the φ index for the catchment is 0·4 cm/h, determine (i) the effective rainfall (ER) hyetograph and (ii) the volume of direct runoff from the catchment due to the storm. Show clearly one set of calculations and summarize your results in a tabular form. (iii) Also, plot the effective rainfall hyetograph.
20
Using the data pertaining to a wastewater treatment plant, determine the quantity of sludge produced per day:
Wastewater flow = 10 MLD
Suspended solids (SS) in raw wastewater = 250 mg/L
Efficiency of PST = 62%
Sludge concentration = 5%
Volatile solids (VS) = 60%
Specific gravity of VS = 0·980
Fixed solids = 40%
Specific gravity of fixed solids = 2·65
10
A 30 cm diameter circular sewer is laid in a section where invert slope is 1 in 500. Determine the velocity and sewage flow in the section and check for self-cleansing velocity. Take Manning's coefficient as 0·015. Assume that the sewer is running full.
5
Explain the problems encountered during the operation of filters in water treatment and suggest how these are controlled.
10
Enumerate the factors to be considered while designing an intake structure. Sketch a river intake and name its components.
5
हिंदी में प्रश्न पढ़ें
5 km² के जलग्रहण-क्षेत्र के ऊपर एक तूफान की अवधि 14 घंटे थी। तूफानी वर्षा का द्रव्यमान वक्र निम्नलिखित है :
यदि जलग्रहण के लिए φ सूचकांक 0·4 cm/h है, तो (i) प्रभावी वर्षा (ई० आर०) हाइटोग्राफ और (ii) तूफान के कारण जलग्रहण से प्रत्यक्ष अपवाह की मात्रा निर्धारित कीजिए। गणनाओं के एक समुच्चय (सेट) को स्पष्ट रूप से दर्शाइए तथा अपने परिणामों को सारणी रूप में सारांशित कीजिए। (iii) प्रभावी वर्षा हाइटोग्राफ भी तैयार कीजिए।
20
एक अपशिष्ट जल उपचार संयंत्र से संबंधित आँकड़ों का उपयोग करते हुए प्रतिदिन उत्पन्न होने वाले अवपेक की मात्रा निर्धारित कीजिए :
अपशिष्ट जल प्रवाह = 10 MLD
अन-उपचारित अपशिष्ट जल में निलंबित ठोस पदार्थ (एस० एस०) = 250 mg/L
पी० एस० टी० की दक्षता = 62%
अवपेक सांद्रता = 5%
वाष्पशील ठोस पदार्थ (वी० एस०) = 60%
वी० एस० का विशिष्ट घनत्व = 0·980
स्थिर ठोस पदार्थ = 40%
स्थिर ठोस पदार्थों का विशिष्ट घनत्व = 2·65
10
30 cm व्यास के एक वृत्ताकार सीवर को एक ऐसे भाग में बिछाया गया है जहाँ अधःस्तल (इनवर्ट) प्रवणता 500 में 1 है। इस भाग में वेग और अपशिष्ट प्रवाह निर्धारित कीजिए तथा स्व-सफाई वेग के लिए जाँच कीजिए। मैनिंग गुणांक को 0·015 लीजिए। मान लीजिए कि सीवर पूर्ण रूप से भरकर बह रहा है।
5
जल उपचार में निसंदेक (फिल्टर) के संचालन के दौरान आने वाली समस्याओं की व्याख्या कीजिए और सुझाव दीजिए कि इन्हें कैसे नियंत्रित किया जा सकता है।
10
एक अंतर्ग्राही संरचना की अभिकल्पना करते समय विचारणीय कारकों का उल्लेख कीजिए। एक नदी के अंतर्ग्राही का रेखाचित्र बनाइए और इसके घटकों को नामांकित कीजिए।
5
Model answer
Written by UPSC Answer Check against this question's marking rubric, to the expected length. UPSC does not publish answers for Mains — this is one way to score well, not an official key.
(a)(i) Using the φ-index method, for each 2 h interval: P = mass-curve difference, i = P/2, and ER = (i − φ)×2 = P − 0.8 cm if i > φ; otherwise ER = 0. Here φ = 0.4 cm/h, so φ×2 = 0.8 cm. This method is valid when the φ-index is constant and the abstraction rate cannot exceed the actual rainfall intensity.
Sample calculation, 2–4 h: P = 2.8 − 0.6 = 2.2 cm; i = 2.2/2 = 1.10 cm/h > 0.4 cm/h. ER = (1.10 − 0.40)×2 = 1.40 cm.
Summary (tabular form):
- 0–2 h: P = 0.60 cm, i = 0.30 cm/h, ER = 0 cm, ER intensity = 0 cm/h
- 2–4 h: P = 2.20 cm, i = 1.10 cm/h, ER = 1.40 cm, ER intensity = 0.70 cm/h
- 4–6 h: P = 2.40 cm, i = 1.20 cm/h, ER = 1.60 cm, ER intensity = 0.80 cm/h
- 6–8 h: P = 1.50 cm, i = 0.75 cm/h, ER = 0.70 cm, ER intensity = 0.35 cm/h
- 8–10 h: P = 0.80 cm, i = 0.40 cm/h = φ, ER = 0 cm, ER intensity = 0 cm/h
- 10–12 h: P = 1.70 cm, i = 0.85 cm/h, ER = 0.90 cm, ER intensity = 0.45 cm/h
- 12–14 h: P = 0.40 cm, i = 0.20 cm/h, ER = 0 cm, ER intensity = 0 cm/h
Total effective rainfall depth = 1.40 + 1.60 + 0.70 + 0.90 = 4.60 cm.
(a)(ii) Direct runoff volume = effective rainfall depth × catchment area. Area = 5 km² = 5 × 10⁶ m². ER depth = 4.60 cm = 0.0460 m. Volume = 0.0460 × 5 × 10⁶ = 230,000 m³ = 2.30 × 10⁵ m³.
(a)(iii) Effective rainfall hyetograph: plot time interval on the x-axis and ER intensity on the y-axis. Bars are: 0–2 h = 0; 2–4 h = 0.70; 4–6 h = 0.80; 6–8 h = 0.35; 8–10 h = 0; 10–12 h = 0.45; 12–14 h = 0 (all in cm/h). The peak occurs in the 4–6 h interval at 0.80 cm/h.
(b)(i) Wastewater flow = 10 MLD = 10 × 10⁶ L/d = 10⁴ m³/d. Raw SS = 250 mg/L = 250 g/m³. SS load = 250 × 10⁴ = 2.50 × 10⁶ g/d = 2500 kg/d. SS removed by PST at 62% efficiency = 0.62 × 2500 = 1550 kg/d dry solids.
At 5% sludge concentration, wet sludge mass = 1550/0.05 = 31,000 kg/d.
Specific gravity of dry solids: 1/G_s = (60/100)/0.980 + (40/100)/2.65 = 0.6122 + 0.1509 = 0.7632 G_s = 1.310.
Sludge specific gravity: 1/G_sludge = 0.05/1.310 + 0.95/1.00 = 0.9882 G_sludge = 1.012, so ρ_sludge = 1012 kg/m³. Sludge volume = 31,000/1012 = 30.6 m³/d.
Thus sludge produced ≈ 1550 kg/d dry, 31,000 kg/d wet, or 30.6 m³/d. This assumes steady flow, constant PST efficiency, and sludge concentration by weight.
(b)(ii) Manning’s formula: V = (1/n) R^(2/3) S^(1/2). Valid for turbulent, uniform open-channel flow with constant n. D = 0.30 m, running full: A = πD²/4 = π(0.30)²/4 = 0.0707 m². R = D/4 = 0.075 m. S = 1/500 = 0.002. R^(2/3) = (0.075)^(2/3) = 0.1778. S^(1/2) = √0.002 = 0.04472. V = (1/0.015)(0.1778)(0.04472) = 0.530 m/s. Q = A V = 0.0707 × 0.530 = 0.0375 m³/s = 37.5 L/s.
Self-cleansing check: usual minimum self-cleansing velocity for sewage is about 0.6–0.9 m/s. Here V = 0.53 m/s < 0.6 m/s, so the sewer is not self-cleansing under full-flow conditions; siltation risk exists.
(c)(i) Problems during filter operation include: rapid clogging and high head loss, short filter runs, mud-ball formation, filter-bed cracking and shrinkage causing short-circuiting, air binding, negative head, sand incrustation, gravel displacement, media loss during backwash, underdrain blockage, biological growth, and turbidity breakthrough. Controls include proper coagulation, flocculation and sedimentation before filtration, correct media grading and depth, dual-media or anthracite filters where needed, regular air-water backwashing with surface wash, controlled backwash rate, periodic cleaning or replacement of media, maintenance of underdrains, monitoring head loss and effluent turbidity, and filter-to-waste after backwashing.
(c)(ii) Factors for intake design: location away from pollution, erosion and navigation; adequate water depth in lean season; flood safety and freeboard; low intake velocity; screens to exclude debris, fish and ice; silt control; foundation conditions; pump suction requirements; accessibility; and provision for maintenance and redundancy.
Schematic river intake: River → trash rack → intake mouth with coarse screen → bell-mouth pipe/conduit → intake well/sump → fine screen → gate valve → pump suction → pump house → treatment plant. Components: trash rack, coarse screen, intake mouth, bell-mouth entry, intake conduit, intake well/sump, fine screen, gate valve, pumps, pump house, and access arrangement.
What "Solve" is asking you to do
Choose the method, then carry it through to a final answer. Identifying what kind of problem this is and why that method applies is the first thing marked; a correct figure arrived at invisibly earns almost nothing.
Structure that answers it
Given data and what is required → method chosen, with the reason it applies → set-up (equation, circuit, free body, trial balance) → working, step by step → answer with units and any condition of validity
Where marks are lost
Doing the middle steps mentally and writing only the result. In mathematics papers, a further loss comes from giving a decimal where the exact value in surds or fractions was wanted, or from skipping the justification a part explicitly asks for.
How this answer will be evaluated
Approach
(a) calculate: given > formula > substitution > result with units > interpretation | (b(i)) calculate: given > formula > substitution > result with units > interpretation | (b(ii)) calculate: given > formula > substitution > result with units > interpretation | (c(i)) explain: definition/context > points in order > small example > short close | (c(ii)) enumerate: list the items in order > one line each > no commentary Full marks: All calculations shown with units, correct formulas, neat diagrams, and complete answers to all sub-parts.
Key points expected
- Convert accumulated rainfall to incremental rainfall
- Apply φ index (0.4 cm/h) to find effective rainfall
- Calculate volume of direct runoff (ER × Area)
- Present results in a tabular form
- Calculate mass of solids removed (Flow × SS × Efficiency)
- Determine volume of sludge using specific gravity
- Account for volatile and fixed solids composition
- State final sludge quantity in m³/day
Evaluation rubric
Each sub-part is marked on its own, against the marks and word limit printed on the paper.
- (a) Effective rainfall hyetograph and volume of direct runoff. 20 marks
calculate— given → formula → substitution → result with units → interpretation
Must cover
- Convert accumulated rainfall to incremental rainfall
- Apply φ index (0.4 cm/h) to find effective rainfall
- Calculate volume of direct runoff (ER × Area)
- Present results in a tabular form
Loses marks
- Using accumulated rainfall directly for runoff
- Omitting units in final volume calculation
Earns more
- Plot the effective rainfall hyetograph
- Show one set of detailed calculations
Extra mark
- Neatly labelled hyetograph diagram
- (b(i)) Quantity of sludge produced per day. 10 marks
calculate— given → formula → substitution → result with units → interpretation
Must cover
- Calculate mass of solids removed (Flow × SS × Efficiency)
- Determine volume of sludge using specific gravity
- Account for volatile and fixed solids composition
- State final sludge quantity in m³/day
Loses marks
- Ignoring specific gravity of solids
- Confusing mass and volume of sludge
Earns more
- Show step-by-step mass balance
- Use correct specific gravity values
Extra mark
- Mention standard sludge handling practices
- (b(ii)) Velocity, sewage flow, and self-cleansing check. 5 marks
calculate— given → formula → substitution → result with units → interpretation
Must cover
- Apply Manning's formula for velocity (n=0.015)
- Calculate flow rate (Q = A × V)
- Check velocity against self-cleansing criteria
- Assume sewer running full
Loses marks
- Using wrong Manning's coefficient
- Not checking self-cleansing velocity
Earns more
- State Manning's formula explicitly
- Show cross-sectional area calculation
Extra mark
- Mention typical self-cleansing velocity range
- (c(i)) Problems in filter operation and control measures. 10 marks
explain— definition/context → points in order → small example → short close
Must cover
- Identify 3-4 operational problems (e.g., clogging, channeling)
- Explain causes of each problem
- Suggest specific control measures
- Link problems to water quality impact
Loses marks
- Listing problems without control measures
- Vague or generic explanations
Earns more
- Mention backwashing frequency
- Discuss filter media selection
Extra mark
- Reference IS code for filter design
- (c(ii)) Factors for intake design and river intake sketch. 5 marks
enumerate— list the items in order → one line each → no commentary
Must cover
- List 3-4 design factors (e.g., flow, sediment, ice)
- Sketch a river intake structure
- Name key components of the intake
- Ensure sketch is labelled
Loses marks
- Unlabelled or incomplete sketch
- Missing critical design factors
Earns more
- Mention screen design
- Discuss approach flow velocity
Extra mark
- Include scale in sketch
Practice this exact question
Write your answer and it is marked point by point against the model answer above — what you covered, what you missed, what you got wrong.
Evaluate my answer →More from Civil Engineering 2025 Paper II
- Q3 (a) (i) Observations were made with a theodolite from the points A and B of baseline AB h…
- Q4 (a) Compare the application of 'straight blade' and 'angle blade' of bulldozers for earth…
- Q5 (a) A box culvert has an expected life of 10 years. (i) If the acceptable risk of at leas…
- Q6 (a) A storm over a catchment of area 5 km² had a duration of 14 hours. The mass curve of…
- Q7 (a) The data related to the activated sludge process is given below: Population = 500000…
- Q8 (a) The figure shows an overflow spillway which is 40 m high. At the design energy head o…