Paper II — Q7
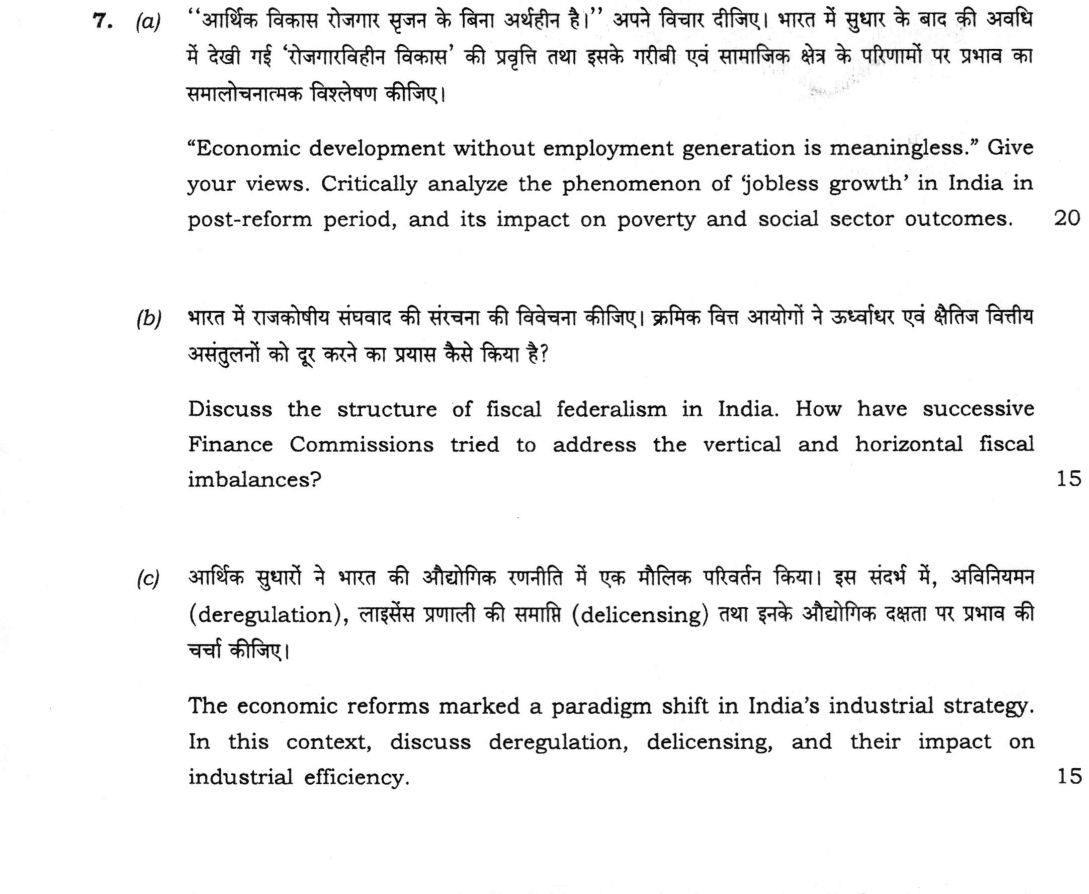
(a) “Economic development without employment generation is meaningless.” Give your views. Critically analyze the phenomenon of…
“Economic development without employment generation is meaningless.” Give your views. Critically analyze the phenomenon of ‘jobless growth’ in India in post-reform period, and its impact on poverty and social sector outcomes. 20 marks
Discuss the structure of fiscal federalism in India. How have successive Finance Commissions tried to address the vertical and horizontal fiscal imbalances? 15 marks
The economic reforms marked a paradigm shift in India’s industrial strategy. In this context, discuss deregulation, delicensing, and their impact on industrial efficiency. 15 marks
हिंदी में प्रश्न पढ़ें
“आर्थिक विकास रोजगार सृजन के बिना अर्थहीन है।” अपने विचार दीजिए। भारत में सुधार के बाद की अवधि में देखी गई ‘रोजगारविहीन संवृद्धि (jobless growth)’ की प्रवृत्ति तथा इसके गरीबी एवं सामाजिक क्षेत्र के परिणामों पर प्रभाव का समालोचनात्मक विश्लेषण कीजिए। (20 अंक)
भारत में राजकोषीय संघवाद की संरचना की विवेचना कीजिए। क्रमिक वित्त आयोगों ने ऊर्ध्वाधर एवं क्षैतिज वित्तीय असंतुलनों को दूर करने का प्रयास कैसे किया है? (15 अंक)
आर्थिक सुधारों ने भारत की औद्योगिक रणनीति में एक मौलिक परिवर्तन किया। इस संदर्भ में, अविनियमन (deregulation), लाइसेंस प्रणाली की समाप्ति (delicensing) तथा इनके औद्योगिक दक्षता पर प्रभाव की चर्चा कीजिए। (15 अंक)
Model answer
Drafted with AI by UPSC Answer Check against this question's marking rubric, to the expected length. UPSC does not publish answers for Mains — this is one way to score well, not an official key. How we build rubrics and answers.
(a) Jobless growth in post-reform India (20 marks)
The proposition that development without employment is meaningless is fundamentally sound. In Amartya Sen's capability approach, work is a capability giving agency and dignity, not just income; the UNDP Human Development Report 1996 listed "jobless growth" among the forms of bad growth.
After the reforms, the employment elasticity of output fell. Between the NSS 61st (2004-05) and 66th (2009-10) rounds employment growth was near zero, and the first Periodic Labour Force Survey (2017-18) recorded 6.1 per cent unemployment. Structurally, premature deindustrialisation kept manufacturing at about 15-17 per cent of GVA, growth was led by skill-intensive services such as IT and finance with a small employment footprint, and the "missing middle" of dwarf firms limited formal job creation.
Yet the charge needs refining. Poverty fell sharply: the Tendulkar head count dropped from about 45 per cent (1993-94) to 21.9 per cent (2011-12). Since 2019 PLFS shows participation rising and unemployment falling to 3.2 per cent in 2023-24, with female participation up from 23.3 to 41.7 per cent. Growth has therefore been job-poor and wage-poor rather than strictly jobless.
The social-sector cost is real. Informal work lacks employer-provided social security, so households depend on the State; public health spending is about 2 per cent of GDP against the 2.5 per cent target of the National Health Policy 2017, and education about 3 per cent against the 6 per cent target (Kothari Commission, NEP 2020), keeping out-of-pocket health costs high. The response is a transfer-and-insurance architecture: MGNREGA (now succeeded by the VB-G RAM G Act, 2025), the National Food Security Act, 2013, PM-KISAN, Ayushman Bharat (2018), and the Code on Social Security, 2020, in force with the other labour codes from 21 November 2025, alongside e-Shram. The durable answer is labour-intensive manufacturing, firm growth and higher female participation.
(b) Fiscal federalism and the Finance Commissions (15 marks)
Fiscal federalism in India rests on the Seventh Schedule, which assigns taxes to the Union and State Lists (the Concurrent List has no tax entry), and on the transfer provisions of Articles 268-270, 275, 280, 282 and 293. Since 2017 the GST Council (Article 279A), where the Centre has one-third and the States two-thirds of the votes and decisions need a three-fourths majority, coordinates indirect taxation.
Vertical imbalance arises because the Union has the buoyant tax bases while States carry larger expenditure responsibilities. Finance Commissions correct it by sharing a single divisible pool of Union taxes, created by the Eightieth Amendment on the Tenth Commission's advice. The States' share rose from 29.5 per cent (Eleventh) to 30.5 (Twelfth), 32 (Thirteenth) and 42 (Fourteenth), was set at 41 per cent by the Fifteenth, and has been retained at 41 per cent for 2026-31 by the Sixteenth Commission (Arvind Panagariya).
Horizontal imbalance, the difference in capacity and need among States, is handled by formula. The Fourteenth Commission used income distance (50), 1971 population (17.5), area (15), 2011 population (10) and forest cover (7.5). The Fifteenth used income distance (45), 2011 population (15), area (15), forest and ecology (10), demographic performance (12.5) and tax effort (2.5), rewarding States that reduced fertility. The Sixteenth weights income distance at 42.5, population 17.5, demographic performance, area and forest each 10, and adds contribution to GDP (10). Revenue deficit grants (Article 275) and local body grants (Article 280(3)(bb) and (c)) top up the formula. Cesses and surcharges outside the divisible pool, however, reduce effective devolution below the headline share.
(c) Deregulation, delicensing and industrial efficiency (15 marks)
The 1991 reforms moved India's industrial strategy from state control to market orientation, chiefly through delicensing and deregulation, which dismantled the "Licence Raj".
Delicensing: the New Industrial Policy of 24 July 1991 cut the industries needing a licence under the Industries (Development and Regulation) Act, 1951 to 18, and the public sector reserved list from 17 to 8. Deregulation: MRTP pre-entry scrutiny was removed (later replaced by the Competition Act, 2002), the Controller of Capital Issues was abolished in 1992, items reserved for small industry were de-reserved between 1997 and 2015, import quantitative restrictions ended by 2001 and tariffs fell, and independent regulators such as TRAI (1997) were created.
Impact on efficiency was substantial but bounded. Allocative efficiency improved as capital moved to higher-return uses and rent-seeking declined; technical or X-efficiency (Leibenstein) rose as import and domestic competition disciplined firms; and dynamic efficiency gained from cheaper imported inputs and technology. But product markets were freed long before factor markets. With no effective exit route until the Insolvency and Bankruptcy Code, 2016, stressed assets piled up into the twin balance sheet problem; labour laws were consolidated only in the four labour codes in force from 21 November 2025; and threshold-linked concessions kept firms small, sustaining the "missing middle". Manufacturing has therefore stayed around 15-17 per cent of GVA: the reforms raised efficiency within firms more than they transformed industrial structure.
How this answer will be evaluated
Evaluation rubric
Each sub-part is marked on its own, against the marks and word limit printed on the paper.
- (a) Three tasks: (i) give a reasoned view on the proposition that development without employment generation is meaningless; (ii) critically analyse the phenomenon of jobless growth in post-reform India, testing the claim against evidence; (iii) discuss its impact on poverty and on social sector outcomes. All three must appear. 20 marks
Must cover
- Amartya Sen's capability approach; UNDP Human Development Report 1996 on 'jobless growth'
- falling employment elasticity; near-zero employment growth between the NSS 61st (2004-05) and 66th (2009-10) rounds
- PLFS from 2017-18: 6.1 per cent unemployment in 2017-18, then falling unemployment and rising participation
- premature deindustrialisation; the 'missing middle' of dwarf firms; informality
- Tendulkar head count: about 45 per cent (1993-94) to 21.9 per cent (2011-12)
- social sector: public health about 2 per cent of GDP (NHP 2017 target 2.5); education about 3 per cent (6 per cent target, Kothari / NEP 2020)
- transfer-and-insurance response (MGNREGA, now VB-G RAM G; NFSA 2013; Ayushman Bharat; Code on Social Security) and the job-poor rather than jobless counterargument
Loses marks
- Asserting jobless growth without any evidence on employment elasticity or survey data - the question says 'critically analyse', which requires testing the claim.
- Omitting the counterargument entirely; a strong answer notes that open unemployment has been low and that participation has risen since 2019, and refines the charge to job-poor growth.
- Ignoring the third directive - the impact on poverty and social sector outcomes - which carries a large share of the marks.
- Confusing the unemployment rate with the labour force participation rate or the worker population ratio, or comparing PLFS figures directly with older NSS rounds without noting the change in survey design.
- Treating poverty reduction and employment growth as the same thing; the point is precisely that poverty fell while employment intensity did not rise.
- Quoting outdated PLFS numbers as current without stating the reference year.
Earns more
- The structural causes: growth led by capital-intensive and skill-intensive sectors, above all information technology and finance, with a small direct employment footprint; premature deindustrialisation, with manufacturing's share of value added stagnating around 15-17 per cent so that the labour-absorbing factory stage was largely skipped; the 'missing middle' and the dominance of dwarf firms that never grow to a size where they create formal jobs, documented in the Economic Survey; factor price distortions and rigidities that raise the effective cost of formal labour relative to capital; pervasive informality, with the great majority of workers outside formal contracts and social security; skill mismatch and low employability; and low female labour force participation by international standards, though it has risen sharply in PLFS since 2017-18.
- Impact on social sector outcomes: employment without formal contracts means employment without employer-provided social security, so health, pension and maternity coverage depend on the State; public expenditure on health has remained around 2 per cent of GDP against the National Health Policy 2017 target of 2.5 per cent, and on education around 3 per cent against the 6 per cent recommended by the Kothari Commission and reiterated in the National Education Policy 2020, so out-of-pocket health spending remains high and learning outcomes weak; nutrition indicators in the National Family Health Survey show persistent stunting and anaemia; and the policy response has been to build a transfer-and-insurance architecture - Ayushman Bharat from 2018, the Code on Social Security, 2020 and the e-Shram register of unorganised workers - rather than to rely on employment-linked entitlements.
- The critical counterpoint and the policy agenda: 'jobless' is arguably a misdescription - employment in absolute numbers did grow, open unemployment has historically been low, part of the fall in participation reflects rising school and college enrolment and an income effect on rural women's work, and the PLFS since 2019 shows participation and worker population ratios rising and the unemployment rate falling; the accurate charge is therefore job-poor and wage-poor growth - a problem of underemployment, informality, stagnant real wages and very high youth and educated unemployment rather than of open joblessness; the agenda that follows is labour-intensive manufacturing and exports, firm growth rather than firm protection, skilling, care infrastructure and female participation, and employment-linked incentives.
Extra mark
- Tendulkar head count of 37.2 per cent in 2004-05
- PLFS 2023-24: unemployment 3.2 per cent; female labour force participation 41.7 per cent
- e-Shram register; four labour codes in force from 21 November 2025
- PM-KISAN
- (b) Two tasks: (i) discuss the structure of fiscal federalism in India - the constitutional assignment of taxes and expenditures and the transfer machinery; (ii) explain how successive Finance Commissions have addressed vertical imbalance (between the Union and the States as a whole) and horizontal imbalance (among the States). 15 marks
Must cover
- Seventh Schedule; Articles 268-270, 275, 280, 282, 293 and 279A
- GST Council (Article 279A): Union one-third, States two-thirds, three-fourths majority
- vertical imbalance and horizontal imbalance, each defined
- Eightieth Amendment: single divisible pool (Tenth Finance Commission)
- devolution share: 29.5 (Eleventh), 30.5 (Twelfth), 32 (Thirteenth), 42 (Fourteenth), 41 (Fifteenth); 41 retained by the Sixteenth for 2026-31
- horizontal criteria of the Fourteenth and Fifteenth Commissions (income distance, population, area, forest, demographic performance, tax effort)
- cesses and surcharges outside the divisible pool
Loses marks
- Describing the Finance Commission's work without ever distinguishing vertical from horizontal imbalance, which is the explicit demand.
- Misstating the devolution shares - the Fourteenth Commission raised the share to 42 per cent and the Fifteenth set it at 41 per cent; other figures are wrong.
- Confusing the Finance Commission with the Planning Commission or NITI Aayog, or attributing plan transfers to the Finance Commission.
- Getting the horizontal criteria weights wrong or mixing the Fourteenth and Fifteenth Commissions' formulas.
- Omitting the cesses and surcharges issue, which is the single most important reason effective devolution falls short of the headline share.
- Saying the Finance Commission is constituted 'every year' or that its recommendations are binding; they are quinquennial and, by convention, accepted on the tax devolution component.
Earns more
- How Finance Commissions address horizontal imbalance: the inter se distribution among States uses a formula combining equity and need indicators, the dominant one being income distance, which transfers more to States with lower per capita income; the Fourteenth Commission used income distance (50 per cent), area (15 per cent), 1971 population (17.5 per cent), demographic change measured by 2011 population (10 per cent) and forest cover (7.5 per cent); the Fifteenth Commission used income distance (45 per cent), population of 2011 (15 per cent), area (15 per cent), forest and ecology (10 per cent), demographic performance (12.5 per cent) and tax and fiscal effort (2.5 per cent) - the switch to 2011 population being offset by a demographic performance criterion designed to avoid penalising States that had successfully reduced fertility; post-devolution revenue deficit grants under Article 275, together with local body, disaster management, sector-specific and State-specific grants, top up the formula for States whose assessed needs still exceed their post-devolution resources.
- Other channels and unresolved issues: with the abolition of the Planning Commission, plan grants ended and NITI Aayog transfers no funds, so Finance Commission awards and centrally sponsored schemes under Article 282 are the two main routes, the latter criticised for conditionality, matching-share burdens and intrusion into State subjects; GST subsumed most indirect taxes and shifted rate-setting to the GST Council, reducing State tax autonomy in exchange for a five-year compensation guarantee that ended in 2022; the most-cited problem is that cesses and surcharges are not shareable under Article 270, so their growing share of gross tax revenue reduces effective devolution well below the headline 41 per cent; States also face borrowing limits under Article 293(3), off-budget liabilities and rising committed expenditure, and Centre-State fiscal relations have been examined by the Sarkaria Commission (1988) and the Punchhi Commission (2010).
Extra mark
- Sixteenth Finance Commission criteria: income distance 42.5, population 17.5, demographic performance 10, area 10, forest and ecology 10, contribution to GDP 10
- revenue deficit grants (Article 275); local body grants (Article 280(3)(bb) and (c))
- Sarkaria Commission (1988) and Punchhi Commission (2010)
- Y. V. Reddy (Fourteenth) and N. K. Singh (Fifteenth) as chairmen
- (c) Discuss two specific components of the post-1991 industrial strategy - deregulation and delicensing - and analyse their impact on industrial efficiency. The answer must define each component concretely and then assess efficiency in its allocative, technical and dynamic senses, with evidence. 15 marks
Must cover
- New Industrial Policy, 24 July 1991 - delicensing except 18 industries under the IDRA, 1951; public sector reserved list cut from 17 to 8
- removal of MRTP pre-entry scrutiny; Competition Act, 2002
- abolition of the Controller of Capital Issues (1992); de-reservation of small-scale items 1997-2015; removal of quantitative restrictions by 2001
- allocative, technical (X-efficiency, Leibenstein) and dynamic efficiency
- factor-market and exit constraints: IBC 2016; four labour codes (in force from 21 November 2025); the twin balance sheet problem
- manufacturing stuck around 15-17 per cent of GVA; the 'missing middle'
Loses marks
- Describing the 1991 reforms generally instead of focusing on deregulation and delicensing and their efficiency consequences.
- Treating 'efficiency' as a single undefined idea; distinguishing allocative, technical and dynamic efficiency is what lifts the answer.
- Claiming licensing was abolished entirely in 1991; a short negative list remained and still exists.
- Providing no evidence at all - assertions that productivity rose, without reference to capacity utilisation, import competition, input-tariff studies or the TFP debate, score poorly.
- Ignoring the incompleteness of factor market and exit reform, which is the principal reason the gains were bounded.
- Confusing de-reservation of small-scale items with the reduction of the public sector reserved list; they are different exercises.
Earns more
- Where the efficiency gains were blocked: product markets were deregulated far ahead of factor markets - land acquisition remained slow and contested, labour regulation was left largely untouched until the four labour codes of 2019 and 2020, brought into force only from 21 November 2025, and there was no effective exit mechanism until the Insolvency and Bankruptcy Code, 2016, so unproductive firms were not weeded out and capital stayed locked in them; infrastructure and power shortages, high logistics costs and credit constraints on smaller firms persisted; threshold-linked incentives continued to reward staying small, sustaining the 'missing middle' of dwarf firms; and the deregulated credit boom of 2003-08 without an exit regime produced the twin balance sheet problem of over-leveraged corporates and non-performing bank assets.
- Verdict and unfinished agenda: the reforms decisively improved efficiency within existing firms and industries but did not produce the structural shift into labour-intensive manufacturing that was expected, manufacturing's share of gross value added remaining around 15-17 per cent; the continuing agenda is regulatory simplification and decriminalisation of business law, single-window clearance, factor market reform, and lowering the compliance burden that falls disproportionately on smaller firms - a theme the Economic Survey has itself taken up in recent years under the heading of deregulation.
Extra mark
- independent regulators - TRAI (1997), IRDA Act 1999, Electricity Act 2003
- productivity gains from input tariff liberalisation and imported input variety
- FEMA, 1999; SEBI Act, 1992
- New Public Sector Enterprise Policy, 2021
What "Analyse" is asking you to do
Break the subject into its working parts and show how they act on each other. The marks are in the interconnections — which factor drives which, and what the resulting structure explains — not in the inventory of factors.
Structure that answers it
Define the whole → separate it into its parts → show which part drives which → what that interaction produces → what the structure implies
Where marks are lost
A flat list of causes with no account of which drives which. An answer of neatly separated headings, each self-contained, scores as description.
Practice this exact question
Write your answer and it is marked point by point against the model answer above — what you covered, what you missed, what you got wrong.
Evaluate my answer →More from Economics 2026 Paper II
- Q4 (a) Trace the evolution of the debate between the public and private sectors in India's i…
- Q5 Answer the following questions in about 150 words each : (a) Analyze the impact of the TR…
- Q6 (a) Critically examine the impact of the New Economic Policy on the Indian corporate sect…
- Q7 (a) “Economic development without employment generation is meaningless.” Give your views.…
- Q8 (a) Explain the Intellectual Property Rights (IPR) regime under the WTO. Discuss the spec…