Paper II — Q7
(a) Explain the factors that contribute to droughts in India with specific reference to food production, distribution and…
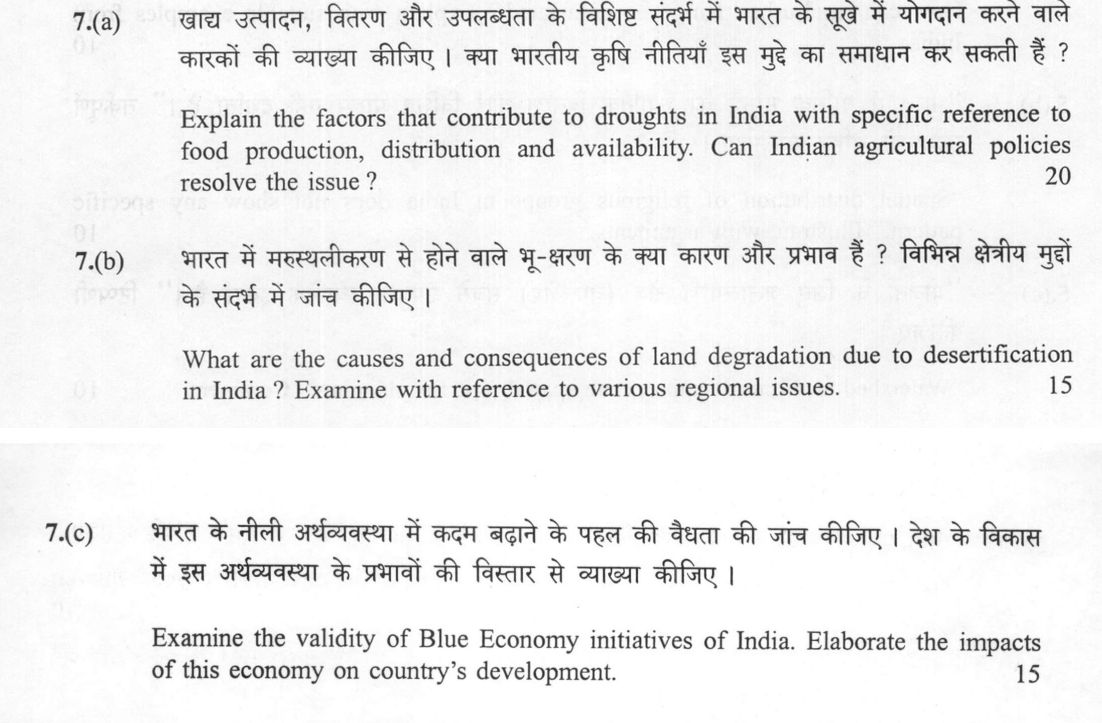
Explain the factors that contribute to droughts in India with specific reference to food production, distribution and availability. Can Indian agricultural policies resolve the issue ? 20 marks
What are the causes and consequences of land degradation due to desertification in India ? Examine with reference to various regional issues. 15 marks
Examine the validity of Blue Economy initiatives of India. Elaborate the impacts of this economy on country's development. 15 marks
हिंदी में प्रश्न पढ़ें
खाद्य उत्पादन, वितरण और उपलब्धता के विशिष्ट संदर्भ में भारत के सूखे में योगदान करने वाले कारकों की व्याख्या कीजिए । क्या भारतीय कृषि नीतियाँ इस मुद्दे का समाधान कर सकती हैं ? 20 marks
भारत में मरुस्थलीकरण से होने वाले भू-क्षरण के क्या कारण और प्रभाव हैं ? विभिन्न क्षेत्रीय मुद्दों के संदर्भ में जाँच कीजिए । 15
भारत के नीली अर्थव्यवस्था में कदम बढ़ाने के पहल की वैधता की जांच कीजिए । देश के विकास में इस अर्थव्यवस्था के प्रभावों की विस्तार से व्याख्या कीजिए । 15
Model answer
Written by UPSC Answer Check against this question's marking rubric, to the expected length. UPSC does not publish answers for Mains — this is one way to score well, not an official key.
Drought and food security. Drought in India is not merely a rainfall event; it is a cascade from meteorological deficit to hydrological stress and agricultural failure. A map would show drought-prone zones in Rajasthan, Maharashtra, Karnataka and Odisha. Meteorological drought arises from monsoon variability, El Niño years that often weaken convective rainfall, and negative Indian Ocean Dipole phases associated with deficient rainfall, while positive IOD can offset some El Niño effects. Hydrological drought follows when reservoirs and groundwater are depleted, and agricultural drought appears when soil moisture and crop water availability fall below requirements. A weak monsoon therefore converts a meteorological shock into a food-security crisis. This directly reduces food production through yield decline, crop failure, fodder shortage and livestock loss. It also strains distribution: FCI buffer stocks face pressure, PDS supply chains become uneven, and storage and transport gaps widen. Availability is affected by price volatility, reduced purchasing power and poorer nutritional access among small farmers and landless labourers. Indian agricultural policies cannot fully resolve the issue by themselves. MGNREGA provides wage support and can build water assets, but its impact is limited unless tied to watershed planning. PMFBY reduces risk, yet weather-based triggers and delayed indemnity weaken protection. PMKSY can improve irrigation, but if it deepens groundwater extraction it may worsen long-term vulnerability. MSP and input subsidies support income, but they can encourage water-intensive crops and inefficient water use. A durable answer requires drought-proofing: watershed development, crop diversification, micro-irrigation, water pricing, better crop insurance and market reforms.
Desertification and regional issues. Desertification is land degradation in arid, semi-arid and dry sub-humid areas, driven by climate aridity, rainfall variability and human pressure. Overgrazing, deforestation, over-cultivation and unsustainable irrigation remove vegetation, expose soil and accelerate erosion. Consequences include soil fertility loss, reduced productivity, biodiversity decline, water scarcity, poverty, forced migration and reduced carrying capacity. Regionally, a map would show the Thar Desert expanding in Rajasthan due to low rainfall, overgrazing and vegetation loss. In the Chambal and Yamuna basins, ravine degradation is severe where runoff, deforestation and over-cultivation cut the dry sub-humid landscape; seasonal streams cut deep gullies, making plots unusable. In Punjab and Haryana, over-irrigation and poor drainage cause salinization and waterlogging. Lateritic degradation in Karnataka and Kerala is a related land-degradation issue; in dry sub-humid laterite tracts it reinforces desertification-like losses, while in humid Western Ghats fringes it is better treated as land degradation rather than desertification.
Blue Economy validity and development impacts. India’s Blue Economy is valid because the country has a long coastline, a large EEZ, fisheries, ports and seabed resources. A map would show port clusters along the east and west coasts. SAGAR policy, Sagarmala, O-SMART and the Deep Ocean Mission aim to link aquaculture, port-led development, marine research and deep-sea exploration. PMMSY can strengthen fisheries and aquaculture, while the Deep Ocean Mission targets seabed minerals. Sagarmala can lower logistics costs and create port-city clusters. Their economic impacts can be significant: higher fisheries and aquaculture output, better ports and logistics, marine manufacturing, and, under the Deep Ocean Mission, exploration of polymetallic nodules and non-fuel seabed minerals. Socially, they can create coastal employment, strengthen food security and improve livelihoods. However, environmental trade-offs are real: coastal erosion, marine pollution, habitat loss, overfishing and conflicts over space. Climate resilience can be enhanced through mangroves and blue carbon, but only if coastal regulation is enforced and fishing communities participate. The validity of the Blue Economy therefore depends on implementation: it is a development pathway if it balances growth with ecological limits, community rights and integrated land-ocean governance.
What "Explain" is asking you to do
Make the working of something clear — what sets it off, what follows from what, and what it produces. Explain is the Commission's mechanism word: it dominates the technical papers and the “explain why” stems, where the marks sit in the causal chain and not in the label.
Structure that answers it
State what it is → the initiating condition → the chain of cause, step by step → an instance where it plays out → what the chain produces
Where marks are lost
Describing what something looks like instead of why it works that way. Naming the stages without linking them reads as description too.
How this answer will be evaluated
Approach
Framework: Concept or mechanism > Diagram > Regional example > Application. (a) explain: definition/context > points in order > small example > short close | (b) examine: intro > how/why with reasoning > evidence > conclusion | (c) examine: intro > how/why with reasoning > evidence > conclusion Full marks: Precise causal chains, specific policy names, labelled diagrams, and balanced regional examples.
Key points expected
- Monsoon variability and ENSO/La Niña impact on production
- Deficit in food distribution and PDS coverage
- Specific agricultural policies (e.g., MSP, PM-KISAN, PMFBY)
- Diagram linking physical cause to food security
- Causes: Overgrazing, deforestation, over-exploitation of water
- Consequences: Loss of arable land, soil salinity, migration
- Regional issues: Thar (Rajasthan), Rann of Kutch (Gujarat)
- Link between physical degradation and socio-economic impact
Evaluation rubric
Each sub-part is marked on its own, against the marks and word limit printed on the paper.
- (a) Causal chain of drought factors (production, distribution, availability) and policy evaluation. 20 marks
explain— definition/context → points in order → small example → short close
Must cover
- Monsoon variability and ENSO/La Niña impact on production
- Deficit in food distribution and PDS coverage
- Specific agricultural policies (e.g., MSP, PM-KISAN, PMFBY)
- Diagram linking physical cause to food security
Loses marks
- Generic description without specific policy names
- Ignoring the 'distribution' and 'availability' aspects
- No diagram or map provided
Earns more
- Reference to specific drought-prone regions (e.g., Vidarbha, Marathwada)
- Mention of PM-Drought Relief Fund (PM-DRF)
- Discussion of water management (PMKSY) as a policy tool
Extra mark
- Recent drought data or specific year (e.g., 2015-16)
- Labelled sketch map of drought-prone zones
- (b) Causes and consequences of desertification with specific regional examples. 15 marks
examine— intro → how/why with reasoning → evidence → conclusion
Must cover
- Causes: Overgrazing, deforestation, over-exploitation of water
- Consequences: Loss of arable land, soil salinity, migration
- Regional issues: Thar (Rajasthan), Rann of Kutch (Gujarat)
- Link between physical degradation and socio-economic impact
Loses marks
- Confusing desertification with general land degradation
- Lack of specific regional examples
- No causal link between cause and consequence
Earns more
- Mention of specific schemes (e.g., Desert Development Programme)
- Reference to specific soil types (e.g., black cotton soil)
- Discussion of wind erosion vs water erosion
Extra mark
- Labelled map of desertification zones in India
- Specific data on land degradation rates
- (c) Validity of Blue Economy initiatives and their impact on development. 15 marks
examine— intro → how/why with reasoning → evidence → conclusion
Must cover
- Definition of Blue Economy (sustainable use of ocean resources)
- Specific initiatives: National Maritime Policy, Blue Flag beaches
- Impact on development: Employment, coastal security, trade
- Balanced judgment on validity (challenges vs benefits)
Loses marks
- Confusing Blue Economy with general marine biology
- Lack of specific policy names or initiatives
- No balanced judgment on validity
Earns more
- Mention of specific coastal states (e.g., Gujarat, Kerala)
- Reference to specific sectors (e.g., aquaculture, offshore wind)
- Discussion of environmental sustainability vs economic growth
Extra mark
- Specific data on Blue Economy contribution to GDP
- Labelled map of key Blue Economy zones
Practice this exact question
Write your answer and it is marked point by point against the model answer above — what you covered, what you missed, what you got wrong.
Evaluate my answer →More from Geography 2025 Paper II
- Q4 (a) "Socio-political landscape in India is a result of regional consciousness creating in…
- Q5 (a) How can rural-urban fringe be delineated ? Explain with suitable examples from India.…
- Q6 (a) Describe the causes of the phenomenon of 'urban heat island'. What are the effective…
- Q7 (a) Explain the factors that contribute to droughts in India with specific reference to f…
- Q8 (a) While defining the green architecture, discuss its principles and challenges in respo…