Paper II — Q1
(a) The mean annual income of workers in a company is ₹ 5,000 with a standard deviation of ₹ 1,200. It is suspected that local…
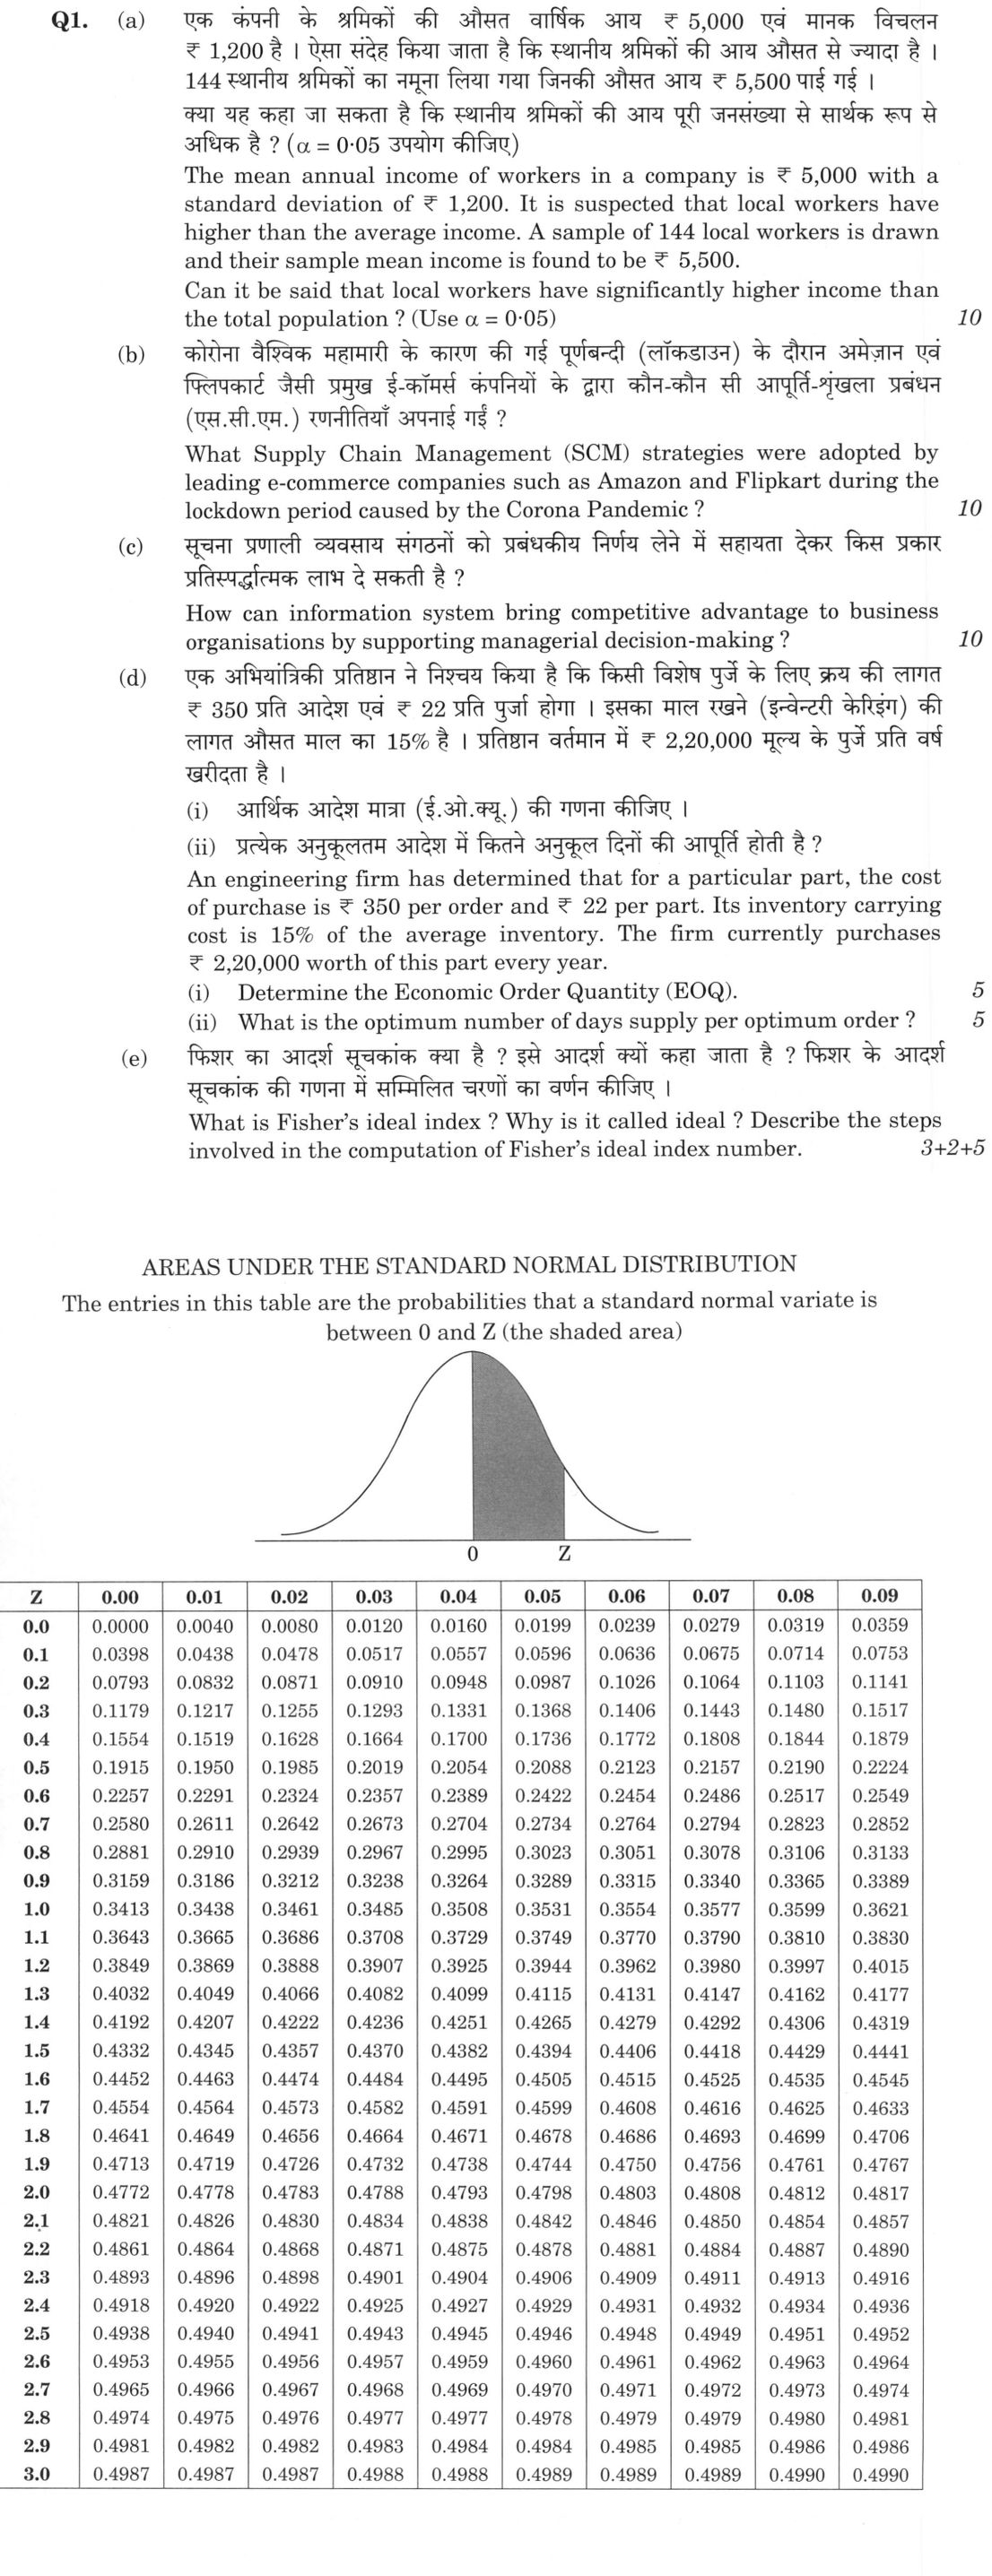
The mean annual income of workers in a company is ₹ 5,000 with a standard deviation of ₹ 1,200. It is suspected that local workers have higher than the average income. A sample of 144 local workers is drawn and their sample mean income is found to be ₹ 5,500. Can it be said that local workers have significantly higher income than the total population ? (Use α = 0·05) 10 marks
What Supply Chain Management (SCM) strategies were adopted by leading e-commerce companies such as Amazon and Flipkart during the lockdown period caused by the Corona Pandemic ? 10 marks
How can information system bring competitive advantage to business organisations by supporting managerial decision-making ? 10 marks
An engineering firm has determined that for a particular part, the cost of purchase is ₹ 350 per order and ₹ 22 per part. Its inventory carrying cost is 15% of the average inventory. The firm currently purchases ₹ 2,20,000 worth of this part every year.
Determine the Economic Order Quantity (EOQ). 5 marks
What is the optimum number of days supply per optimum order ? 5 marks
What is Fisher's ideal index ? Why is it called ideal ? Describe the steps involved in the computation of Fisher's ideal index number. 3+2+5 marks
हिंदी में प्रश्न पढ़ें
एक कंपनी के श्रमिकों की औसत वार्षिक आय ₹ 5,000 एवं मानक विचलन ₹ 1,200 है । ऐसा संदेह किया जाता है कि स्थानीय श्रमिकों की आय औसत से ज्यादा है । 144 स्थानीय श्रमिकों का नमूना लिया गया जिनकी औसत आय ₹ 5,500 पाई गई । क्या यह कहा जा सकता है कि स्थानीय श्रमिकों की आय पूरी जनसंख्या से सार्थक रूप से अधिक है ? (α = 0·05 उपयोग कीजिए) 10 अंक
कोरोना वैश्विक महामारी के कारण की गई पूर्णबंदी (लॉकडाउन) के दौरान अमेज़ान एवं फ्लिपकार्ट जैसी प्रमुख ई-कॉमर्स कंपनियों के द्वारा कौन-कौन सी आपूर्ति-शृंखला प्रबंधन (एस.सी.एम.) रणनीतियाँ अपनाई गईं ? 10 अंक
सूचना प्रणाली व्यवसाय संगठनों को प्रबंधकीय निर्णय लेने में सहायता देकर किस प्रकार प्रतिस्पर्धात्मक लाभ दे सकती है ? 10 अंक
एक अभियांत्रिकी प्रतिष्ठान ने निश्चय किया है कि किसी विशेष पुर्जे के लिए क्रय की लागत ₹ 350 प्रति आदेश एवं ₹ 22 प्रति पुर्जा होगी । इसका माल रखने (इन्वेंटरी कैरिंग) की लागत औसत माल का 15% है । प्रतिष्ठान वर्तमान में ₹ 2,20,000 मूल्य के पुर्जे प्रति वर्ष खरीदता है ।
आर्थिक आदेश मात्रा (ई.ओ.क्यू.) की गणना कीजिए । 5 अंक
प्रत्येक अनुकूलतम आदेश में कितने अनुकूल दिनों की आपूर्ति होती है ? 5 अंक
फिशर का आदर्श सूचकांक क्या है ? इसे आदर्श क्यों कहा जाता है ? फिशर के आदर्श सूचकांक की गणना में सम्मिलित चरणों का वर्णन कीजिए । 3+2+5 अंक
Model answer
Written by UPSC Answer Check against this question's marking rubric, to the expected length. UPSC does not publish answers for Mains — this is one way to score well, not an official key.
(a) Let μ be the mean annual income of all workers. Since it is suspected that local workers have higher than average income, the test is right-tailed: H₀: μ = ₹5,000 H₁: μ > ₹5,000 Use the one-sample Z-test for mean, because σ is known and n = 144 is large. Standard error: SE = σ/√n = 1200/√144 = 1200/12 = ₹100. Test statistic: Z = (x̄ − μ)/SE = (5500 − 5000)/100 = 500/100 = 5. At α = 0.05, the one-tailed critical value is z₀.₀₅ = 1.645. Since Z = 5 > 1.645, reject H₀. Equivalently, p-value = P(Z ≥ 5) ≈ 2.87 × 10⁻⁷ < 0.05. Therefore, there is significant evidence that local workers have higher mean annual income than the total population. Conditions: random and independent sample, known population standard deviation, and normal population or large sample by the Central Limit Theorem. Final: Yes, local workers have significantly higher income than the total population (Z = 5, p < 0.05).
(b) During the Covid-19 lockdowns, e-commerce supply chains shifted from efficiency-first to resilience-and-essentials-first. Amazon, Flipkart and similar firms adopted these SCM strategies:
- Demand prioritisation and assortment rationalisation: focused on groceries, medicines, health, hygiene and household essentials; paused non-essential categories; used AI/ML for surge demand forecasting and stock allocation.
- Supplier and sourcing resilience: diversified vendors, onboarded local kirana stores, farmers, MSMEs and regional sellers; adopted direct farm sourcing; maintained buffer stocks for critical SKUs; developed alternative suppliers.
- Inventory and network redesign: expanded dark stores, micro-fulfilment centres, hyperlocal hubs and forward stocking near demand; repositioned inventory across fulfilment centres; added temporary fulfilment nodes.
- Logistics and last-mile: adopted contactless delivery, sanitised packaging, QR/OTP verification, route optimisation, Amazon Flex and Flipkart eKart, gig workforce, and partnerships with local transporters; used air/rail/road priority for essentials.
- Technology and visibility: used control towers, real-time tracking, demand sensing, digital payments, virtual customer support and data analytics to reduce stockouts and improve delivery ETAs.
- Safety and workforce: implemented PPE, thermal screening, social distancing, staggered shifts, paid leave, hiring of additional workers and safety audits.
- Collaboration: worked with governments for movement passes, health/pharma supply, NGOs and local authorities. Amazon prioritised Amazon Fresh and Prime Now, household and health products, hired workers, raised wages, expanded Flex and fulfilment capacity, and used technology for demand forecasting. Flipkart prioritised essentials, medicines and groceries; expanded Flipkart Quick, hyperlocal delivery, kirana partnerships and Flipkart Wholesale; used eKart for contactless delivery and direct sourcing from farmers. Final: The key SCM strategies were essentials prioritisation, local sourcing, hyperlocal fulfilment, resilient logistics, digital visibility, safety protocols and government collaboration.
(c) Information systems bring competitive advantage by improving the speed, quality and scope of managerial decisions. They collect, process, store, retrieve and distribute data; convert it into information and knowledge for planning, organising, controlling and leading. At the operational level, TPS and real-time inventory/POS systems automate transactions and trigger reorders. At the tactical level, MIS, DSS, ERP, SCM and CRM support budgeting, forecasting, scheduling, procurement, pricing and resource allocation. At the strategic level, EIS, BI, data mining and AI/ML support scenario analysis, what-if modelling, market intelligence and strategy formulation. Competitive advantage arises through:
- Cost leadership: JIT, inventory reduction, automation, efficient logistics and lower transaction costs.
- Differentiation: customisation, faster delivery, better after-sales service and superior customer experience.
- Focus: customer segmentation and personalised offerings for niche markets.
- Innovation: new business models such as e-commerce, fintech and platform ecosystems.
- Decision quality: accurate, timely, relevant and complete information reduces uncertainty and improves responsiveness.
- Coordination and control: ERP/SCM integrate suppliers, factories, warehouses and customers; KPIs and dashboards enable corrective action. Examples include Amazon’s recommendation and fulfilment systems, Walmart’s replenishment, Flipkart’s logistics analytics, banks’ credit scoring and airlines’ yield management. Conditions for success include top-management support, strategic alignment, data quality, cyber security, user training and continuous upgrading. Final: IS supports managerial decision-making at all levels and creates competitive advantage mainly through lower cost, differentiation, speed, innovation and better customer responsiveness.
(d)(i) Annual demand: D = annual purchase value ÷ unit purchase cost = ₹2,20,000 ÷ ₹22 = 10,000 parts per year. Ordering cost: S = ₹350 per order. Unit cost: C = ₹22 per part. Carrying cost rate: i = 15% = 0.15. Carrying cost per unit per year: H = iC = 0.15 × 22 = ₹3.30 per part per year. Use the Economic Order Quantity formula: EOQ = √(2DS/H). Substitute: EOQ = √(2 × 10,000 × 350 / 3.30) = √(7,000,000 / 3.30) = √(2,121,212.1212) ≈ 1,456.44 parts. Final: EOQ ≈ 1,456 parts per order.
(d)(ii) Assuming 365 days per year: Daily demand = D/365 = 10,000/365 = 27.3973 parts per day. Number of days supply per optimum order: = EOQ / daily demand = 1,456.44 / 27.3973 = 53.16 days. Equivalently, number of orders per year = D/EOQ = 10,000/1,456.44 = 6.866; days supply = 365/6.866 = 53.16 days. If a 360-day commercial year is assumed, days supply = 1,456.44 / (10,000/360) = 52.43 days. Final: Optimum days supply per optimum order ≈ 53.16 days, about 53 days, assuming a 365-day operating year.
(e) Fisher’s ideal index is a weighted price or quantity index that is the geometric mean of the Laspeyres and Paasche indices. For price index, let p₀ and q₀ be base-period prices and quantities, and p₁ and q₁ be current-period prices and quantities. Laspeyres price index: L_p = (Σp₁q₀ / Σp₀q₀) × 100. Paasche price index: P_p = (Σp₁q₁ / Σp₀q₁) × 100. Fisher’s ideal price index: F_p = √(L_p × P_p) = √[(Σp₁q₀ / Σp₀q₀) × (Σp₁q₁ / Σp₀q₁)] × 100. For a quantity index, replace p by q in the corresponding positions: L_q = (Σq₁p₀ / Σq₀p₀) × 100, P_q = (Σq₁p₁ / Σq₀p₁) × 100, F_q = √(L_q × P_q). It is called ideal because it satisfies the two important consistency tests: the time reversal test and the factor reversal test. In ratio form, F₀₁ × F₁₀ = 1; when base 100 is used, the product is 10,000. Also, in ratio form, Fisher’s price index × Fisher’s quantity index = value index; with base 100, (F_p × F_q)/100 = value index. It uses both base-period and current-period quantities, so it balances the upward bias of Laspeyres and the downward bias of Paasche. It is symmetric and uses all relevant price and quantity data. It does not generally satisfy the circular test, so “ideal” here means ideal with respect to reversal tests and balanced weighting. Computation steps:
- Identify the base year and current year, and list commodities with p₀, q₀, p₁, q₁.
- Compute p₀q₀, p₁q₀, p₀q₁ and p₁q₁ for each commodity.
- Sum each column: Σp₀q₀, Σp₁q₀, Σp₀q₁ and Σp₁q₁.
- Compute Laspeyres index L_p = (Σp₁q₀ / Σp₀q₀) × 100.
- Compute Paasche index P_p = (Σp₁q₁ / Σp₀q₁) × 100.
- Compute Fisher’s index F_p = √(L_p × P_p), or directly by the formula above.
- Interpret: F_p > 100 means net price rise; F_p < 100 means net price fall; F_p = 100 means no net change. For quantity index, use the analogous q ratios with p weights. Final: Fisher’s ideal index is F = √(Laspeyres × Paasche); it is ideal because it satisfies time and factor reversal tests and balances Laspeyres-Paasche bias.
What "Solve" is asking you to do
Choose the method, then carry it through to a final answer. Identifying what kind of problem this is and why that method applies is the first thing marked; a correct figure arrived at invisibly earns almost nothing.
Structure that answers it
Given data and what is required → method chosen, with the reason it applies → set-up (equation, circuit, free body, trial balance) → working, step by step → answer with units and any condition of validity
Where marks are lost
Doing the middle steps mentally and writing only the result. In mathematics papers, a further loss comes from giving a decimal where the exact value in surds or fractions was wanted, or from skipping the justification a part explicitly asks for.
How this answer will be evaluated
Approach
Framework: null. (a) calculate: given > formula > substitution > result with units > interpretation | (b) discuss: intro > 3-4 dimensions > example > balanced close | (c) explain: definition/context > points in order > small example > short close | (d(i)) calculate: given > formula > substitution > result with units > interpretation | (d(ii)) calculate: given > formula > substitution > result with units > interpretation | (e) describe: define > structure or process in order > labelled diagram > significance Full marks: Accurate calculations with clear steps; specific, relevant examples for theory parts; precise definitions.
Key points expected
- State H0 (μ = 5000) and H1 (μ > 5000)
- Calculate Z-score using formula (X̄ - μ) / (σ/√n)
- Compare calculated Z with critical value at α = 0.05
- State conclusion regarding the null hypothesis
- Identify specific strategies (e.g., dark stores, drone delivery)
- Link strategies to the specific constraints of the lockdown
- Provide examples from Amazon or Flipkart
- Explain the operational impact of these strategies
Evaluation rubric
Each sub-part is marked on its own, against the marks and word limit printed on the paper.
- (a) Perform a one-tailed Z-test to determine if the sample mean is significantly higher than the population mean. 10 marks
calculate— given → formula → substitution → result with units → interpretation
Must cover
- State H0 (μ = 5000) and H1 (μ > 5000)
- Calculate Z-score using formula (X̄ - μ) / (σ/√n)
- Compare calculated Z with critical value at α = 0.05
- State conclusion regarding the null hypothesis
Loses marks
- Using two-tailed critical value for a one-tailed test
- Arithmetic errors in Z-score calculation
Earns more
- Correct calculation of standard error (100)
- Correct Z-value (5.0)
- Reference to the provided Z-table
Extra mark
- Explicit mention of one-tailed vs two-tailed test logic
- (b) Discuss specific SCM strategies adopted by Amazon and Flipkart during the Corona lockdown. 10 marks
discuss— intro → 3-4 dimensions → example → balanced close
Must cover
- Identify specific strategies (e.g., dark stores, drone delivery)
- Link strategies to the specific constraints of the lockdown
- Provide examples from Amazon or Flipkart
- Explain the operational impact of these strategies
Loses marks
- Generic SCM theory without specific company examples
- Confusing pre-pandemic strategies with lockdown-specific ones
Earns more
- Mention of 'last-mile' delivery innovations
- Reference to supply chain resilience measures
- Discussion of workforce safety protocols in logistics
Extra mark
- Specific data on delivery time reduction or cost changes
- (c) Explain how information systems support managerial decision-making to create competitive advantage. 10 marks
explain— definition/context → points in order → small example → short close
Must cover
- Define the link between IS and decision-making
- Explain how IS improves speed or accuracy of decisions
- Connect decision quality to competitive advantage
- Provide a business context or example
Loses marks
- Focusing only on technical hardware without managerial context
- Failing to link decision-making to competitive advantage
Earns more
- Mention of specific IS types (MIS, DSS, EIS)
- Discussion of data analytics in decision support
- Reference to real-time data processing
Extra mark
- Example of a specific company using IS for advantage
- (d(i)) Determine the Economic Order Quantity (EOQ) using the given cost and demand data. 5 marks
calculate— given → formula → substitution → result with units → interpretation
Must cover
- Identify Annual Demand (D) from value and unit cost
- Identify Ordering Cost (Co) and Holding Cost (Ch)
- Apply EOQ formula √(2DCo/Ch)
- State final EOQ value
Loses marks
- Using total annual value (2,20,000) as D instead of units
- Incorrect calculation of holding cost per unit
Earns more
- Correct calculation of D (10,000 units)
- Correct calculation of Ch (3.3)
Extra mark
- Verification of total cost at EOQ
- (d(ii)) Calculate the optimum number of days supply per optimum order. 5 marks
calculate— given → formula → substitution → result with units → interpretation
Must cover
- Use the EOQ calculated in part (i)
- Use the annual demand (D)
- Apply formula (EOQ / D) * 365
- State final number of days
Loses marks
- Using wrong demand figure
- Arithmetic errors in division or multiplication
Earns more
- Correct substitution of values
- Rounding to a reasonable number of days
Extra mark
- Interpretation of what the days supply means for inventory
- (e) Define Fisher's ideal index, explain why it is ideal, and describe the computation steps. 10 marks
describe— define → structure or process in order → labelled diagram → significance
Must cover
- Define Fisher's Ideal Index as geometric mean of Laspeyres and Paasche
- Explain why it is 'ideal' (satisfies time reversal test)
- List steps: calculate L, calculate P, take geometric mean
- Provide the formula for the index
Loses marks
- Confusing Fisher's with simple aggregate index
- Failing to explain the 'ideal' property
Earns more
- Mention of time reversal and factor reversal tests
- Clear distinction between base and current year data
Extra mark
- Brief numerical example of the calculation
Practice this exact question
Write your answer and it is marked point by point against the model answer above — what you covered, what you missed, what you got wrong.
Evaluate my answer →More from Management 2021 Paper II
- Q1 (a) The mean annual income of workers in a company is ₹ 5,000 with a standard deviation o…
- Q2 (a) (i) 'A' can hit a target 4 times in 5 shots, 'B' 3 times in 4 shots and 'C' twice in…
- Q3 (a) (i) What is e-business architecture? Which technological innovations have had a major…
- Q4 (a) (i) How does the balancing line reduce the cost of idleness? Describe the steps invol…