Paper II — Q3
(a) (i) What is e-business architecture? Which technological innovations have had a major impact on it? 5 marks (ii) Describe the…
What is e-business architecture? Which technological innovations have had a major impact on it? 5 marks
Describe the four pillars of e-governance and the various types of interactions performed in e-governance. 5 marks
Discuss the Indian Government's efforts and actions towards implementing e-governance. 5 marks
Solve the following Linear Programming Problem by Graphical Method: 10 marks Minimize cost: C = 5x₁ + 6x₂ subject to: x₁ + x₂ = 1000 x₁ ≤ 300 x₂ ≥ 150 x₁, x₂ ≥ 0
A certain drug is claimed to be effective in curing cold. In an experiment on 500 persons suffering from cold, half of them were given the drug and the other half were given the sugar pills. Patients' reactions to the treatment are recorded in the following table:
| Treatment | Helped | Harmed | No Effect |
|---|---|---|---|
| Drug | 150 | 30 | 70 |
| Sugar pills | 130 | 40 | 80 |
| Total | 280 | 70 | 150 |
On the basis of the above data, can it be concluded that there is a significant difference in the effect of drug and sugar pills? 10 marks
Apply the concept of "Decay Curve of New Product Ideas" to an innovative product like 'e-Bike'. 5 marks
A manufacturing company always uses a sample size of 10. Data for the past 10 samples are as follows:
| Number of Defective Units | Total Units Sampled |
|---|---|
| 150 | 1,000 |
The system is believed to be operating under normal conditions. (A) Construct a control chart with control limits such that measurements for 95% of the units under normal conditions would fall within the control limits. 5 marks (B) Suppose the number of units defective in the next 5 samples are: 3, 4, 2, 0 and 7. Demonstrate graphically whether the process is under control or not. 5 marks
हिंदी में प्रश्न पढ़ें
ई-व्यवसाय वास्तुकला क्या है? किन तकनीकी नवाचारों का इस पर प्रमुख प्रभाव पड़ा है?
ई-शासन के चार स्तम्भों एवं ई-शासन में निष्पादित विभिन्न प्रकार की पारस्परिक-क्रियाओं का वर्णन कीजिए।
ई-शासन के क्रियान्वयन के लिए भारत सरकार के प्रयासों एवं कार्यों की विवेचना कीजिए।
निम्नलिखित रैखिक (लीनियर) प्रोग्रामिंग समस्या को आलेखीय (ग्राफिकल) विधि से हल कीजिए: लागत न्यूनतम करना: C = 5x₁ + 6x₂ लागू शर्तें: x₁ + x₂ = 1000 x₁ ≤ 300 x₂ ≥ 150 x₁, x₂ ≥ 0
एक निश्चित दवा का सर्दी को ठीक करने में प्रभावी होने का दावा किया जाता है। सर्दी-जुकाम से पीड़ित 500 व्यक्तियों पर किए गए प्रयोग में उनमें से आधे को दवा एवं आधे को चीनी की गोलियाँ दी गईं। निम्नलिखित सारणी में रोगी के उपचार की प्रतिक्रियाएँ दर्ज की गई हैं:
| उपचार | मददगार | नुकसानदायक | कोई प्रभाव नहीं |
|---|---|---|---|
| दवा | 150 | 30 | 70 |
| चीनी की गोलियाँ | 130 | 40 | 80 |
| कुल | 280 | 70 | 150 |
उपर्युक्त आँकड़ों के आधार पर क्या यह निष्कर्ष निकाला जा सकता है कि दवा और चीनी की गोलियों के प्रभाव में महत्त्वपूर्ण भिन्नता है?
'ई-बाइक' जैसे नवप्रवर्तक उत्पाद के लिए "नवीन उत्पाद विचारों का क्षय वक्र" संकल्पना को लागू कीजिए।
एक विनिर्माण कंपनी हमेशा 10 का नमूना आकार (सैम्पल साइज़) उपयोग में लेती है। पिछले 10 नमूनों के आँकड़े निम्नलिखित सारणी में दिए गए हैं:
| दोषपूर्ण इकाइयों की संख्या | कुल नमूने की इकाइयाँ |
|---|---|
| 150 | 1,000 |
ऐसा विश्वास है कि यह प्रणाली (सिस्टम) सामान्य परिस्थितियों (शर्तों) में ही संचालित हो रही है। (A) नियंत्रण सीमाओं के साथ एक नियंत्रण चार्ट बनाइए ताकि सामान्य परिस्थितियों (शर्तों) में कुल मापी गई इकाइयों का 95% नियंत्रण सीमाओं के अंदर पाया जाए। (B) मान लीजिए कि अगले 5 नमूनों में दोषपूर्ण इकाइयों की संख्या: 3, 4, 2, 0 एवं 7 है। आलेखीय (ग्राफिकल) रूप से प्रदर्शित कीजिए कि क्या प्रक्रिया नियंत्रण में है अथवा नहीं।
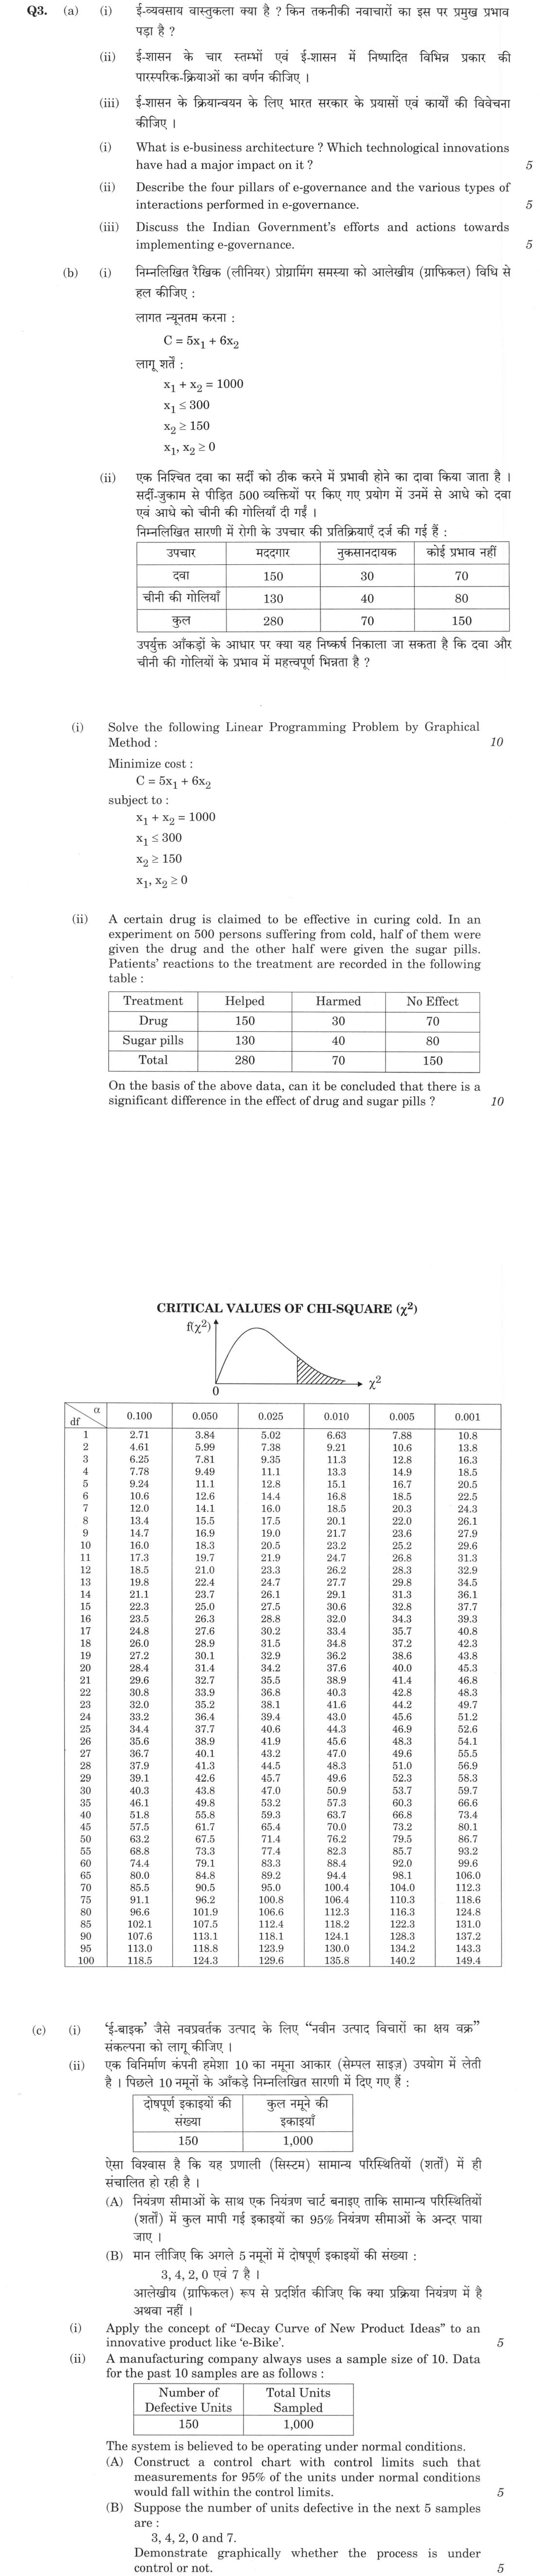
The figure this question refers to, in words
The question paper is a scan and the diagram did not survive as text. This is the figure as read from the original page — every component, value and label — so the question can be worked from the text below.
(c) Table: Number of Defective Units | Total Units Sampled 150 | 1,000
Model answer
Written by UPSC Answer Check against this question's marking rubric, to the expected length. UPSC does not publish answers for Mains — this is one way to score well, not an official key.
(a)(i) e-business architecture is the structured framework of applications, data, networks, processes and standards that enables internet-based buying, selling, servicing and collaboration. Its layers are presentation (web/mobile interface), business logic (ERP, CRM, workflow), data (databases, analytics), integration (APIs, EDI) and infrastructure (servers, cloud, security). Major technological innovations: Internet/Web, mobile and 5G, cloud computing, big data/AI/ML, IoT, blockchain, e-payment/UPI, APIs/microservices, cybersecurity and social media.
(a)(ii) Four pillars of e-governance: Connectivity (telecom, broadband, SWAN), Content (government information and online services), Capability (skills, training, change management), Capital (funding, PPP, sustainability). Interactions: G2C (licences, certificates, pensions), G2B (tax, procurement, GeM), G2G (inter-departmental data), G2E (payroll, HR), and reverse C2G/B2G (feedback, grievances, payments).
(a)(iii) Indian efforts: IT Act 2000; NeGP 2006; Digital India 2015 with e-Kranti; Aadhaar; DigiLocker; UMANG; e-Office; GSTN; GeM; MyGov; Common Service Centres; SWAN; State Data Centres; BharatNet; UPI; National Informatics Centre; MEITY; Digital Personal Data Protection Act 2023. Challenges: digital divide, interoperability, cybersecurity, privacy and rural connectivity.
(b)(i) Graphical Method. Constraints: x₁ + x₂ = 1000, x₁ ≤ 300, x₂ ≥ 150, x₁,x₂ ≥ 0. The equality line meets x₁ = 300 at (300,700); meets x₁ = 0 at (0,1000). The condition x₂ ≥ 150 is automatically satisfied on this segment because x₂ = 1000 − x₁ ≥ 700. Hence feasible region is the segment from (0,1000) to (300,700). Objective: C = 5x₁ + 6x₂ = 5x₁ + 6(1000 − x₁) = 6000 − x₁. To minimize C, maximize x₁. Maximum feasible x₁ = 300. Thus x₂ = 700. C = 5(300) + 6(700) = 1500 + 4200 = 5700. Optimum: x₁ = 300, x₂ = 700, minimum cost = 5700.
(b)(ii) Use χ² test of homogeneity/independence. H₀: drug and sugar pills have same effect. H₁: significant difference. Expected frequency E = row total × column total / grand total. Drug: Helped 250×280/500 = 140; Harmed 250×70/500 = 35; No effect 250×150/500 = 75. Sugar: same expected values 140, 35, 75. χ² = Σ(O−E)²/E = (150−140)²/140 + (30−35)²/35 + (70−75)²/75 + (130−140)²/140 + (40−35)²/35 + (80−75)²/75 = 100/140 + 25/35 + 25/75 + 100/140 + 25/35 + 25/75 = 20/7 + 2/3 = (60+14)/21 = 74/21 = 3.524. df = (2−1)(3−1) = 2. At 5% significance, χ²₀.₀₅,₂ = 5.991. Since 3.524 < 5.991, do not reject H₀. No significant difference in effect of drug and sugar pills.
(c)(i) Decay curve of new product ideas: many raw ideas enter; only a few survive screening, concept testing, business analysis, development, test marketing and commercialisation. For e-Bike: initial ideas may include battery-swap, solar charging, regenerative braking, IoT anti-theft, subscription model. Screening removes high-cost/low-demand ideas; development removes weak battery/range/safety ideas; test marketing removes poor charging-infrastructure or price-acceptance ideas. Thus the idea pool decays sharply before launch, leaving only technically feasible, economical and market-acceptable e-Bike variants.
(c)(ii)(A) Using the table, the ten past samples total 1,000 units, so the effective sample size is n = 100. Using past data: p̄ = 150/1000 = 0.15. For an np-chart, CL = np̄ = 100×0.15 = 15. σ = √(np̄(1−p̄)) = √(100×0.15×0.85) = √12.75 = 3.5707. For 95% limits, z = 1.96. UCL = 15 + 1.96×3.5707 = 21.9986 ≈ 22.00. LCL = 15 − 6.9986 = 8.0014 ≈ 8.00. Valid as np̄ and n(1−p̄) > 5. Chart: CL = 15, UCL = 22.00, LCL = 8.00 defectives per sample.
(c)(ii)(B) Next defectives: 3, 4, 2, 0, 7. Plot sample numbers 11–15 on x-axis and defectives on y-axis against CL = 15, UCL = 22.00, LCL = 8.00. All five points lie below LCL = 8.00. Hence the process is not under control; an assignable cause is present. If the printed n = 10 is taken literally, the table is internally inconsistent; using n = 10 would give CL = 1.5, UCL = 3.71, LCL = 0, and samples 4 and 7 exceed UCL, so the same conclusion follows.
What "Solve" is asking you to do
Choose the method, then carry it through to a final answer. Identifying what kind of problem this is and why that method applies is the first thing marked; a correct figure arrived at invisibly earns almost nothing.
Structure that answers it
Given data and what is required → method chosen, with the reason it applies → set-up (equation, circuit, free body, trial balance) → working, step by step → answer with units and any condition of validity
Where marks are lost
Doing the middle steps mentally and writing only the result. In mathematics papers, a further loss comes from giving a decimal where the exact value in surds or fractions was wanted, or from skipping the justification a part explicitly asks for.
How this answer will be evaluated
Approach
Framework: Graphical Method for LPP; Chi-Square Test of Independence; p-Chart for Statistical Process Control. (a(i)) explain: definition/context > points in order > small example > short close | (a(ii)) describe: define > structure or process in order > labelled diagram > significance | (a(iii)) discuss: intro > 3-4 dimensions > example > balanced close | (b(i)) calculate: given > formula > substitution > result with units > interpretation | (b(ii)) calculate: given > formula > substitution > result with units > interpretation | (c(i)) explain: definition/context > points in order > small example > short close | (c(ii)(a)) calculate: given > formula > substitution > result with units > interpretation | (c(ii)(b)) analyse: intro > causes > effects > stakeholders/linkages > way forward Full marks: Comprehensive, accurate, and well-structured answers with clear application of frameworks and correct calculations.
Key points expected
- Precise definition of e-business architecture
- Identification of at least three technological innovations
- Explanation of how these innovations impact the architecture
- Logical connection between technology and business structure
- Identification of the four pillars (e.g., infrastructure, policy, etc.)
- Description of G2C, G2B, G2G, G2E interactions
- Clear distinction between the types of interactions
- Brief explanation of the significance of each pillar
Evaluation rubric
Each sub-part is marked on its own, against the marks and word limit printed on the paper.
- (a(i)) Define e-business architecture and identify key technological innovations impacting it. 5 marks
explain— definition/context → points in order → small example → short close
Must cover
- Precise definition of e-business architecture
- Identification of at least three technological innovations
- Explanation of how these innovations impact the architecture
- Logical connection between technology and business structure
Loses marks
- Generic definition without specific architectural components
- Listing technologies without explaining their impact
Earns more
- Mention of specific technologies like Cloud, AI, Blockchain
- Reference to specific architectural models (e.g., SOA)
Extra mark
- Citation of a specific recent industry report or case study
- (a(ii)) Outline the four pillars of e-governance and the types of interactions. 5 marks
describe— define → structure or process in order → labelled diagram → significance
Must cover
- Identification of the four pillars (e.g., infrastructure, policy, etc.)
- Description of G2C, G2B, G2G, G2E interactions
- Clear distinction between the types of interactions
- Brief explanation of the significance of each pillar
Loses marks
- Confusing pillars with interaction types
- Vague descriptions of G2C/G2B without examples
Earns more
- Use of a diagram or table for interactions
- Mention of specific e-governance services (e.g., e-filing)
Extra mark
- Reference to a specific national e-governance framework
- (a(iii)) Evaluate Indian Government's efforts and actions in e-governance implementation. 5 marks
discuss— intro → 3-4 dimensions → example → balanced close
Must cover
- Mention of key initiatives (e.g., Digital India, MyGov)
- Discussion of infrastructure development (e.g., broadband, data centers)
- Reference to policy frameworks or acts (e.g., IT Act, DPDP Act)
- Assessment of the impact or reach of these efforts
Loses marks
- Listing initiatives without discussing their implementation
- Ignoring the 'actions' aspect and focusing only on policy
Earns more
- Mention of specific schemes like Ayushman Bharat Digital Mission
- Reference to recent regulatory changes in data privacy
Extra mark
- Citation of specific statistics on digital adoption in India
- (b(i)) Solve the Linear Programming Problem using the Graphical Method. 10 marks
calculate— given → formula → substitution → result with units → interpretation
Must cover
- Correct plotting of constraints on a graph
- Identification of the feasible region
- Determination of corner points of the feasible region
- Calculation of objective function values at corner points
Loses marks
- Incorrect plotting of constraints
- Failure to identify the correct feasible region
Earns more
- Clear labeling of axes and constraints
- Explicit statement of the optimal solution
Extra mark
- Verification of the solution using the simplex method
- (b(ii)) Perform a Chi-Square test to determine if there is a significant difference in drug effects. 10 marks
calculate— given → formula → substitution → result with units → interpretation
Must cover
- Formulation of null and alternative hypotheses
- Calculation of expected frequencies for each cell
- Computation of the Chi-Square statistic
- Comparison with critical value and conclusion
Loses marks
- Incorrect calculation of expected frequencies
- Failure to state the hypotheses clearly
Earns more
- Correct calculation of degrees of freedom
- Clear presentation of the Chi-Square table
Extra mark
- Mention of the p-value associated with the test
- (c(i)) Explain the 'Decay Curve of New Product Ideas' in the context of an e-Bike. 5 marks
explain— definition/context → points in order → small example → short close
Must cover
- Definition of the Decay Curve concept
- Application of the curve to the e-Bike product lifecycle
- Identification of stages in the decay curve (e.g., introduction, growth, maturity, decline)
- Explanation of factors influencing the decay rate for e-Bikes
Loses marks
- Generic explanation without specific application to e-Bikes
- Failure to define the Decay Curve concept
Earns more
- Use of a diagram to illustrate the decay curve
- Mention of specific e-Bike features that might affect the curve
Extra mark
- Reference to a specific e-Bike brand or model
- (c(ii)(a)) Construct a control chart with 95% control limits for the given data. 5 marks
calculate— given → formula → substitution → result with units → interpretation
Must cover
- Calculation of the process average (p-bar)
- Determination of standard deviation for the p-chart
- Calculation of Upper and Lower Control Limits (UCL, LCL)
- Plotting of the control limits on a chart
Loses marks
- Incorrect calculation of p-bar or standard deviation
- Failure to plot the control limits correctly
Earns more
- Clear labeling of the chart axes and limits
- Explicit statement of the formula used for control limits
Extra mark
- Mention of the specific type of control chart used (p-chart)
- (c(ii)(b)) Analyze the next 5 samples to determine if the process is under control. 5 marks
analyse— intro → causes → effects → stakeholders/linkages → way forward
Must cover
- Plotting of the new sample data on the control chart
- Identification of any points outside the control limits
- Assessment of patterns or trends in the data
- Conclusion on whether the process is under control
Loses marks
- Failure to plot the new data points
- Incorrect interpretation of the control limits
Earns more
- Clear visual representation of the new data points
- Explicit statement of the criteria for 'out of control'
Extra mark
- Suggestion of corrective actions if the process is out of control
Practice this exact question
Write your answer and it is marked point by point against the model answer above — what you covered, what you missed, what you got wrong.
Evaluate my answer →More from Management 2021 Paper II
- Q1 (a) The mean annual income of workers in a company is ₹ 5,000 with a standard deviation o…
- Q2 (a) (i) 'A' can hit a target 4 times in 5 shots, 'B' 3 times in 4 shots and 'C' twice in…
- Q3 (a) (i) What is e-business architecture? Which technological innovations have had a major…
- Q4 (a) (i) How does the balancing line reduce the cost of idleness? Describe the steps invol…
- Q5 (a) "The Government of India has been making efforts to remove the regional imbalances in…
- Q6 (a) (i) What is the rationale behind liberalization strategies adopted by the New Industr…