Paper II — Q2
(a) The area sales manager of a company has compiled the following data for the eight territories under his/her supervision. All…
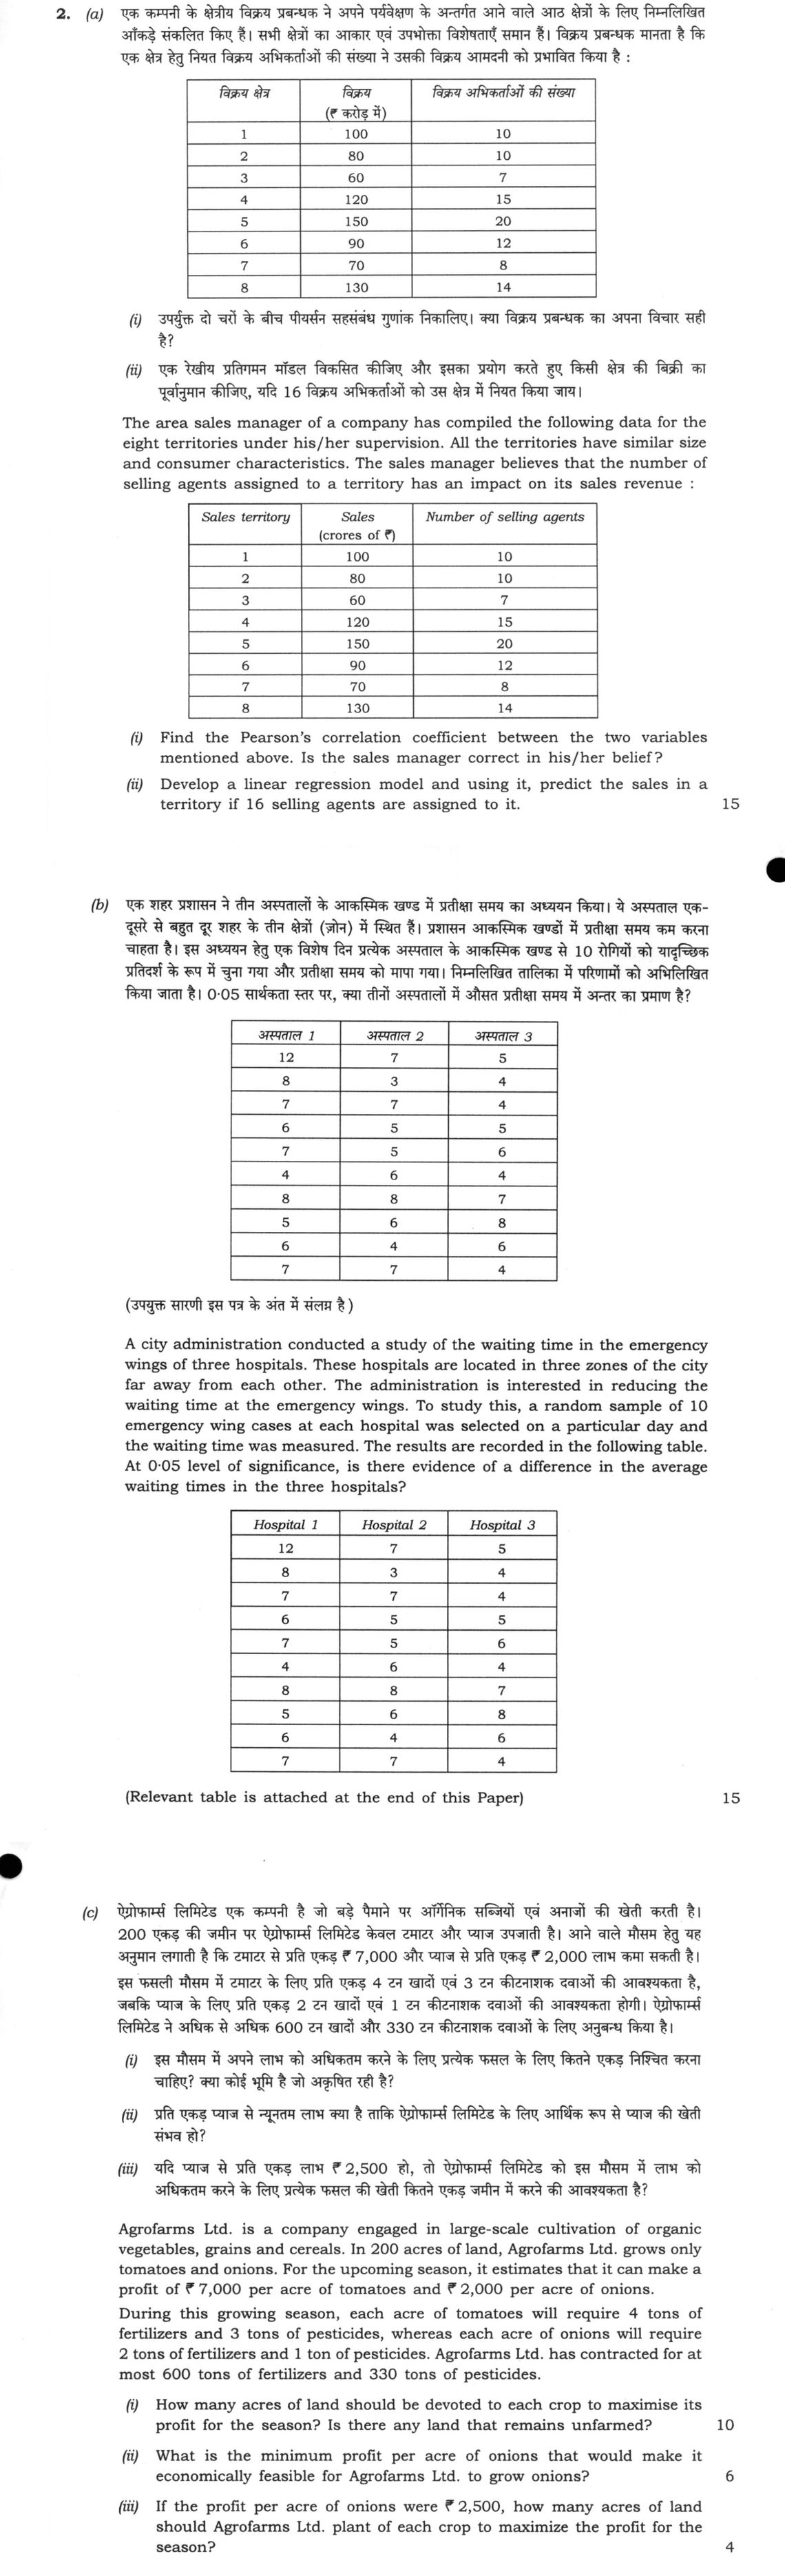
The area sales manager of a company has compiled the following data for the eight territories under his/her supervision. All the territories have similar size and consumer characteristics. The sales manager believes that the number of selling agents assigned to a territory has an impact on its sales revenue:
Find the Pearson's correlation coefficient between the two variables mentioned above. Is the sales manager correct in his/her belief?
Develop a linear regression model and using it, predict the sales in a territory if 16 selling agents are assigned to it. 15 marks
A city administration conducted a study of the waiting time in the emergency wings of three hospitals. These hospitals are located in three zones of the city far away from each other. The administration is interested in reducing the waiting time at the emergency wings. To study this, a random sample of 10 emergency wing cases at each hospital was selected on a particular day and the waiting time was measured. The results are recorded in the following table. At 0·05 level of significance, is there evidence of a difference in the average waiting times in the three hospitals? (Relevant table is attached at the end of this Paper) 15 marks
Agrofarms Ltd. is a company engaged in large-scale cultivation of organic vegetables, grains and cereals. In 200 acres of land, Agrofarms Ltd. grows only tomatoes and onions. For the upcoming season, it estimates that it can make a profit of ₹ 7,000 per acre of tomatoes and ₹ 2,000 per acre of onions. During this growing season, each acre of tomatoes will require 4 tons of fertilizers and 3 tons of pesticides, whereas each acre of onions will require 2 tons of fertilizers and 1 ton of pesticides. Agrofarms Ltd. has contracted for at most 600 tons of fertilizers and 330 tons of pesticides.
How many acres of land should be devoted to each crop to maximise its profit for the season? Is there any land that remains unfarmed? 10 marks
What is the minimum profit per acre of onions that would make it economically feasible for Agrofarms Ltd. to grow onions? 6 marks
If the profit per acre of onions were ₹ 2,500, how many acres of land should Agrofarms Ltd. plant of each crop to maximize the profit for the season? 4 marks
हिंदी में प्रश्न पढ़ें
एक कम्पनी के क्षेत्रीय विक्रय प्रबन्धक ने अपने पर्यवेक्षण के अन्तर्गत आने वाले आठ क्षेत्रों के लिए निम्नलिखित आँकड़े संकलित किए हैं। सभी क्षेत्रों का आकार एवं उपभोक्ता विशेषताएँ समान हैं। विक्रय प्रबन्धक मानता है कि एक क्षेत्र हेतु नियत विक्रय अभिकर्ताओं की संख्या ने उसकी विक्रय आमदनी को प्रभावित किया है:
उपर्युक्त दो चरों के बीच पियर्सन सहसम्बन्ध गुणांक निकालिए। क्या विक्रय प्रबन्धक का अपना विचार सही है?
एक रेखीय प्रतिगमन मॉडल विकसित कीजिए और इसका प्रयोग करते हुए किसी क्षेत्र की बिक्री का पूर्वानुमान कीजिए, यदि 16 विक्रय अभिकर्ताओं को उस क्षेत्र में नियत किया जाय। (15 अंक)
एक शहर प्रशासन ने तीन अस्पतालों के आकस्मिक खंड में प्रतीक्षा समय का अध्ययन किया। ये अस्पताल एक-दूसरे से बहुत दूर शहर के तीन क्षेत्रों (जोन) में स्थित हैं। प्रशासन आकस्मिक खंडों में प्रतीक्षा समय कम करना चाहता है। इस अध्ययन हेतु एक विशेष दिन प्रत्येक अस्पताल के आकस्मिक खंड से 10 रोगियों को यादृच्छिक प्रतिदर्श के रूप में चुना गया और प्रतीक्षा समय को मापा गया। निम्नलिखित तालिका में परिणामों को अभिलिखित किया जाता है। 0·05 सार्थकता स्तर पर, क्या तीनों अस्पतालों में औसत प्रतीक्षा समय में अंतर का प्रमाण है? (उपयुक्त सारणी इस पत्र के अंत में संलग्न है) (15 अंक)
एग्रोफार्म्स लिमिटेड एक कम्पनी है जो बड़े पैमाने पर ऑर्गेनिक सब्जियों एवं अनाजों की खेती करती है। 200 एकड़ की जमीन पर एग्रोफार्म्स लिमिटेड केवल टमाटर और प्याज उगाती है। आने वाले मौसम हेतु यह अनुमान लगाती है कि टमाटर से प्रति एकड़ ₹ 7,000 और प्याज से प्रति एकड़ ₹ 2,000 लाभ कमा सकती है। इस फसली मौसम में टमाटर के लिए प्रति एकड़ 4 टन खादों एवं 3 टन कीटनाशक दवाओं की आवश्यकता है, जबकि प्याज के लिए प्रति एकड़ 2 टन खादों एवं 1 टन कीटनाशक दवाओं की आवश्यकता होगी। एग्रोफार्म्स लिमिटेड ने अधिक से अधिक 600 टन खादों और 330 टन कीटनाशक दवाओं के लिए अनुबन्ध किया है।
इस मौसम में अपने लाभ को अधिकतम करने के लिए प्रत्येक फसल के लिए कितने एकड़ निश्चित करना चाहिए? क्या कोई भूमि है जो अकृषित रही है? (10 अंक)
प्रति एकड़ प्याज से न्यूनतम लाभ क्या है ताकि एग्रोफार्म्स लिमिटेड के लिए आर्थिक रूप से प्याज की खेती संभव हो? (6 अंक)
यदि प्याज से प्रति एकड़ लाभ ₹ 2,500 हो, तो एग्रोफार्म्स लिमिटेड को इस मौसम में लाभ को अधिकतम करने के लिए प्रत्येक फसल की खेती कितने एकड़ जमीन में करने की आवश्यकता है? (4 अंक)
The figure this question refers to, in words
The question paper is a scan and the diagram did not survive as text. This is the figure as read from the original page — every component, value and label — so the question can be worked from the text below.
(a) Table with three columns: 'Sales territory', 'Sales (crores of Rs.)', 'Number of selling agents'. Rows: 1, 100, 10 2, 80, 10 3, 60, 7 4, 120, 15 5, 150, 20 6, 90, 12 7, 70, 8 8, 130, 14
(b) Table with 3 columns and 11 rows (including header). Header: Hospital 1, Hospital 2, Hospital 3 Row 1: 12, 7, 5 Row 2: 8, 3, 4 Row 3: 7, 7, 4 Row 4: 6, 5, 5 Row 5: 7, 5, 6 Row 6: 4, 6, 4 Row 7: 8, 8, 7 Row 8: 5, 6, 8 Row 9: 6, 4, 6 Row 10: 7, 7, 4
Model answer
Written by UPSC Answer Check against this question's marking rubric, to the expected length. UPSC does not publish answers for Mains — this is one way to score well, not an official key.
(a)(i) Let x be selling agents and y be sales revenue in the recorded sales unit. n = 8. Use Pearson's product-moment correlation coefficient, r = Sxy / √(Sxx Syy), where Sxx = Σx² − (Σx)²/n, Syy = Σy² − (Σy)²/n, Sxy = Σxy − (ΣxΣy)/n. From the table, Σx = 96, Σy = 800, Σx² = 1278, Σy² = 86800, Σxy = 10480. Thus Sxx = 1278 − 96²/8 = 126 agent², Syy = 86800 − 800²/8 = 6800 sales-unit², Sxy = 10480 − (96×800)/8 = 880 agent·sales units. Hence r = 880/√(126×6800) = 44/√2142 ≈ 0.951. For a two-tailed test of H0: ρ = 0, t = r√(n−2)/√(1−r²) ≈ 7.51 with 6 df, exceeding 2.447 at 0.05. The relation is strong, positive and statistically significant. The positive sign means more agents are associated with higher sales. Final: r ≈ 0.951; the manager is correct that the variables are associated, though causation is not proved.
(a)(ii) Use ordinary least squares regression of y on x: y = a + bx, with b = Sxy/Sxx and a = y mean − b x mean. b = 880/126 = 440/63 ≈ 6.984 sales units per agent. a = 100 − (440/63)(12) = 340/21 ≈ 16.190 sales units. The model is y = 16.190 + 6.984x. For x = 16 agents, y = 340/21 + (440/63)(16) = 8060/63 ≈ 127.94. This is interpolation because 16 lies between 7 and 20. Final: predicted sales = 127.94 in the sales unit of the table; if that unit is lakhs, ₹127.94 lakhs; if crores, ₹127.94 crores.
(b) Use one-way analysis of variance (ANOVA) for three independent samples, assuming independent cases, approximately normal waiting times and common variance. H0: μ1 = μ2 = μ3; H1: not all means are equal. Waiting times are in the recorded time units. n = 10 per hospital, k = 3, N = 30. Group totals are T1 = 70, T2 = 58, T3 = 53; grand total T = 181. The group means are 7.0, 5.8 and 5.3 time units. The sum of squared observations is 532 + 358 + 299 = 1189. Between-group sum of squares: SSB = (4900 + 3364 + 2809)/10 − 32761/30 = 11073/10 − 32761/30 = 229/15 ≈ 15.267 time units². Within-group sum of squares: SSW = 1189 − 11073/10 = 817/10 = 81.7 time units². Degrees of freedom: between = 2, within = 27. Mean squares: MSB = (229/15)/2 = 229/30 ≈ 7.633; MSW = (817/10)/27 = 817/270 ≈ 3.026. Test statistic: F = MSB/MSW = 2061/817 ≈ 2.52. At 0.05, the critical F value with 2 and 27 df is ≈ 3.35. The corresponding p-value is about 0.10, above 0.05. The within-hospital variation is large relative to the between-hospital differences, so the F statistic does not reach the 0.05 critical value. Since 2.52 < 3.35, fail to reject H0. Final: there is no statistically significant evidence of a difference in average waiting times among the three hospitals.
(c)(i) Let x = acres of tomatoes and y = acres of onions. Assuming continuous acre allocation and constant per-acre profits, maximize Z = 7000x + 2000y rupees, subject to x + y ≤ 200 acres, 4x + 2y ≤ 600 tons, i.e. 2x + y ≤ 300, 3x + y ≤ 330, x ≥ 0, y ≥ 0. Use the graphical corner-point method. The relevant feasible corner points are (0,0), (110,0), (65,135), and (0,200). The point (110,0) comes from 3x + y = 330; (65,135) comes from x + y = 200 and 3x + y = 330; (0,200) comes from the land constraint. Evaluate Z: Z(0,0) = 0; Z(110,0) = 770000; Z(65,135) = 7000(65) + 2000(135) = 725000; Z(0,200) = 400000. The maximum is at (110,0). At (110,0), fertilizer used is 440 tons and pesticide used is 330 tons, both within limits; land used is 110 acres. Final: 110 acres tomatoes, 0 acres onions; maximum profit ₹7,70,000; 90 acres remain unfarmed.
(c)(ii) Let c be the profit per acre of onions. To make onions economically feasible, an optimal solution with y > 0 must be at least as profitable as the all-tomato point (110,0). Compare (65,135) with (110,0): 7000(65) + 135c ≥ 7000(110). Thus 455000 + 135c ≥ 770000, so 135c ≥ 315000 and c ≥ 7000/3 ≈ 2333.33 rupees per acre. At c = 7000/3, the pesticide edge from (65,135) to (110,0) is optimal; for c > 7000/3, the unique optimum includes onions. This threshold is the opportunity cost of the scarce pesticide. Final: minimum onion profit ≈ ₹2,333.33 per acre; strictly greater if onions must be grown in the unique optimum.
(c)(iii) With c = 2500 rupees per acre, evaluate the same relevant vertices: Z(110,0) = 770000; Z(65,135) = 7000(65) + 2500(135) = 792500; Z(0,200) = 2500(200) = 500000. The maximum is at (65,135). Final: 65 acres tomatoes, 135 acres onions; maximum profit ₹7,92,500; no land remains unfarmed.
What "Solve" is asking you to do
Choose the method, then carry it through to a final answer. Identifying what kind of problem this is and why that method applies is the first thing marked; a correct figure arrived at invisibly earns almost nothing.
Structure that answers it
Given data and what is required → method chosen, with the reason it applies → set-up (equation, circuit, free body, trial balance) → working, step by step → answer with units and any condition of validity
Where marks are lost
Doing the middle steps mentally and writing only the result. In mathematics papers, a further loss comes from giving a decimal where the exact value in surds or fractions was wanted, or from skipping the justification a part explicitly asks for.
How this answer will be evaluated
Approach
Framework: Statistical Analysis (Correlation, Regression, ANOVA) and Linear Programming. (a(i)) calculate: given > formula > substitution > result with units > interpretation | (a(ii)) calculate: given > formula > substitution > result with units > interpretation | (b) calculate: given > formula > substitution > result with units > interpretation | (c(i)) calculate: given > formula > substitution > result with units > interpretation | (c(ii)) calculate: given > formula > substitution > result with units > interpretation | (c(iii)) calculate: given > formula > substitution > result with units > interpretation Full marks: Flawless calculations, clear logical flow, and precise interpretation of statistical and economic results.
Key points expected
- Correct calculation of Pearson's r
- Interpretation of correlation strength
- Verdict on sales manager's belief
- Correct regression equation (Y = a + bX)
- Substitution of X=16
- Final predicted sales value
- Correct ANOVA table (SS, df, MS, F)
- Comparison of F-stat with critical value
Evaluation rubric
Each sub-part is marked on its own, against the marks and word limit printed on the paper.
- (a(i)) Compute Pearson's r and interpret the relationship.
calculate— given → formula → substitution → result with units → interpretation
Must cover
- Correct calculation of Pearson's r
- Interpretation of correlation strength
- Verdict on sales manager's belief
Loses marks
- Calculation error in summations
- No interpretation of the coefficient
Earns more
- Mention of positive correlation
- Reference to coefficient of determination
Extra mark
- Scatter plot sketch
- (a(ii)) Derive regression equation and predict sales for 16 agents.
calculate— given → formula → substitution → result with units → interpretation
Must cover
- Correct regression equation (Y = a + bX)
- Substitution of X=16
- Final predicted sales value
Loses marks
- Incorrect slope calculation
- Failure to substitute the value
Earns more
- Step-by-step calculation of slope and intercept
Extra mark
- Confidence interval for prediction
- (b) Perform ANOVA to test for difference in mean waiting times. 15 marks
calculate— given → formula → substitution → result with units → interpretation
Must cover
- Correct ANOVA table (SS, df, MS, F)
- Comparison of F-stat with critical value
- Conclusion on null hypothesis
Loses marks
- Arithmetic error in Sum of Squares
- Incorrect conclusion based on F-value
Earns more
- Explicit statement of hypotheses
- Correct degrees of freedom
Extra mark
- Post-hoc test mention
- (c(i)) Solve LP to maximize profit and check for unused land. 10 marks
calculate— given → formula → substitution → result with units → interpretation
Must cover
- Correct objective function and constraints
- Optimal solution (acres of each crop)
- Calculation of maximum profit
- Determination of unfarmed land
Loses marks
- Incorrect constraint formulation
- Failure to check for slack in land
Earns more
- Graphical representation of feasible region
- Identification of corner points
Extra mark
- Sensitivity analysis on constraints
- (c(ii)) Find minimum onion profit for economic feasibility. 6 marks
calculate— given → formula → substitution → result with units → interpretation
Must cover
- Logic for break-even profit calculation
- Correct minimum profit value
Loses marks
- Arithmetic error in ratio calculation
- No justification for the threshold
Earns more
- Explanation of opportunity cost
Extra mark
- Sensitivity analysis on tomato profit
- (c(iii)) Re-solve LP with new onion profit to find new optimum. 4 marks
calculate— given → formula → substitution → result with units → interpretation
Must cover
- New objective function
- New optimal solution (acres)
Loses marks
- Failure to update objective function
- Incorrect new solution
Earns more
- Comparison with previous solution
Extra mark
- Discussion of profit change
Practice this exact question
Write your answer and it is marked point by point against the model answer above — what you covered, what you missed, what you got wrong.
Evaluate my answer →More from Management 2022 Paper II
- Q1 (a) A newly constructed house can collapse due to fault in its design. It can also collap…
- Q2 (a) The area sales manager of a company has compiled the following data for the eight ter…
- Q3 (a) (i) List the strategic objectives of aggregate planning. 5 (ii) Describe the chase an…
- Q4 (a) What exactly is an information system? How does it work? What are its management, org…
- Q5 (a) Is State participation in business essential? Discuss the objectives of liberalizatio…