Paper II — Q3
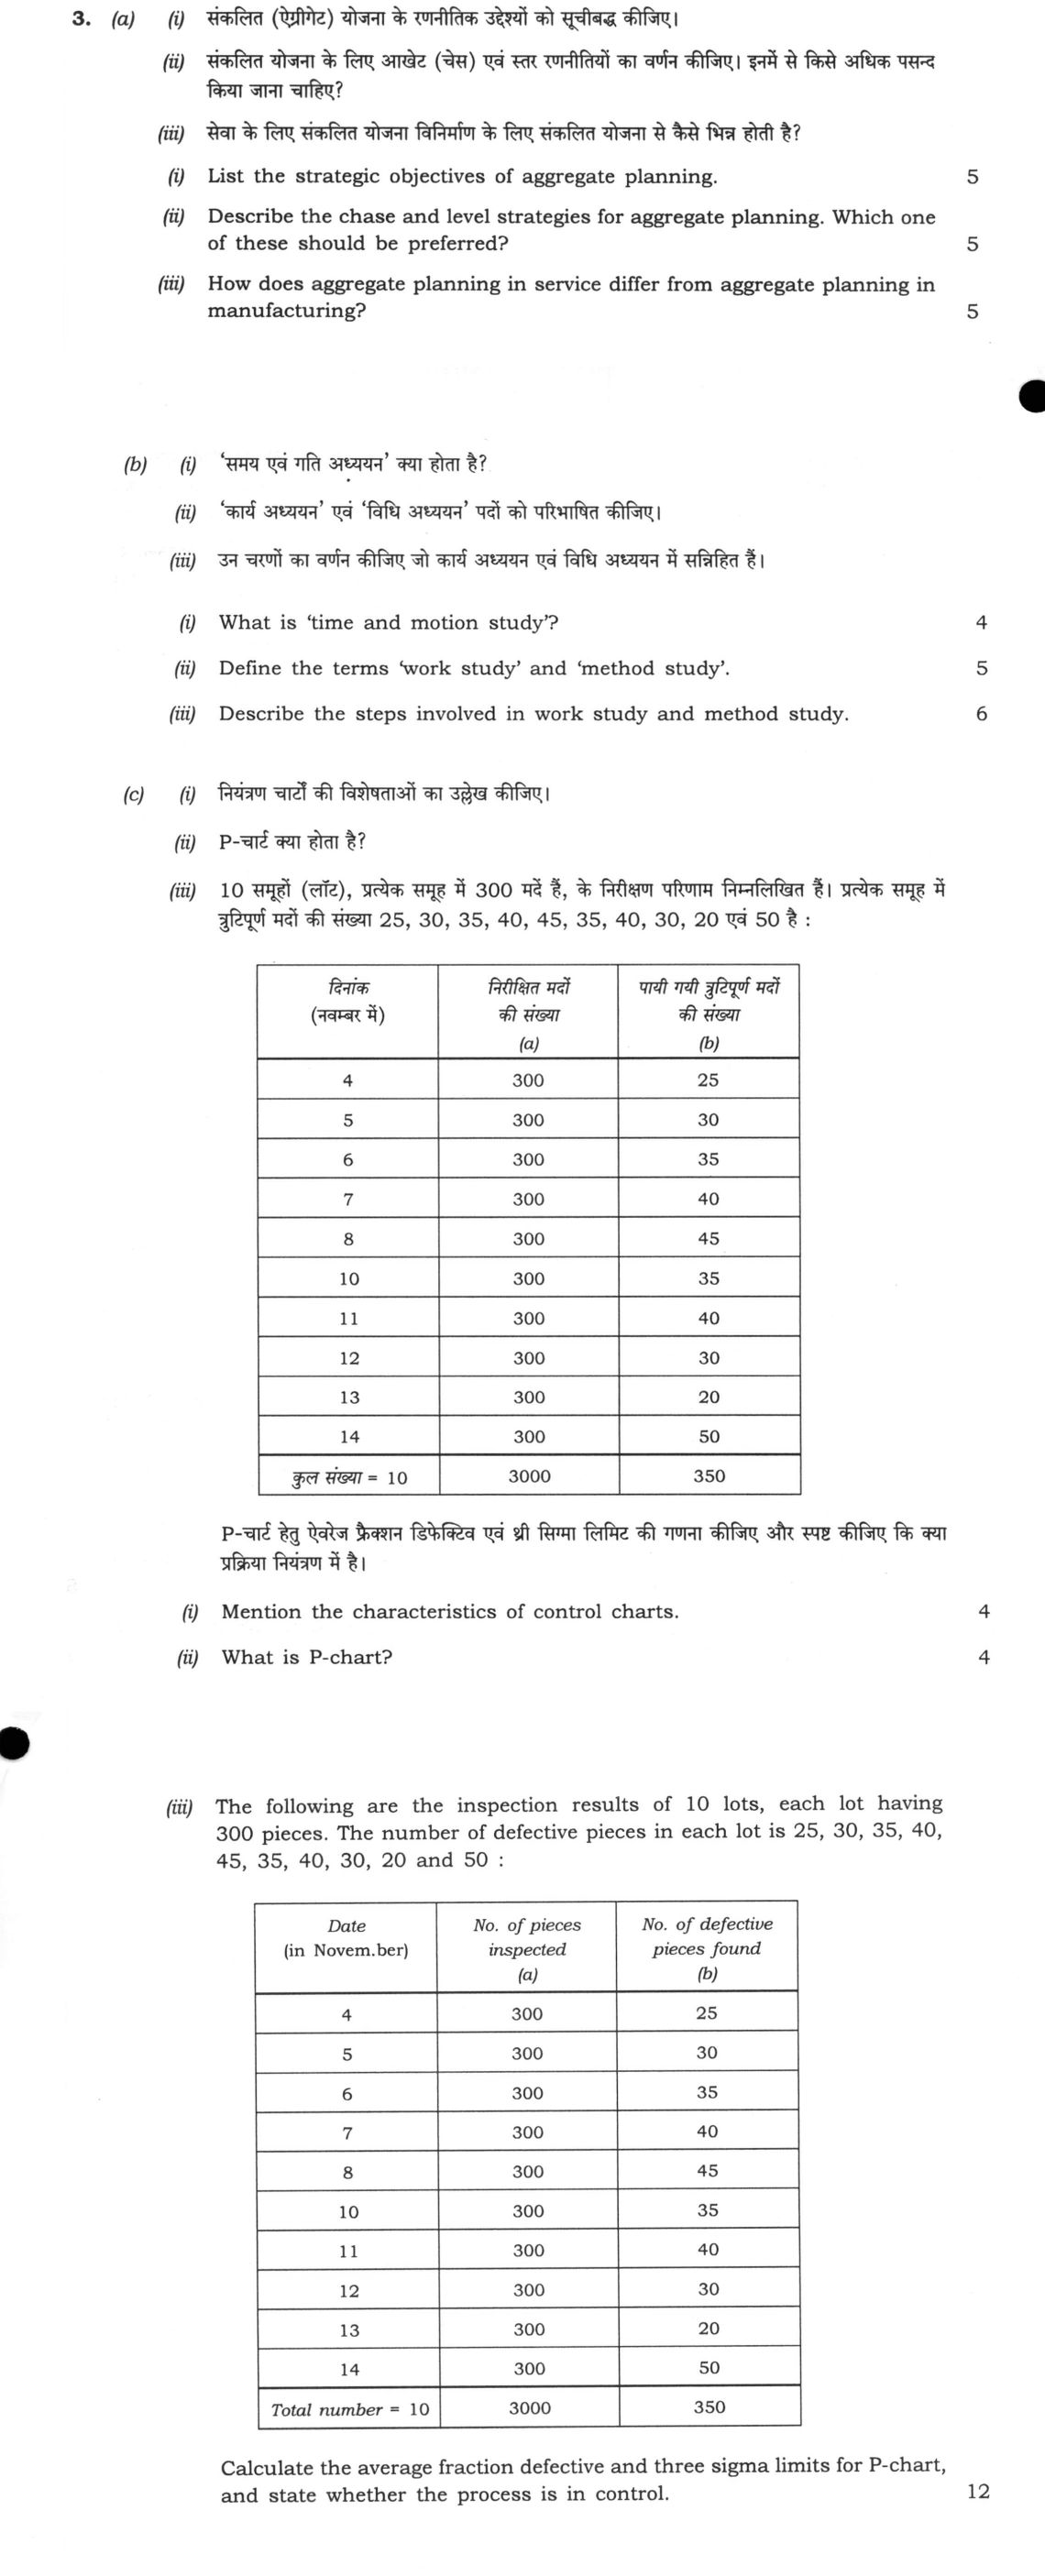
(a) (i) List the strategic objectives of aggregate planning. 5 (ii) Describe the chase and level strategies for aggregate…
List the strategic objectives of aggregate planning. 5 marks
Describe the chase and level strategies for aggregate planning. Which one of these should be preferred? 5 marks
How does aggregate planning in service differ from aggregate planning in manufacturing? 5 marks
What is 'time and motion study'? 4 marks
Define the terms 'work study' and 'method study'. 5 marks
Describe the steps involved in work study and method study. 6 marks
Mention the characteristics of control charts. 4 marks
What is P-chart? 4 marks
The following are the inspection results of 10 lots, each lot having 300 pieces. The number of defective pieces in each lot is 25, 30, 35, 40, 45, 35, 40, 30, 20 and 50 : Calculate the average fraction defective and three sigma limits for P-chart, and state whether the process is in control. 12 marks
हिंदी में प्रश्न पढ़ें
(क) (i) संकलित (एग्रीगेट) योजना के रणनीतिक उद्देश्यों को सूचीबद्ध कीजिए। संकलित योजना के लिए आउटे (चेस) एवं स्तर रणनीतियों का वर्णन कीजिए। इनमें से किसे अधिक पसन्द किया जाना चाहिए?
सेवा के लिए संकलित योजना विनिर्माण के लिए संकलित योजना से कैसे भिन्न होती है? (ख) (i) 'समय एवं गति अध्ययन' क्या होता है?
'कार्य अध्ययन' एवं 'विधि अध्ययन' पदों को परिभाषित कीजिए।
उन चरणों का वर्णन कीजिए जो कार्य अध्ययन एवं विधि अध्ययन में संलिखित हैं। (ग) (i) नियंत्रण चार्टों की विशेषताओं का उल्लेख कीजिए।
P-चार्ट क्या होता है?
10 समूहों (लॉट), प्रत्येक समूह में 300 मदें हैं, के निरीक्षण परिणाम निम्नलिखित हैं। प्रत्येक समूह में त्रुटिपूर्ण मदों की संख्या 25, 30, 35, 40, 45, 35, 40, 30, 20 एवं 50 है : P-चार्ट हेतु एवरेज फ्रैक्शन डिफेक्टिव एवं त्री सिग्मा लिमिट की गणना कीजिए और स्पष्ट कीजिए कि क्या प्रक्रिया नियंत्रण में है।
Model answer
Written by UPSC Answer Check against this question's marking rubric, to the expected length. UPSC does not publish answers for Mains — this is one way to score well, not an official key.
(a) (i) Strategic objectives of aggregate planning:
- Match aggregate demand with available capacity at minimum total cost.
- Decide output rate, workforce size, inventory and backlog levels.
- Stabilise employment and production, avoiding frequent hiring, firing and idle time.
- Meet customer service and delivery targets.
- Use overtime, subcontracting and inventory efficiently.
- Maximise profit and give a basis for master production scheduling.
(a) (ii) Chase strategy varies output/capacity each period to match demand. It uses hiring, lay-off, overtime, idle time and subcontracting. It gives low inventory and close demand matching, but causes unstable workforce, morale and quality problems, and high hiring/firing costs. Level strategy keeps workforce/output constant and absorbs demand changes through inventory, backorders, queues or stockouts. It gives stable workforce and consistent quality, but creates inventory carrying, storage, obsolescence and backlog costs. Between the two, level strategy is generally preferred when demand fluctuations are moderate and inventory carrying cost is low, because it stabilises employment and quality. Chase is preferred when demand is highly seasonal and labour is flexible. In practice, a mixed/hybrid strategy based on least total cost that satisfies service policy is often best.
(a) (iii) Manufacturing aggregate planning can store output, so it uses finished-goods inventory, backorders, overtime, subcontracting and workforce changes. Service output is intangible and perishable; it cannot be inventoried except through customer waiting or appointments. Service capacity is usually labour/equipment at the point of contact, so planning uses scheduling, reservations, pricing, promotion, part-time staff, cross-training, queueing and yield management. Manufacturing can smooth production by inventory; services must manage demand and capacity at the same time. Service capacity units are rooms, seats or billable hours, not stored units.
(b) (i) Time and motion study is a systematic work-measurement and method-improvement technique. Time study determines the standard time for a qualified worker to perform a task at a defined performance level, including allowances. Motion study analyses movements to eliminate unnecessary motion and design the best method. Together they improve productivity and set time standards.
(b) (ii) Work study is the systematic examination of work methods and time to improve productivity and establish standards; it comprises method study and work measurement. Method study is the systematic recording and critical examination of existing or proposed methods of doing work, to develop easier, safer, cheaper and more effective methods and reduce waste.
(b) (iii) Steps in work study: select the job/process; record facts; examine critically; develop improved method; measure work to set standard time; install the method; maintain through audit and revision. Steps in method study: select; record using charts/diagrams; examine by questioning purpose, place, sequence, person and means; develop the best method; define and install it; maintain it. Thus method study supplies the improved method, while work measurement supplies the standard time within overall work study.
(c) (i) Control charts have a central line showing process average and upper/lower control limits, usually at ±3σ. They separate common-cause and special-cause variation. Control limits are based on process variation, not specification limits. Points are plotted over time; an in-control process shows random variation within limits. Out-of-control signals include points outside limits, runs, trends, cycles or unusual patterns near limits.
(c) (ii) A P-chart is an attributes control chart for the proportion defective, i.e. nonconforming. Centre line p̄ = total defectives/total inspected. For constant sample size n, limits are p̄ ± 3√(p̄(1−p̄)/n). For variable n, limits are computed for each nᵢ. If LCL is below zero, it is taken as zero. It assumes independent binomial samples.
(c) (iii) Total defectives = 25 + 30 + 35 + 40 + 45 + 35 + 40 + 30 + 20 + 50 = 350 defective pieces. Number of lots = 10; sample size n = 300 pieces per lot. Total inspected = 10 × 300 = 3000 pieces. Average fraction defective: p̄ = 350/3000 = 7/60 = 0.116667. Standard deviation of proportion: σₚ = √(p̄(1−p̄)/n) = √((7/60)(53/60)/300) = √(371/1,080,000) = 0.0185343. Three-sigma limits: UCL = p̄ + 3σₚ = 7/60 + 3√(371/1,080,000) = 0.172269 ≈ 0.1723. LCL = p̄ − 3σₚ = 7/60 − 3√(371/1,080,000) = 0.061064 ≈ 0.0611. Since LCL > 0, no truncation is needed. Lot fractions defective: 25/300 = 0.0833, 30/300 = 0.1000, 35/300 = 0.1167, 40/300 = 0.1333, 45/300 = 0.1500, 35/300 = 0.1167, 40/300 = 0.1333, 30/300 = 0.1000, 20/300 = 0.0667, 50/300 = 0.1667. All lie between 0.0611 and 0.1723, and no run signal is evident. Average fraction defective p̄ = 7/60 = 0.1167; three-sigma limits are UCL = 0.1723 and LCL = 0.0611; hence the process is in control. Validity: independent random lots, constant n = 300 pieces, binomial conditions, np̄ = 35 and n(1−p̄) = 265, both ≥ 5.
What "Calculate" is asking you to do
Apply the standard formula or schedule to data the question has already supplied — a table of readings, cost records, a balance sheet — and produce the number. The method is rarely in doubt; the marks sit in the named intermediate quantities, each of which has to appear as a labelled line.
Structure that answers it
Data as given → formula or standard treatment, named → substitution → each intermediate, labelled → result with units
Where marks are lost
Omitting an intermediate the marking scheme pays for separately, or rounding at an intermediate line so the final figure drifts. In commerce and accountancy, any figure in a statement that no numbered working note supports is treated as unearned.
How this answer will be evaluated
Approach
Framework: Operations Management: Aggregate Planning, Work Study, and Statistical Process Control (SPC). (a) describe: define > structure or process in order > labelled diagram > significance | (b) describe: define > structure or process in order > labelled diagram > significance | (c) describe: define > structure or process in order > labelled diagram > significance Full marks: Precise definitions, correct calculation of p-bar and limits, clear distinction between strategies.
Key points expected
- Chase vs Level strategy comparison
- Service vs Manufacturing aggregate planning differences
- Steps of Work Study (Record, Analyze, Evaluate, Install, Maintain)
- P-chart calculation: p-bar = 0.1167
- UCL/LCL calculation for P-chart
- Process status: Out of control
Evaluation rubric
Each sub-part is marked on its own, against the marks and word limit printed on the paper.
- (a) Strategic objectives, comparison of chase vs level strategies, and service vs manufacturing differences.
describe— define → structure or process in order → labelled diagram → significance
Must cover
- List 3-4 strategic objectives (cost, service, flexibility).
- Define chase strategy (vary workforce) and level strategy (constant output).
- State preference based on demand stability and cost structure.
- Contrast inventory (manufacturing) vs capacity (service) management.
Loses marks
- Defining aggregate planning without listing objectives.
- Confusing aggregate planning with master production scheduling.
Earns more
- Mention overtime/undertime as levers.
- Reference 'perishability' of service inventory.
- Use a simple graph to show demand vs capacity.
Extra mark
- Cite a specific industry example (e.g., airline vs auto).
- (b) Definitions of time/motion, work/method study, and the procedural steps of work study.
describe— define → structure or process in order → labelled diagram → significance
Must cover
- Define time study (standard time) and motion study (efficiency).
- Define work study (method + time) and method study (best way).
- List steps: Record, Analyze, Evaluate, Install, Maintain.
- Distinguish between 'method' (how) and 'time' (how long).
Loses marks
- Merging work study and method study definitions.
- Listing steps without explaining the 'Evaluate' phase.
Earns more
- Mention 'therbligs' in motion study.
- Reference 'stopwatch' or 'video' recording methods.
- Mention 'allowances' in time study calculation.
Extra mark
- Mention Taylor's scientific management context.
- (c) Characteristics of control charts, definition of P-chart, and calculation of limits for the given data.
describe— define → structure or process in order → labelled diagram → significance
Must cover
- List 3-4 characteristics (statistical, continuous, feedback).
- Define P-chart (fraction defective, variable sample size).
- Calculate p-bar (350/3000 = 0.1167).
- Calculate UCL and LCL using 3-sigma formula.
Loses marks
- Using C-chart or U-chart formulas instead of P-chart.
- Failing to convert total defects to fraction defective.
Earns more
- Show the formula: p-bar ± 3 * sqrt(p-bar(1-p-bar)/n).
- Identify the specific point (50 defects) as out of control.
- State the process is 'out of control' clearly.
Extra mark
- Draw a sketch of the P-chart with the limits.
Practice this exact question
Write your answer and it is marked point by point against the model answer above — what you covered, what you missed, what you got wrong.
Evaluate my answer →More from Management 2022 Paper II
- Q1 (a) A newly constructed house can collapse due to fault in its design. It can also collap…
- Q2 (a) The area sales manager of a company has compiled the following data for the eight ter…
- Q3 (a) (i) List the strategic objectives of aggregate planning. 5 (ii) Describe the chase an…
- Q4 (a) What exactly is an information system? How does it work? What are its management, org…
- Q5 (a) Is State participation in business essential? Discuss the objectives of liberalizatio…
- Q6 (a) Critically examine government's policy with regard to Small-Scale Industries (SSIs).…