Paper II — Q2
(a) The electrical power demand of TATA Power Corporation from 2018 to 2024, measured in megawatts, is provided below. Using the…
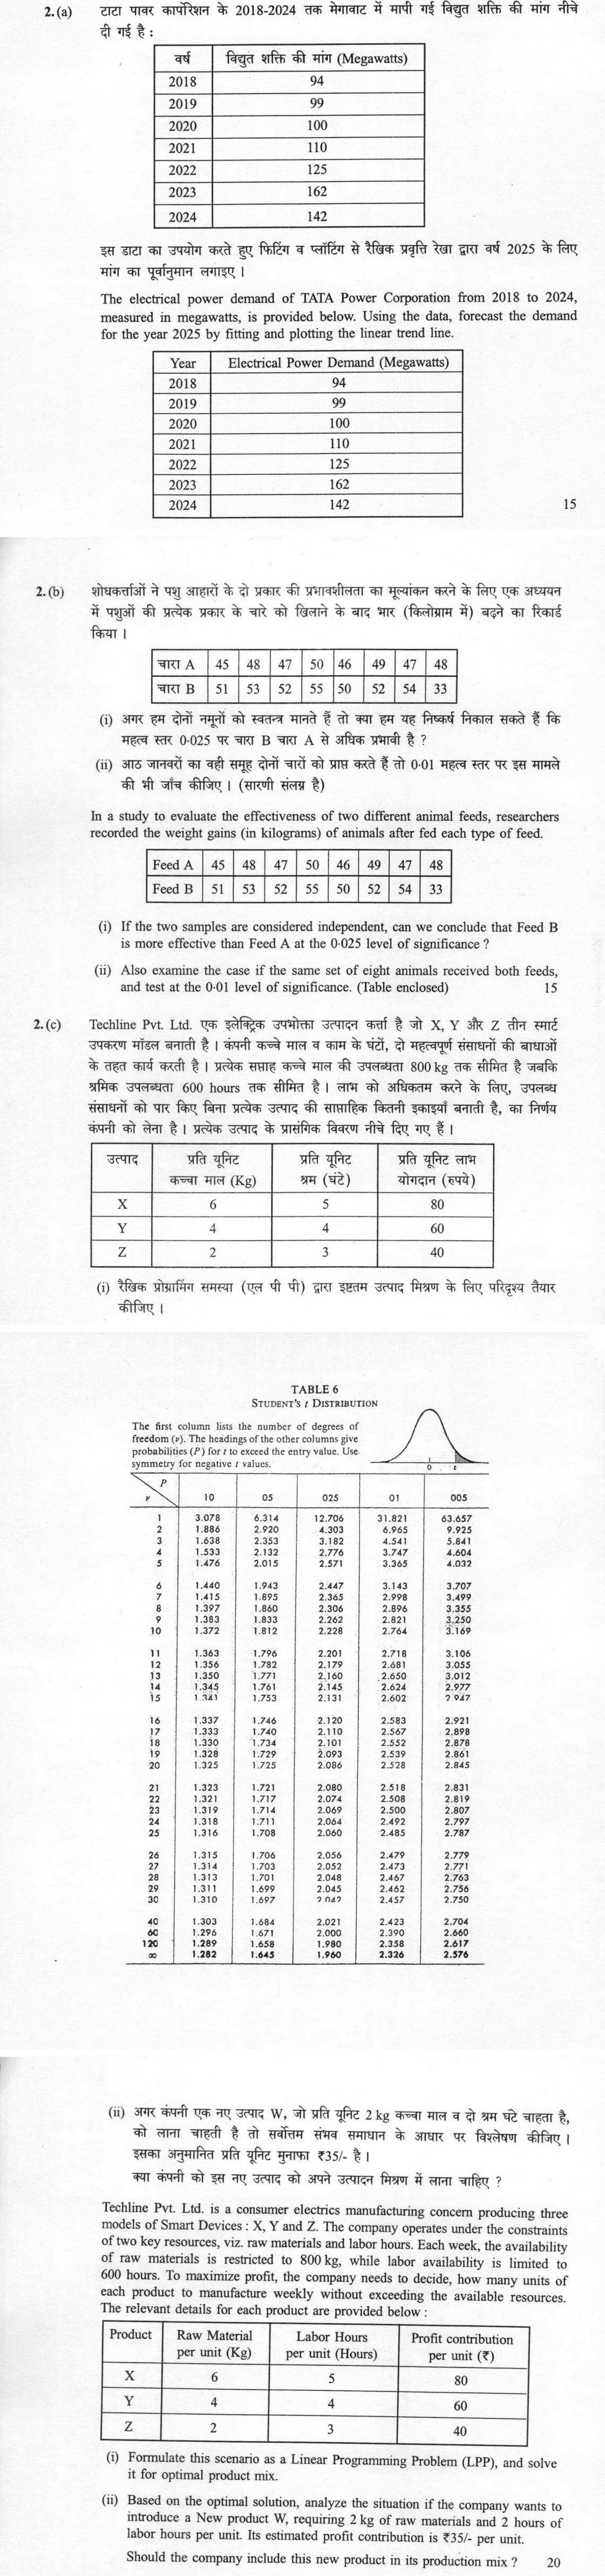
The electrical power demand of TATA Power Corporation from 2018 to 2024, measured in megawatts, is provided below. Using the data, forecast the demand for the year 2025 by fitting and plotting the linear trend line.
Year | Electrical Power Demand (Megawatts) 2018 | 94 2019 | 99 2020 | 100 2021 | 110 2022 | 125 2023 | 162 2024 | 142
15
In a study to evaluate the effectiveness of two different animal feeds, researchers recorded the weight gains (in kilograms) of animals after fed each type of feed.
Feed A | 45 | 48 | 47 | 50 | 46 | 49 | 47 | 48 Feed B | 51 | 53 | 52 | 55 | 50 | 52 | 54 | 33
If the two samples are considered independent, can we conclude that Feed B is more effective than Feed A at the 0·025 level of significance ?
Also examine the case if the same set of eight animals received both feeds, and test at the 0·01 level of significance. (Table enclosed) 15 marks
Techline Pvt. Ltd. is a consumer electrics manufacturing concern producing three models of Smart Devices : X, Y and Z. The company operates under the constraints of two key resources, viz. raw materials and labor hours. Each week, the availability of raw materials is restricted to 800 kg, while labor availability is limited to 600 hours. To maximize profit, the company needs to decide, how many units of each product to manufacture weekly without exceeding the available resources. The relevant details for each product are provided below :
| Product | Raw Material per unit (Kg) | Labor Hours per unit (Hours) | Profit contribution per unit (₹) |
|---|---|---|---|
| X | 6 | 5 | 80 |
| Y | 4 | 4 | 60 |
| Z | 2 | 3 | 40 |
Formulate this scenario as a Linear Programming Problem (LPP), and solve it for optimal product mix.
Based on the optimal solution, analyze the situation if the company wants to introduce a New product W, requiring 2 kg of raw materials and 2 hours of labor hours per unit. Its estimated profit contribution is ₹35/- per unit.
Should the company include this new product in its production mix ? 20 marks
हिंदी में प्रश्न पढ़ें
टाटा पावर कॉरपोरेशन के 2018-2024 तक मेगावाट में मापी गई विद्युत शक्ति की मांग नीचे दी गई है :
वर्ष | विद्युत शक्ति की मांग (Megawatts) 2018 | 94 2019 | 99 2020 | 100 2021 | 110 2022 | 125 2023 | 162 2024 | 142
इस डाटा का उपयोग करते हुए फिटिंग व प्लॉटिंग से रैखिक प्रवृत्ति रेखा द्वारा वर्ष 2025 के लिए मांग का पूर्वानुमान लगाइए ।
15
शोधकर्ताओं ने पशु आहारों के दो प्रकार की प्रभावशीलता का मूल्यांकन करने के लिए एक अध्ययन में पशुओं की प्रत्येक प्रकार के चारे को खिलाने के बाद भार (किलोग्राम में) बढ़ने का रिकॉर्ड किया ।
चारा A | 45 | 48 | 47 | 50 | 46 | 49 | 47 | 48 चारा B | 51 | 53 | 52 | 55 | 50 | 52 | 54 | 33
अगर हम दोनों नमूनों को स्वतंत्र मानते हैं तो क्या हम यह निष्कर्ष निकाल सकते हैं कि महत्व स्तर 0·025 पर चारा B चारा A से अधिक प्रभावी है ?
आठ जानवरों का वही समूह दोनों चारों को प्राप्त करते है तो 0·01 महत्व स्तर पर इस मामले की भी जाँच कीजिए । (सारणी संलग्न है) 15 marks
Techline Pvt. Ltd. एक इलेक्ट्रिक उपभोक्ता उत्पाद कर्ता है जो X, Y और Z तीन स्मार्ट उपकरण मॉडल बनाती है । कंपनी कच्चे माल व काम के घंटों, दो महत्वपूर्ण संसाधनों की बाधाओं के तहत कार्य करती है । प्रत्येक सप्ताह कच्चे माल की उपलब्धता 800 kg तक सीमित है जबकि श्रमिक उपलब्धता 600 hours तक सीमित है । लाभ को अधिकतम करने के लिए, उपलब्ध संसाधनों को पार किए बिना प्रत्येक उत्पाद की साप्ताहिक कितनी इकाइयाँ बनाती है, का निर्णय कंपनी को लेना है । प्रत्येक उत्पाद के प्रासंगिक विवरण नीचे दिए गए हैं ।
उत्पाद | प्रति यूनिट कच्चा माल (Kg) | प्रति यूनिट श्रम (घंटे) | प्रति यूनिट लाभ योगदान (रुपये) X | 6 | 5 | 80 Y | 4 | 4 | 60 Z | 2 | 3 | 40
रैखिक प्रोग्रामिंग समस्या (एल पी पी) द्वारा इष्टतम उत्पाद मिश्रण के लिए परिदृश्य तैयार कीजिए ।
अगर कंपनी एक नए उत्पाद W, जो प्रति यूनिट 2 kg कच्चा माल व दो श्रम घंटे चाहता है, को लाना चाहती है तो सर्वोत्तम संभव समाधान के आधार पर विश्लेषण कीजिए। इसका अनुमानित प्रति यूनिट मुनाफा ₹35/- है।
क्या कंपनी को इस नए उत्पाद को अपने उत्पादन मिश्रण में लाना चाहिए ? 20 marks
Model answer
Written by UPSC Answer Check against this question's marking rubric, to the expected length. UPSC does not publish answers for Mains — this is one way to score well, not an official key.
(a) Let x = year − 2021 and y = demand in MW. The data become: x = −3, −2, −1, 0, 1, 2, 3; y = 94, 99, 100, 110, 125, 162, 142. n = 7, Σx = 0, Σy = 832, Σxy = 295, Σx² = 28. By the least-squares method, the linear trend is y = a + bx, where b = Σxy/Σx² = 295/28 = 10.5357, a = Σy/n = 832/7 = 118.8571. So the fitted trend line is: y = 832/7 + (295/28)x = 118.8571 + 10.5357(year − 2021). For 2025, x = 4: y = 832/7 + (295/28)(4) = 832/7 + 295/7 = 1127/7 = 161. Forecast demand for 2025 = 161 MW. Plot: plot the points (2018,94), (2019,99), (2020,100), (2021,110), (2022,125), (2023,162), (2024,142). The straight line passes through (2021,118.86) and (2025,161.00); at x = −3 it gives 87.25 MW and at x = 3 it gives 150.46 MW. This assumes the underlying trend remains linear.
(b) (i) Let H₀: μB − μA ≤ 0 and H₁: μB − μA > 0. Use the independent two-sample t-test, assuming equal variances. Feed A: n₁ = 8, ΣA = 380, mean A = 47.5, Σ(A − mean)² = 18, sA² = 18/7. Feed B: n₂ = 8, ΣB = 400, mean B = 50.0, Σ(B − mean)² = 348, sB² = 348/7. Pooled variance: s_p² = [(n₁ − 1)sA² + (n₂ − 1)sB²]/(n₁ + n₂ − 2) = (18 + 348)/14 = 366/14 = 183/7. Standard error: SE = √[s_p²(1/n₁ + 1/n₂)] = √[(183/7)(1/8 + 1/8)] = √(183/28) = 2.5565. t = (mean B − mean A)/SE = (50.0 − 47.5)/2.5565 = 2.5/2.5565 = 0.978. At α = 0.025, one-tailed, df = 14, t-critical = 2.145. Since 0.978 < 2.145, we fail to reject H₀. No, we cannot conclude that Feed B is more effective than Feed A at the 0.025 level.
(ii) If the same eight animals received both feeds, use the paired t-test. Differences d = B − A: 6, 5, 5, 5, 4, 3, 7, −15. n = 8, Σd = 20, mean d̄ = 20/8 = 2.5. Σ(d − d̄)² = 360, so s_d² = 360/7 = 51.4286. SE = s_d/√n = √(360/7)/√8 = √(360/56) = √(45/7) = 2.5355. t = d̄/SE = 2.5/2.5355 = 0.986. At α = 0.01, one-tailed, df = 7, t-critical = 2.998. If two-tailed, t-critical = 3.499. Since 0.986 < 2.998, we fail to reject H₀. Even for paired data, we cannot conclude at the 0.01 level that Feed B is more effective.
(c) (i) Let x, y, z be weekly units of X, Y, Z. Maximise P = 80x + 60y + 40z subject to: 6x + 4y + 2z ≤ 800 (raw material) 5x + 4y + 3z ≤ 600 (labour hours) x, y, z ≥ 0. The raw-material constraint is redundant, because 6x + 4y + 2z ≤ 6x + 4.8y + 3.6z = 1.2(5x + 4y + 3z) ≤ 1.2(600) = 720 < 800. Thus only labour is effectively binding. Profit per labour hour: X = 80/5 = 16, Y = 60/4 = 15, Z = 40/3 = 13.33. So labour is best used on X. If only X is produced: 5x ≤ 600 ⇒ x = 120. Raw material used = 6(120) = 720 ≤ 800. Feasible. Profit = 80(120) = ₹9,600. Optimal mix: x = 120, y = 0, z = 0. Maximum weekly profit = ₹9,600. Raw material slack = 800 − 720 = 80 kg; labour slack = 0.
(ii) For product W, labour requirement = 2 hours, raw material = 2 kg, profit = ₹35. Profit per labour hour for W = 35/2 = 17.5, which is greater than X’s 16. Also, raw material remains redundant because all products have raw material per labour hour ≤ 1.2, so raw use ≤ 720 kg < 800 kg. Thus produce W using all labour: 2w ≤ 600 ⇒ w = 300. Raw material used = 2(300) = 600 ≤ 800. Profit = 300 × 35 = ₹10,500. This exceeds the old profit ₹9,600 by ₹900 per week. Alternatively, current labour shadow price = ₹16/hour and raw-material shadow price = ₹0/kg, so opportunity cost of one W = 2(16) + 2(0) = ₹32 < ₹35. Yes, include W. New optimal mix: 300 units of W, profit = ₹10,500 per week.
What "Solve" is asking you to do
Choose the method, then carry it through to a final answer. Identifying what kind of problem this is and why that method applies is the first thing marked; a correct figure arrived at invisibly earns almost nothing.
Structure that answers it
Given data and what is required → method chosen, with the reason it applies → set-up (equation, circuit, free body, trial balance) → working, step by step → answer with units and any condition of validity
Where marks are lost
Doing the middle steps mentally and writing only the result. In mathematics papers, a further loss comes from giving a decimal where the exact value in surds or fractions was wanted, or from skipping the justification a part explicitly asks for.
How this answer will be evaluated
Approach
Framework: Linear Trend Analysis, Hypothesis Testing (t-test), Linear Programming. (a) calculate: given > formula > substitution > result with units > interpretation | (b(i)) examine: intro > how/why with reasoning > evidence > conclusion | (b(ii)) examine: intro > how/why with reasoning > evidence > conclusion | (c(i)) calculate: given > formula > substitution > result with units > interpretation | (c(ii)) analyse: intro > causes > effects > stakeholders/linkages > way forward Full marks: Precise calculations, correct statistical tests, and rigorous LPP solution with shadow price analysis.
Key points expected
- Calculate mean year and mean demand
- Compute slope and intercept for trend line
- Substitute 2025 into the trend equation
- Provide final forecast value in Megawatts
- State H0 and H1 for two-sample t-test
- Calculate means and standard deviations
- Compute t-statistic and degrees of freedom
- Compare t-value with 0.025 critical value
Evaluation rubric
Each sub-part is marked on its own, against the marks and word limit printed on the paper.
- (a) Forecast 2025 demand using linear trend line. 15 marks
calculate— given → formula → substitution → result with units → interpretation
Must cover
- Calculate mean year and mean demand
- Compute slope and intercept for trend line
- Substitute 2025 into the trend equation
- Provide final forecast value in Megawatts
Loses marks
- Using simple average instead of regression
- Arithmetic errors in slope calculation
Earns more
- Show calculation of sum of xy and x2
- Plot or describe the trend line graph
- Mention R-squared or fit quality
Extra mark
- Compare forecast with actual 2024 data
- (b(i)) Test if Feed B is more effective (independent samples).
examine— intro → how/why with reasoning → evidence → conclusion
Must cover
- State H0 and H1 for two-sample t-test
- Calculate means and standard deviations
- Compute t-statistic and degrees of freedom
- Compare t-value with 0.025 critical value
Loses marks
- Using paired t-test for independent samples
- Incorrect degrees of freedom calculation
Earns more
- Explicitly state assumption of equal variances
- Show formula for pooled standard deviation
Extra mark
- Mention effect size or practical significance
- (b(ii)) Test effectiveness assuming same animals (paired samples).
examine— intro → how/why with reasoning → evidence → conclusion
Must cover
- Calculate differences between Feed A and B
- Compute mean and SD of differences
- Calculate paired t-statistic
- Compare with 0.01 critical value
Loses marks
- Treating data as independent in this part
- Using wrong significance level (0.025)
Earns more
- Show table of differences (d) and d2
- State conclusion regarding 0.01 significance
Extra mark
- Discuss why paired test is more sensitive
- (c(i)) Formulate and solve LPP for optimal product mix.
calculate— given → formula → substitution → result with units → interpretation
Must cover
- Define decision variables X, Y, Z
- Write objective function to maximize profit
- List raw material and labor constraints
- Solve for optimal values of X, Y, Z
Loses marks
- Incorrect inequality signs in constraints
- Solution violating resource limits
Earns more
- Use graphical method or simplex table
- Calculate total maximum profit value
Extra mark
- Identify binding vs non-binding constraints
- (c(ii)) Analyze inclusion of new product W.
analyse— intro → causes → effects → stakeholders/linkages → way forward
Must cover
- Calculate shadow prices from optimal solution
- Compute opportunity cost of product W
- Compare W's profit with opportunity cost
- State final recommendation to include or not
Loses marks
- Ignoring shadow prices in decision
- Recommending W without cost comparison
Earns more
- Show calculation of reduced cost for W
- Explain economic meaning of shadow price
Extra mark
- Sensitivity analysis on W's profit margin
Practice this exact question
Write your answer and it is marked point by point against the model answer above — what you covered, what you missed, what you got wrong.
Evaluate my answer →More from Management 2025 Paper II
- Q1 (a) A train is scheduled to arrive at a station at a random time between 09:00 AM and 09:…
- Q2 (a) The electrical power demand of TATA Power Corporation from 2018 to 2024, measured in…
- Q3 3.(a) A company has an annual demand of 1600 units for an item, whose unit cost is ₹70/-.…
- Q4 4.(a) (i) "Expert Systems play a significant role in Organisations." Discuss it giving at…
- Q5 (a) "Have various Chambers of Commerce and other Industry Associations played their desir…