Paper I — Q6
(a) A perfectly plastic material having yield strength of 300 MPa is subjected to extrusion at 400 °C. The extrusion speed is 300…
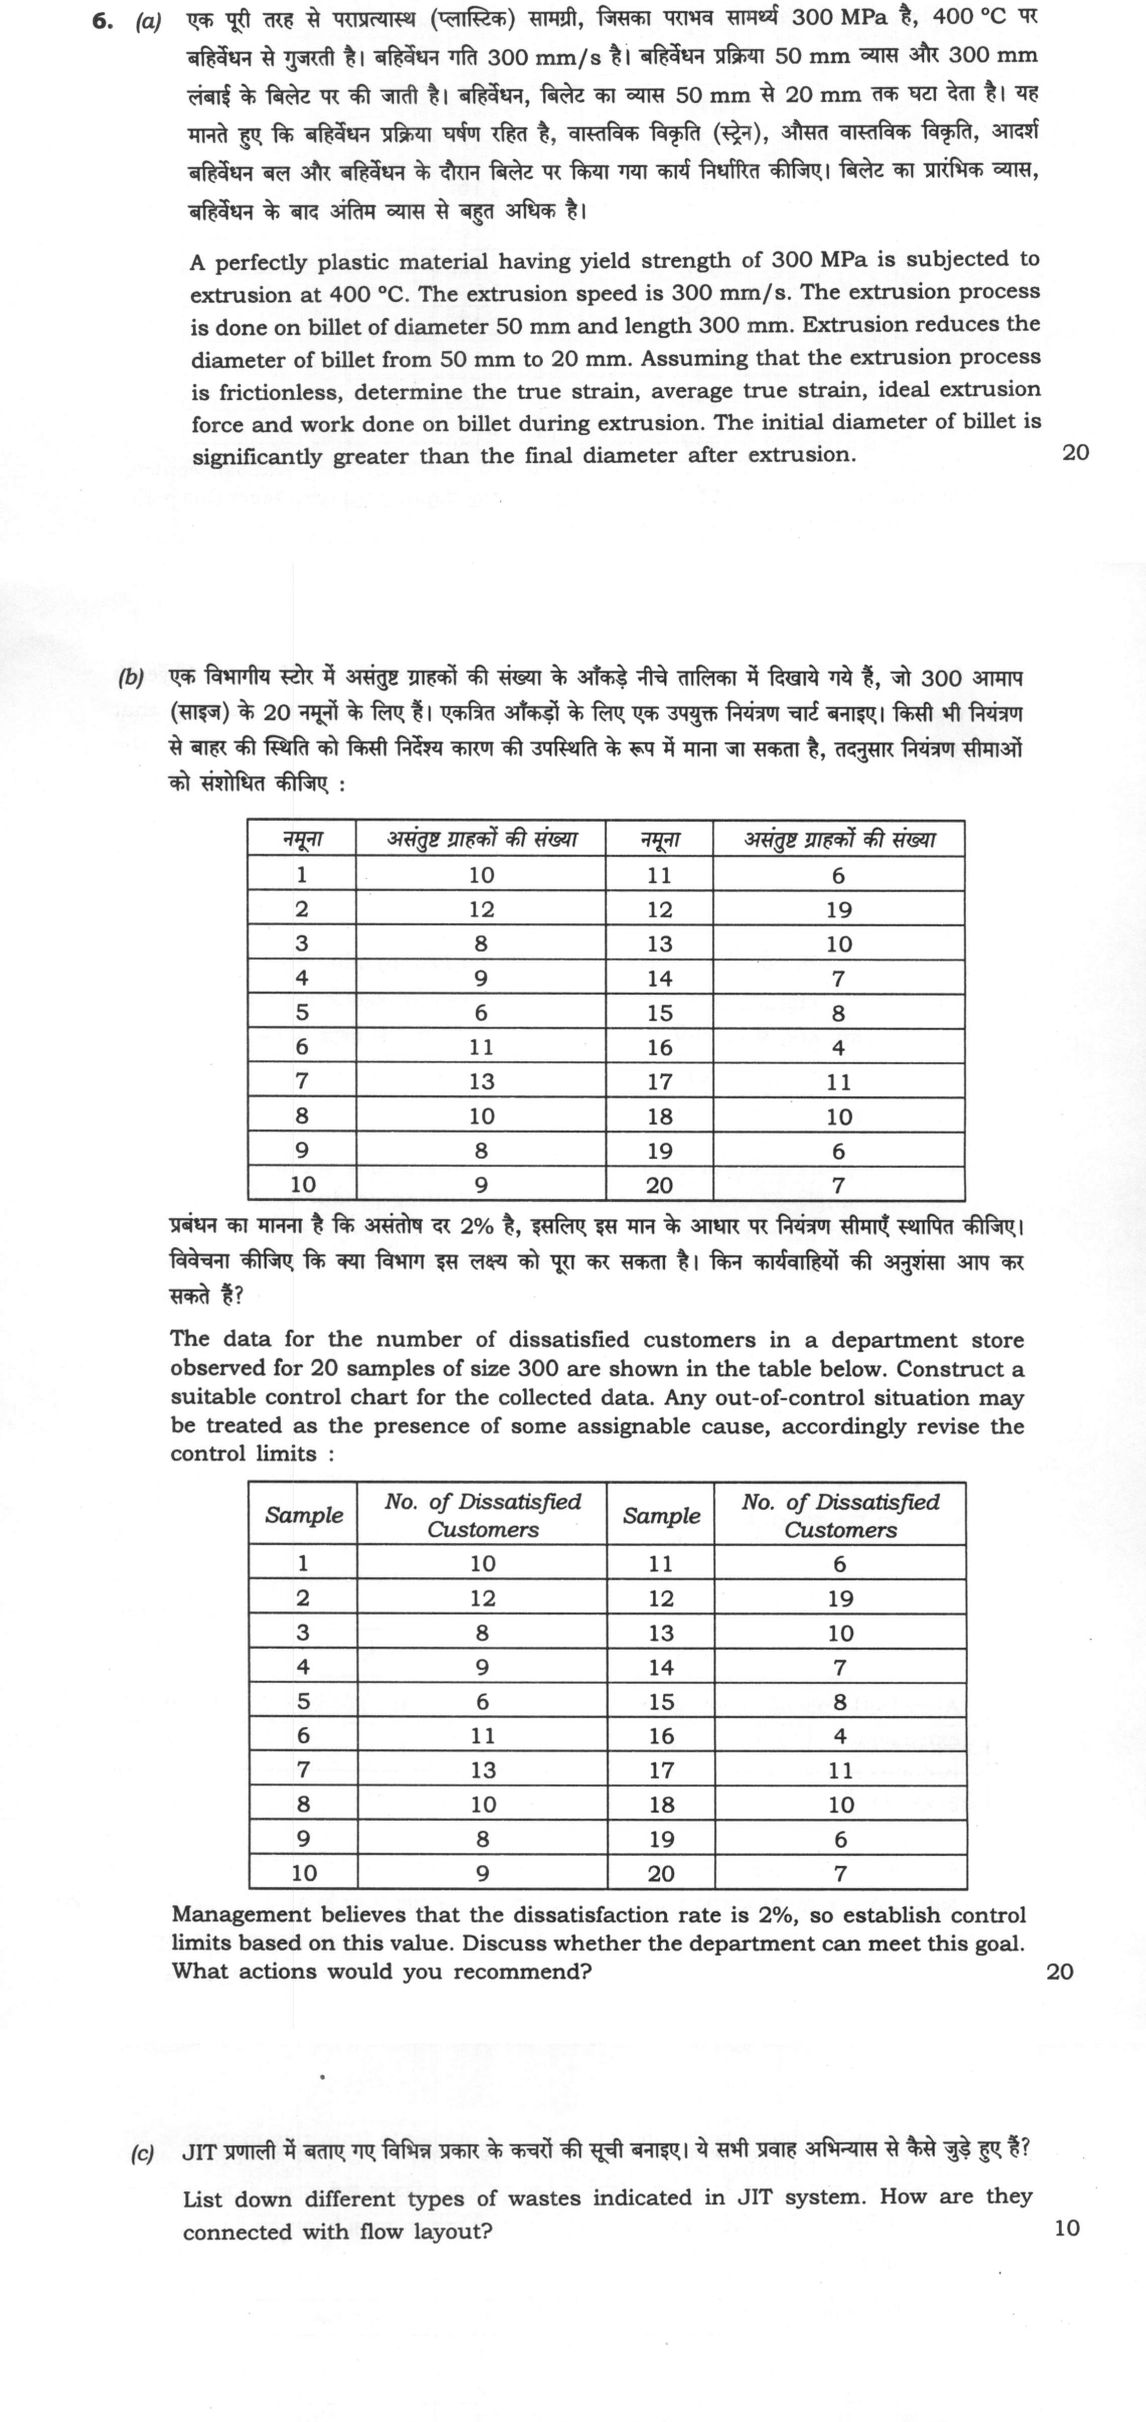
A perfectly plastic material having yield strength of 300 MPa is subjected to extrusion at 400 °C. The extrusion speed is 300 mm/s. The extrusion process is done on billet of diameter 50 mm and length 300 mm. Extrusion reduces the diameter of billet from 50 mm to 20 mm. Assuming that the extrusion process is frictionless, determine the true strain, average true strain, ideal extrusion force and work done on billet during extrusion. The initial diameter of billet is significantly greater than the final diameter after extrusion. 20 marks
The data for the number of dissatisfied customers in a department store observed for 20 samples of size 300 are shown in the table below. Construct a suitable control chart for the collected data. Any out-of-control situation may be treated as the presence of some assignable cause, accordingly revise the control limits:
| Sample | No. of Dissatisfied Customers | Sample | No. of Dissatisfied Customers |
|---|---|---|---|
| 1 | 10 | 11 | 6 |
| 2 | 12 | 12 | 19 |
| 3 | 8 | 13 | 10 |
| 4 | 9 | 14 | 7 |
| 5 | 6 | 15 | 8 |
| 6 | 11 | 16 | 4 |
| 7 | 13 | 17 | 11 |
| 8 | 10 | 18 | 10 |
| 9 | 8 | 19 | 6 |
| 10 | 9 | 20 | 7 |
Management believes that the dissatisfaction rate is 2%, so establish control limits based on this value. Discuss whether the department can meet this goal. What actions would you recommend? 20 marks
List down different types of wastes indicated in JIT system. How are they connected with flow layout? 10 marks
हिंदी में प्रश्न पढ़ें
एक पूरी तरह से पराप्रत्यास्थ (प्लास्टिक) सामग्री, जिसका प्रारंभ सामर्थ्य 300 MPa है, 400 °C पर बहिवेधन से गुजरती है। बहिवेधन गति 300 mm/s है। बहिवेधन प्रक्रिया 50 mm व्यास और 300 mm लंबाई के बिलेट पर की जाती है। बहिवेधन, बिलेट का व्यास 50 mm से 20 mm तक घटा देता है। यह मानते हुए कि बहिवेधन प्रक्रिया घर्षण रहित है, वास्तविक विकृति (स्ट्रेन), औसत वास्तविक विकृति, आदर्श बहिवेधन बल और बहिवेधन के दौरान बिलेट पर किया गया कार्य निर्धारित कीजिए। बिलेट का प्रारंभिक व्यास, बहिवेधन के बाद अंतिम व्यास से बहुत अधिक है। (20 अंक)
एक विभागीय स्टोर में असंतुष्ट ग्राहकों की संख्या के आँकड़े नीचे तालिका में दिखाए गए हैं, जो 300 आमाप (साइज़) के 20 नमूनों के लिए हैं। एकत्रित आँकड़ों के लिए एक उपयुक्त नियंत्रण चार्ट बनाइए। किसी भी नियंत्रण से बाहर की स्थिति को किसी निर्देश्य कारण की उपस्थिति के रूप में माना जा सकता है, तदनुसार नियंत्रण सीमाओं को संशोधित कीजिए:
| नमूना | असंतुष्ट ग्राहकों की संख्या | नमूना | असंतुष्ट ग्राहकों की संख्या |
|---|---|---|---|
| 1 | 10 | 11 | 6 |
| 2 | 12 | 12 | 19 |
| 3 | 8 | 13 | 10 |
| 4 | 9 | 14 | 7 |
| 5 | 6 | 15 | 8 |
| 6 | 11 | 16 | 4 |
| 7 | 13 | 17 | 11 |
| 8 | 10 | 18 | 10 |
| 9 | 8 | 19 | 6 |
| 10 | 9 | 20 | 7 |
प्रबंधन का मानना है कि असंतोष दर 2% है, इसलिए इस मान के आधार पर नियंत्रण सीमाएँ स्थापित कीजिए। विवेचना कीजिए कि क्या विभाग इस लक्ष्य को पूरा कर सकता है। किन कार्यवाहियों की अनुशंसा आप कर सकते हैं? (20 अंक)
JIT प्रणाली में बताए गए विभिन्न प्रकार के कचरे की सूची बनाइए। ये सभी प्रवाह अभिन्यास से कैसे जुड़े हुए हैं? (10 अंक)
The figure this question refers to, in words
The question paper is a scan and the diagram did not survive as text. This is the figure as read from the original page — every component, value and label — so the question can be worked from the text below.
(b) Table: Data for the number of dissatisfied customers in a department store observed for 20 samples of size 300.
Columns: Sample, No. of Dissatisfied Customers, Sample, No. of Dissatisfied Customers
Rows: 1, 10, 11, 6 2, 12, 12, 19 3, 8, 13, 10 4, 9, 14, 7 5, 6, 15, 8 6, 11, 16, 4 7, 13, 17, 11 8, 10, 18, 10 9, 8, 19, 6 10, 9, 20, 7
(c) A two-dimensional Cartesian coordinate system with a grid. The horizontal axis is labeled 'X' with the text 'इकाई' (Unit) below it, and the vertical axis is labeled 'Y' with the text 'इकाई' (Unit) to its left. Both axes have tick marks and labels from 100 to 700 in increments of 100. Four points are plotted on the grid, each marked with a circle and a letter:
- Point A is located at coordinates (125, 550).
- Point B is located at coordinates (350, 400).
- Point C is located at coordinates (450, 125).
- Point D is located at coordinates (700, 300).
To the right of the graph is a table with the heading '(दूरी निर्देशांक कोष्ठक में हैं)' which translates to '(Distance coordinates are in brackets)'. The table has three columns: 'आपूर्ति बिंदु' (Supply Point), 'निर्देशांक (इकाई)' (Coordinates (Unit)), and 'वार्षिक आपूर्ति (टन)' (Annual Supply (Ton)). The rows contain the following data:
- Row 1: A, (125, 550), 200
- Row 2: B, (350, 400), 450
- Row 3: C, (450, 125), 175
- Row 4: D, (700, 300), 350
Model answer
Written by UPSC Answer Check against this question's marking rubric, to the expected length. UPSC does not publish answers for Mains — this is one way to score well, not an official key.
(a) Given D0=50 mm, Df=20 mm, L0=300 mm, Y=300 MPa=300 N/mm². A=πD²/4, so A0=625π mm², Af=100π mm², A0/Af=25/4=6.25, V=A0L0=187500π mm³. Assumptions: incompressible, homogeneous, frictionless, perfectly plastic, no strain hardening; 400 °C fixes flow stress.
True strain by logarithmic strain and volume constancy: ε=ln(A0/Af)=ln(25/4)=1.8326.
For axisymmetric incompressible deformation, principal strains are ε1=ε, ε2=ε3=-ε/2. The average true strain, taken as the mean of the magnitudes of the three principal true strains, is ε_avg=(ε+ε/2+ε/2)/3=2ε/3=2/3 ln(25/4)=1.2217.
Ideal frictionless extrusion pressure from the energy/upper-bound method: p=Yε=300×1.8326=549.77 MPa. Since ε=(3/2)ε_avg, the ram force is F=pA0=A0Yε=(3/2)A0Yε_avg=187500π ln(25/4) N=1.0795 MN.
Work by the energy integral: W=∫Y dε dV=YVε=300×187500π×ln(25/4) N mm=56250000π ln(25/4) N mm=56250π ln(25/4) J=323.84 kJ. For complete extrusion the ram stroke is L0=0.300 m, because the ram sweeps the initial billet volume A0L0; hence W=FL0 gives the same value. The given speed is not needed for work.
Final: ε=1.8326, ε_avg=1.2217, F=1.0795 MN, W=323.84 kJ.
(b) Use an np-chart: plot the 20 counts against sample number with 3-sigma limits. This is suitable because n=300 is constant, the data are counts of nonconforming customers, observations are independent, and the count is approximately binomial; n=300 supports the normal approximation.
Initial limits: Σd=184, m=20, p̄=184/(20×300)=0.030667. CL=np̄=300×0.030667=9.20 customers. σ=√(np̄(1-p̄))=√(300×0.030667×0.969333)=2.986. UCL=9.20+3×2.986=18.16, LCL=9.20-3×2.986=0.24. Sample 12 has 19, above UCL; treat it as an assignable cause and remove it.
Revised limits: Σd=165, m=19, p̄'=165/(19×300)=0.028947. CL'=165/19=8.68. σ'=√(300×0.028947×0.971053)=2.904. UCL'=8.68+3×2.904=17.40, LCL'=8.68-3×2.904=-0.03, set to 0. All remaining samples lie within 0 to 17.40.
For the management target p0=0.02, fixed np-chart limits: CL0=np0=300×0.02=6. σ0=√(300×0.02×0.98)=√5.88=2.425. UCL0=6+3×2.425=13.27, LCL0=6-3×2.425=-1.27, set to 0. Equivalently, the p-chart limits are LCL=0, CL=0.02, UCL=0.04425.
The revised process mean is 8.68 dissatisfied customers per 300, i.e. 2.895%, above the 2% target. The process is in control after removing sample 12, but it does not meet the goal because the target centre line 6 is below the process centre line 8.68. The department cannot currently meet the goal without improvement.
Actions: investigate high-count samples for assignable causes; use Pareto and cause-effect analysis; improve complaint handling, service recovery, waiting times, and billing accuracy; train staff; redesign the service process; monitor with revised limits during improvement; once the average is ≤6 per 300, use the 2% target limits for ongoing control.
Final: revised np limits 0 to 17.40; target np limits 0 to 13.27; current mean 8.68/300, so the 2% goal is not met.
(c) JIT wastes (muda):
- Overproduction: making more or earlier than needed.
- Waiting: idle time for material, machines, or information.
- Transportation: unnecessary movement of material.
- Over-processing: extra operations not required by the customer.
- Inventory: excess raw material, WIP, or finished goods.
- Motion: unnecessary movement of people or equipment.
- Defects: rework, scrap, or complaints.
- Unused talent: underuse of employee skills and suggestions.
Connection with flow layout:
- A flow layout places workstations in the order of value-adding operations, so material moves in one continuous direction.
- It reduces transportation and motion by short, direct paths.
- It reduces waiting and inventory by enabling one-piece or small-lot flow and quick changeovers.
- It exposes defects and over-processing quickly, allowing immediate correction.
- It supports pull and levelled production, preventing overproduction.
Final: flow layout reduces JIT wastes by making material flow continuous and exposing non-value-adding steps.
What "Calculate" is asking you to do
Apply the standard formula or schedule to data the question has already supplied — a table of readings, cost records, a balance sheet — and produce the number. The method is rarely in doubt; the marks sit in the named intermediate quantities, each of which has to appear as a labelled line.
Structure that answers it
Data as given → formula or standard treatment, named → substitution → each intermediate, labelled → result with units
Where marks are lost
Omitting an intermediate the marking scheme pays for separately, or rounding at an intermediate line so the final figure drifts. In commerce and accountancy, any figure in a statement that no numbered working note supports is treated as unearned.
How this answer will be evaluated
Approach
(a) calculate: given > formula > substitution > result with units > interpretation | (b) analyse: intro > causes > effects > stakeholders/linkages > way forward | (c) explain: definition/context > points in order > small example > short close Full marks: Rigorous calculations with clear assumptions; precise statistical analysis with correct chart selection; comprehensive JIT explanation.
Key points expected
- Calculate true strain using ln(D1/D2) or ln(A1/A2)
- Calculate average true strain as (D1/D2 - 1)
- Determine ideal extrusion force using F = σ * A1 * ε
- Calculate work done as Force × Displacement
- Calculate p-bar and establish initial control limits
- Identify out-of-control points (e.g., Sample 12)
- Recalculate limits excluding assignable causes
- Compare process capability to the 2% management goal
Evaluation rubric
Each sub-part is marked on its own, against the marks and word limit printed on the paper.
- (a) Compute true strain, average strain, ideal force, and work for frictionless extrusion. 20 marks
calculate— given → formula → substitution → result with units → interpretation
Must cover
- Calculate true strain using ln(D1/D2) or ln(A1/A2)
- Calculate average true strain as (D1/D2 - 1)
- Determine ideal extrusion force using F = σ * A1 * ε
- Calculate work done as Force × Displacement
Loses marks
- Using engineering strain instead of true strain
- Omitting units in final results
Earns more
- Explicitly states frictionless assumption
- Shows dimensional consistency in force calculation
- Identifies initial and final cross-sectional areas
Extra mark
- Schematic of billet before and after extrusion
- (b) Construct p-chart, identify assignable causes, and evaluate against 2% target. 20 marks
analyse— intro → causes → effects → stakeholders/linkages → way forward
Must cover
- Calculate p-bar and establish initial control limits
- Identify out-of-control points (e.g., Sample 12)
- Recalculate limits excluding assignable causes
- Compare process capability to the 2% management goal
Loses marks
- Using c-chart or u-chart instead of p-chart
- Failing to revise limits after removing outliers
Earns more
- Correct calculation of standard deviation for p-chart
- Logical discussion of assignable causes
- Specific recommendations for process improvement
Extra mark
- Visual representation of the control chart
- (c) List JIT wastes and explain their connection to flow layout. 10 marks
explain— definition/context → points in order → small example → short close
Must cover
- List at least 5 types of JIT wastes (e.g., overproduction, waiting)
- Define flow layout in the context of JIT
- Explain how flow layout minimizes specific wastes
Loses marks
- Listing wastes without connecting them to layout
- Confusing JIT with general lean manufacturing
Earns more
- Mentioning the '7 Wastes' (Muda) specifically
- Linking layout to reduced material handling
Extra mark
- Diagram of a flow layout vs process layout
Practice this exact question
Write your answer and it is marked point by point against the model answer above — what you covered, what you missed, what you got wrong.
Evaluate my answer →More from Mechanical Engineering 2024 Paper I
- Q3 (a) Show the loading on the beams corresponding to the bending moment diagrams shown belo…
- Q4 (a) A governor of Hartnell type has each ball of weight 20 N and the lengths of vertical…
- Q5 (a) A cutting tool is used to machine alloy steel at cutting speed of 40 m/min. Consideri…
- Q6 (a) A perfectly plastic material having yield strength of 300 MPa is subjected to extrusi…
- Q7 (a) An orthogonal cutting of metal is performed using cutting speed of 120 m/min, tool ra…
- Q8 (a) Explain the principle of electric discharge machining (EDM) using suitable diagram. D…