Paper II — Q4
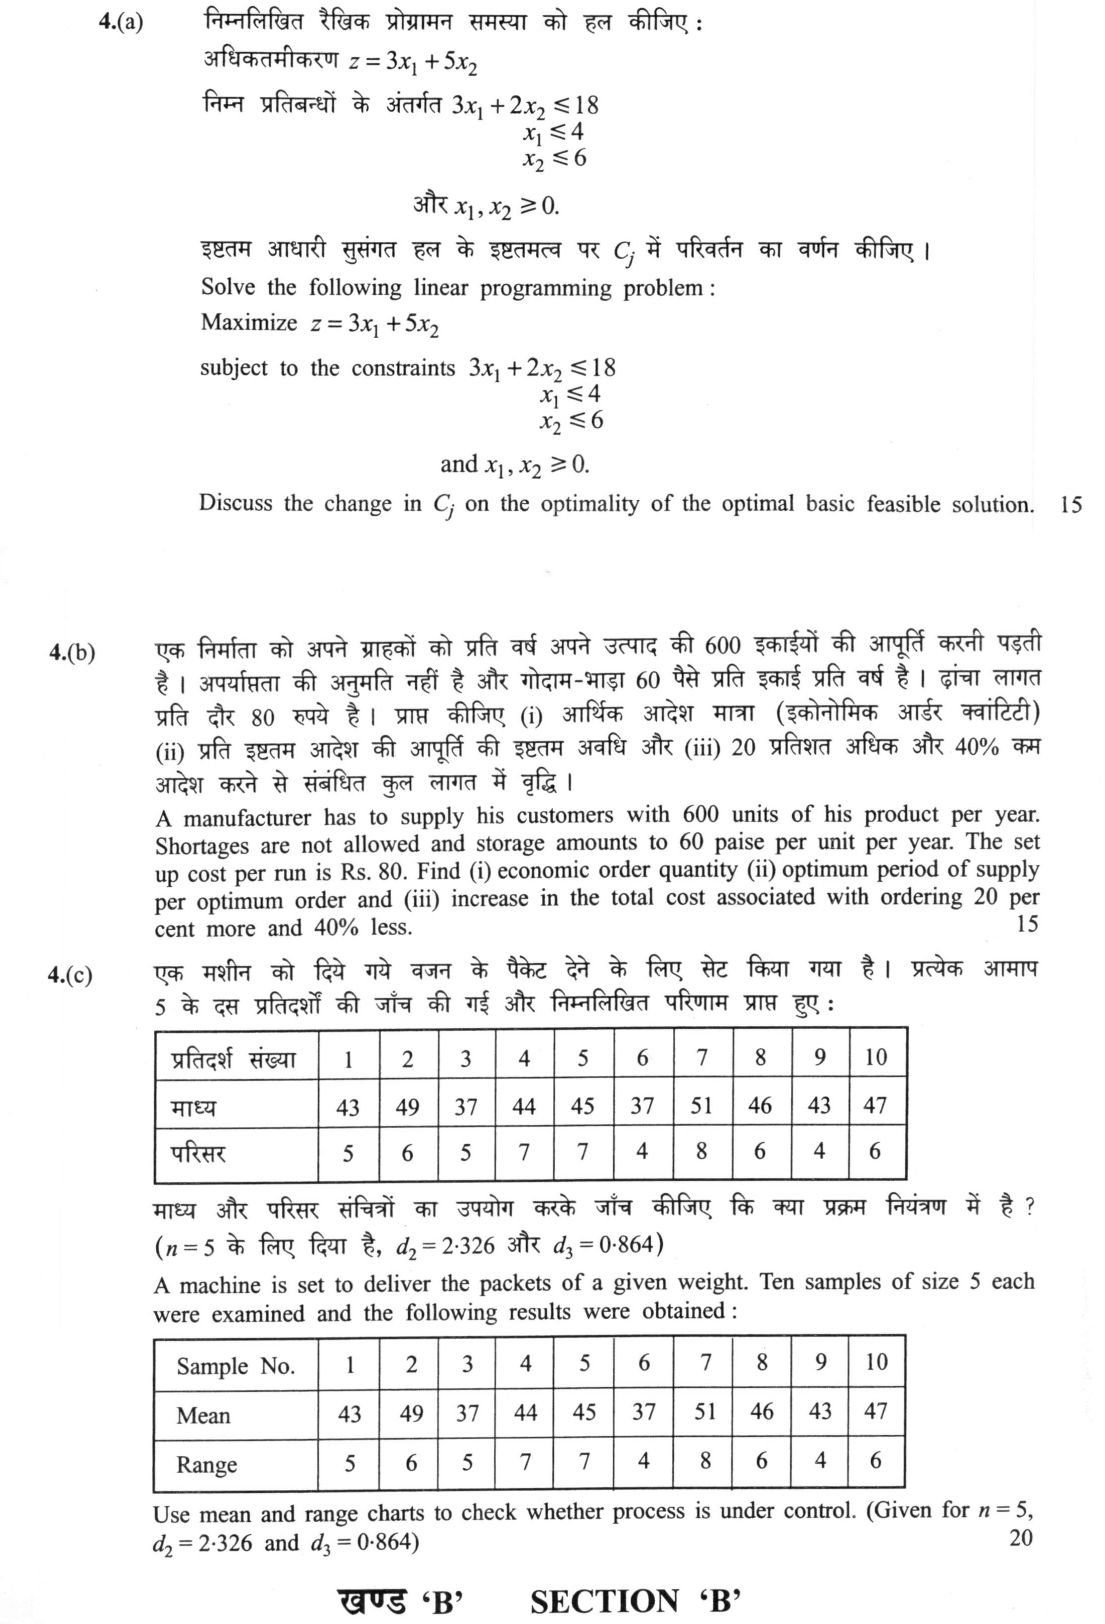
(a) Solve the following linear programming problem: Maximize z = 3x₁ + 5x₂ subject to the constraints 3x₁ + 2x₂ ≤ 18 x₁ ≤ 4 x₂ ≤…
Solve the following linear programming problem: Maximize z = 3x₁ + 5x₂ subject to the constraints 3x₁ + 2x₂ ≤ 18 x₁ ≤ 4 x₂ ≤ 6 and x₁, x₂ ≥ 0. Discuss the change in Cⱼ on the optimality of the optimal basic feasible solution. 15 marks
A manufacturer has to supply his customers with 600 units of his product per year. Shortages are not allowed and storage amounts to 60 paise per unit per year. The set up cost per run is Rs. 80. Find (i) economic order quantity (ii) optimum period of supply per optimum order and (iii) increase in the total cost associated with ordering 20 per cent more and 40% less. 15 marks
A machine is set to deliver the packets of a given weight. Ten samples of size 5 each were examined and the following results were obtained:
| Sample No. | 1 | 2 | 3 | 4 | 5 | 6 | 7 | 8 | 9 | 10 |
|---|---|---|---|---|---|---|---|---|---|---|
| Mean | 43 | 49 | 37 | 44 | 45 | 37 | 51 | 46 | 43 | 47 |
| Range | 5 | 6 | 5 | 7 | 7 | 4 | 8 | 6 | 4 | 6 |
Use mean and range charts to check whether process is under control. (Given for n = 5, d₂ = 2·326 and d₃ = 0·864) 20 marks
हिंदी में प्रश्न पढ़ें
निम्नलिखित रैखिक प्रोग्रामन समस्या को हल कीजिए : अधिकतमीकरण z = 3x₁ + 5x₂ निम्न प्रतिबंधों के अंतर्गत 3x₁ + 2x₂ ≤ 18 x₁ ≤ 4 x₂ ≤ 6 और x₁, x₂ ≥ 0. इष्टतम आधारी सुसंगत हल के इष्टतमत्व पर Cⱼ में परिवर्तन का वर्णन कीजिए । (15 अंक)
एक निर्माता को अपने ग्राहकों को प्रति वर्ष अपने उत्पाद की 600 इकाइयों की आपूर्ति करनी पड़ती है। अपयाप्तता की अनुमति नहीं है और गोदाम-भाड़ा 60 पैसे प्रति इकाई प्रति वर्ष है। झोंका लागत प्रति दौर 80 रुपये है। प्राप्त कीजिए (i) आर्थिक आदेश मात्रा (इकोनोमिक ऑर्डर क्वांटिटी) (ii) प्रति इष्टतम आदेश की आपूर्ति की इष्टतम अवधि और (iii) 20 प्रतिशत अधिक और 40% कम आदेश करने से संबंधित कुल लागत में वृद्धि। (15 अंक)
एक मशीन को दिये गये वजन के पैकेट देने के लिए सेट किया गया है। प्रत्येक आमाप 5 के दस प्रतिदर्शों की जाँच की गई और निम्नलिखित परिणाम प्राप्त हुए :
| प्रतिदर्श संख्या | 1 | 2 | 3 | 4 | 5 | 6 | 7 | 8 | 9 | 10 |
|---|---|---|---|---|---|---|---|---|---|---|
| माध्य | 43 | 49 | 37 | 44 | 45 | 37 | 51 | 46 | 43 | 47 |
| परिसर | 5 | 6 | 5 | 7 | 7 | 4 | 8 | 6 | 4 | 6 |
माध्य और परिसर सांचित्रों का उपयोग करके जाँच कीजिए कि क्या प्रक्रम नियंत्रण में है ? (n = 5 के लिए दिया है, d₂ = 2·326 और d₃ = 0·864) (20 अंक)
Model answer
Written by UPSC Answer Check against this question's marking rubric, to the expected length. UPSC does not publish answers for Mains — this is one way to score well, not an official key.
(a) The feasible extreme points are:
- (0,0): z = 0
- (4,0): z = 12
- (4,3): z = 3×4 + 5×3 = 27
- (2,6): z = 3×2 + 5×6 = 36
- (0,6): z = 30
Hence the optimal basic feasible solution is x₁ = 2, x₂ = 6, z_max = 36.
Add slacks: 3x₁ + 2x₂ + s₁ = 18, x₁ + s₂ = 4, x₂ + s₃ = 6. At the optimum, s₁ = 0, s₂ = 2, s₃ = 0. Basic variables are x₁, x₂, s₂; nonbasic variables are s₁, s₃. Solving: x₂ = 6 − s₃, x₁ = 2 − (1/3)s₁ + (2/3)s₃, s₂ = 2 + (1/3)s₁ − (2/3)s₃.
Let objective coefficients be c₁, c₂, c₃, c₄, c₅ for x₁, x₂, s₁, s₂, s₃. Then: z = c₁x₁ + c₂x₂ + c₃s₁ + c₄s₂ + c₅s₃ = (2c₁ + 6c₂ + 2c₄) + [c₃ − c₁/3 + c₄/3]s₁ + [c₅ + 2c₁/3 − c₂ − 2c₄/3]s₃. For a maximum, nonbasic reduced costs must be ≤ 0: c₃ − c₁/3 + c₄/3 ≤ 0 => c₁ ≥ 3c₃ + c₄, c₅ + 2c₁/3 − c₂ − 2c₄/3 ≤ 0 => 3c₂ ≥ 2c₁ − 2c₄ + 3c₅. With zero slack costs c₃ = c₄ = c₅ = 0, these become c₁ ≥ 0 and c₂ ≥ 2c₁/3.
Thus if c₂ = 5, the optimal BFS remains optimal for 0 ≤ c₁ ≤ 15/2. If c₁ < 0, s₁ enters; if c₁ > 15/2, s₃ enters. If c₁ = 3, it remains optimal for c₂ ≥ 2. If c₂ < 2, s₃ enters; at c₂ = 2, alternate optima exist.
(b)(i) D = 600 units/year, C₀ = Rs 80 per run, C_h = 60 paise = Rs 0.60 per unit per year. EOQ: Q* = √(2DC₀/C_h) = √(2×600×80/0.60) = √(160000) = 400 units.
(b)(ii) Optimum period: T* = Q*/D = 400/600 = 2/3 year = 8 months.
(b)(iii) Total cost at Q*: TC_min = √(2DC₀C_h) = √(2×600×80×0.60) = Rs 240 per year. For 20% more, Q = 480: TC = 600×80/480 + 480×0.60/2 = 100 + 144 = Rs 244. Increase = 244 − 240 = Rs 4 per year. For 40% less, Q = 240: TC = 600×80/240 + 240×0.60/2 = 200 + 72 = Rs 272. Increase = 272 − 240 = Rs 32 per year.
(c) Grand mean: X̄̄ = (43 + 49 + 37 + 44 + 45 + 37 + 51 + 46 + 43 + 47)/10 = 442/10 = 44.2. Average range: R̄ = (5 + 6 + 5 + 7 + 7 + 4 + 8 + 6 + 4 + 6)/10 = 58/10 = 5.8.
For n = 5, d₂ = 2.326, d₃ = 0.864. Estimated σ = R̄/d₂ = 5.8/2.326 = 2.4936.
Mean chart limits: UCL_X = X̄̄ + 3σ/√n = 44.2 + 3×2.4936/√5 = 44.2 + 3.3455 = 47.5455. LCL_X = 44.2 − 3.3455 = 40.8545. So mean limits are 40.8545 to 47.5455. Sample means: 43, 49, 37, 44, 45, 37, 51, 46, 43, 47. Samples 2, 3, 6, 7 fall outside the mean limits, so the mean chart shows lack of control.
Range chart limits: UCL_R = R̄ + 3d₃σ = 5.8 + 3×0.864×2.4936 = 5.8 + 6.4633 = 12.2633. LCL_R = 5.8 − 6.4633 = −0.6633, taken as 0. Thus range limits are 0 to 12.2633. All sample ranges, 5, 6, 5, 7, 7, 4, 8, 6, 4, 6, lie inside these limits.
Therefore the range chart indicates control of variability, but the mean chart indicates the process mean is not under control. Hence the process is not under control overall.
What "Solve" is asking you to do
Choose the method, then carry it through to a final answer. Identifying what kind of problem this is and why that method applies is the first thing marked; a correct figure arrived at invisibly earns almost nothing.
Structure that answers it
Given data and what is required → method chosen, with the reason it applies → set-up (equation, circuit, free body, trial balance) → working, step by step → answer with units and any condition of validity
Where marks are lost
Doing the middle steps mentally and writing only the result. In mathematics papers, a further loss comes from giving a decimal where the exact value in surds or fractions was wanted, or from skipping the justification a part explicitly asks for.
How this answer will be evaluated
Approach
Framework: Operations Research / Management Science. (a) discuss: intro > 3-4 dimensions > example > balanced close | (b) calculate: given > formula > substitution > result with units > interpretation | (c) examine: intro > how/why with reasoning > evidence > conclusion Full marks: Flawless calculations, clear sensitivity analysis, and precise control chart interpretation.
Key points expected
- Simplex table iterations to optimal solution
- Optimal values of x1, x2 and z
- Range of optimality for Cj coefficients
- Interpretation of Cj change on optimality
- EOQ formula and substitution (D=600, H=0.6, S=80)
- Optimum supply period calculation
- Total cost for 120% and 60% order quantities
- Comparison of costs to find increase
Evaluation rubric
Each sub-part is marked on its own, against the marks and word limit printed on the paper.
- (a) Solve LPP via simplex and analyze sensitivity of Cj. 15 marks
discuss— intro → 3-4 dimensions → example → balanced close
Must cover
- Simplex table iterations to optimal solution
- Optimal values of x1, x2 and z
- Range of optimality for Cj coefficients
- Interpretation of Cj change on optimality
Loses marks
- Arithmetic errors in simplex pivots
- Missing sensitivity analysis discussion
Earns more
- Correct slack variable handling
- Accurate reduced cost calculation
Extra mark
- Graphical verification of optimal point
- (b) Compute EOQ, supply period, and cost impact of deviations. 15 marks
calculate— given → formula → substitution → result with units → interpretation
Must cover
- EOQ formula and substitution (D=600, H=0.6, S=80)
- Optimum supply period calculation
- Total cost for 120% and 60% order quantities
- Comparison of costs to find increase
Loses marks
- Incorrect EOQ formula application
- Failure to calculate specific cost increases
Earns more
- Correct unit conversion (paise to rupees)
- Clear labeling of cost components
Extra mark
- Graphical representation of total cost curve
- (c) Use mean and range charts to check process control. 20 marks
examine— intro → how/why with reasoning → evidence → conclusion
Must cover
- Calculation of grand mean and average range
- Determination of UCL and LCL for X-bar chart
- Determination of UCL and LCL for R chart
- Conclusion on process control status
Loses marks
- Incorrect control limit formulas
- Missing conclusion on process stability
Earns more
- Correct use of d2 and d3 constants
- Clear tabulation of control limits
Extra mark
- Identification of specific out-of-control points
Practice this exact question
Write your answer and it is marked point by point against the model answer above — what you covered, what you missed, what you got wrong.
Evaluate my answer →More from Statistics 2021 Paper II
- Q1 Explain Single Sampling Plan with the help of an example. Also, write the importance of a…
- Q2 A manufacturer finds that on the average, a television set is used 1.8 hours per day. A o…
- Q3 (a) Explain M|G|1 queuing system. Obtain Pollaczek-kinchine formula. (15 marks) (b) Use M…
- Q4 (a) Solve the following linear programming problem: Maximize z = 3x₁ + 5x₂ subject to the…
- Q5 (a) Explain Zellner's seemingly unrelated regression model and the feasible generalized l…
- Q6 (a) Explain Box-Jenkins methodology to build ARIMA models. (15 marks) (b) Prepare the cos…
- Q7 (a) If c(x, t) denote observed proportion of females in the age group (x, x+t) and f(x, t…