Paper II — Q8
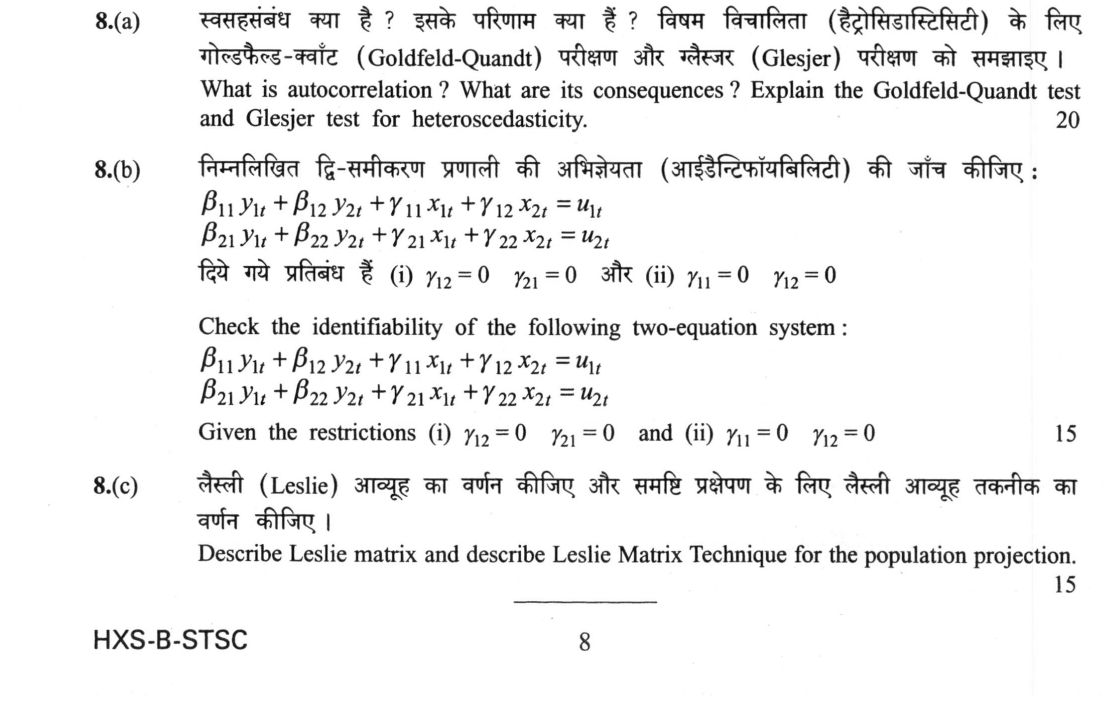
(a) What is autocorrelation ? What are its consequences ? Explain the Goldfeld-Quandt test and Glesjer test for…
What is autocorrelation ? What are its consequences ? Explain the Goldfeld-Quandt test and Glesjer test for heteroscedasticity.
20 marks
Check the identifiability of the following two-equation system :
β₁₁y₁ₜ + β₁₂y₂ₜ + γ₁₁x₁ₜ + γ₁₂x₂ₜ = u₁ₜ β₂₁y₁ₜ + β₂₂y₂ₜ + γ₂₁x₁ₜ + γ₂₂x₂ₜ = u₂ₜ
Given the restrictions (i) γ₁₂ = 0, γ₂₁ = 0 and (ii) γ₁₁ = 0, γ₁₂ = 0
15 marks
Describe Leslie matrix and describe Leslie Matrix Technique for the population projection.
15 marks
हिंदी में प्रश्न पढ़ें
स्वसहसंबंध क्या है ? इसके परिणाम क्या हैं ? विषम विचलितता (हेटेरोस्किडास्टिसिटी) के लिए गोल्डफेल्ड-क्वांट (Goldfeld-Quandt) परीक्षण और ग्लेसजर (Glesjer) परीक्षण को समझाइए ।
(20 अंक)
निम्नलिखित द्वि-समीकरण प्रणाली की अभिज्ञेयता (आइडेंटिफायबिलिटी) की जाँच कीजिए :
β₁₁y₁ₜ + β₁₂y₂ₜ + γ₁₁x₁ₜ + γ₁₂x₂ₜ = u₁ₜ β₂₁y₁ₜ + β₂₂y₂ₜ + γ₂₁x₁ₜ + γ₂₂x₂ₜ = u₂ₜ
दिये गये प्रतिबंध हैं (i) γ₁₂ = 0, γ₂₁ = 0 और (ii) γ₁₁ = 0, γ₁₂ = 0
(15 अंक)
लेस्ली (Leslie) आव्यूह का वर्णन कीजिए और समष्टि प्रक्षेपण के लिए लेस्ली आव्यूह तकनीक का वर्णन कीजिए ।
(15 अंक)
Model answer
Written by UPSC Answer Check against this question's marking rubric, to the expected length. UPSC does not publish answers for Mains — this is one way to score well, not an official key.
Autocorrelation and heteroscedasticity tests. Autocorrelation is serial correlation between disturbance terms in a time-series regression, eₜ correlated with eₜ₋₁; it is different from heteroscedasticity, where error variance changes across observations. If regressors are strictly exogenous and no lagged dependent variable is included, OLS remains unbiased and consistent, but it is no longer efficient. The usual standard errors are biased, often too small, so t- and F-tests overstate significance, R² can look deceptively high, and forecasts are inefficient.
For heteroscedasticity, Goldfeld-Quandt is used when variance is suspected to rise with an ordered variable Z. Order observations by Z, omit the middle c observations, split the remaining data into lower and upper halves, and run the same regression on each half. Let RSS_U and RSS_L be residual sums of squares for the upper and lower ordered groups, the upper group being the suspected higher-variance group. The test statistic is F=(RSS_U/(n_U-k))/(RSS_L/(n_L-k)), compared with the F distribution under H0 of equal variances; a large value rejects H0 in favour of increasing variance. It is simple but needs an ordering variable and loses observations.
The Glesjer test is more general. Estimate the model, take absolute or squared residuals, and regress them on the explanatory variables, e.g. |eᵢ|=α₀+α_1x₁ᵢ+...+α_pxₚᵢ+vᵢ. The null is all αⱼ=0; the auxiliary F-statistic (R²/p)/((1-R²)/(n-p-1)) tests it. Using all observations and testing several variables simultaneously, it is usually more applicable and often more powerful than Goldfeld-Quandt, though it depends on auxiliary specification and can be sensitive to outliers.
Identifiability of the two-equation system. There are two endogenous variables (M=2) and two exogenous variables (K=2), so the order condition for an equation is K-k≥M-1=1, where k is the number of exogenous variables included in that equation. The rank condition requires that the excluded exogenous variables appear in the other equation with coefficients whose rank is at least 1.
Under (i) γ12=0 and γ21=0, equation 1 includes x1 only and excludes x2; equation 2 includes x2 only and excludes x1. For each equation K-k=1, satisfying the order condition. The excluded x2 appears in equation 2 with coefficient γ22, and the excluded x1 appears in equation 1 with coefficient γ11; if these coefficients are non-zero, the rank condition holds. Both equations are therefore exactly identified.
Under (ii) γ11=0 and γ12=0, equation 1 includes no exogenous variable, so K-k=2≥1. The excluded x1 and x2 appear in equation 2 with coefficients γ21 and γ22; if at least one is non-zero, the rank condition holds, so equation 1 is identified, and overidentified when both are non-zero. Equation 2, however, includes both x1 and x2, so K-k=0<1. The order condition fails, and equation 2 is not identified.
Leslie matrix projection. A Leslie matrix is an age-class matrix used to project a population. If there are n age classes, it is n×n: the first row contains age-specific fertility rates Fᵢ, the sub-diagonal contains survival probabilities Pᵢ from class i to i+1, and all other entries are zero. Multiplying the matrix by the current population vector n(t) gives n(t+1)=L n(t); the first row counts births by age group, while the sub-diagonal moves survivors into the next age class. Repeated multiplication, n(t+T)=L^T n(t), gives projections. The dominant eigenvalue λ is the finite rate of increase, and the intrinsic rate of natural increase is r=ln λ; the associated eigenvector gives the stable age distribution. In India, the Registrar General and Census Commissioner of India use age-specific fertility and survival rates from SRS and life tables to project population by age and sex, helping plan health, education and welfare programmes. Thus, valid inference and projection depend on correct assumptions, restrictions, and demographic parameters.
What "Explain" is asking you to do
Make the working of something clear — what sets it off, what follows from what, and what it produces. Explain is the Commission's mechanism word: it dominates the technical papers and the “explain why” stems, where the marks sit in the causal chain and not in the label.
Structure that answers it
State what it is → the initiating condition → the chain of cause, step by step → an instance where it plays out → what the chain produces
Where marks are lost
Describing what something looks like instead of why it works that way. Naming the stages without linking them reads as description too.
How this answer will be evaluated
Approach
Framework: UPSC Statistics Paper 2. (a) explain: definition/context > points in order > small example > short close | (b) examine: intro > how/why with reasoning > evidence > conclusion | (c) describe: define > structure or process in order > labelled diagram > significance Full marks: Precise definitions, correct application of conditions, clear matrix structure, and logical flow.
Key points expected
- Define autocorrelation (serial correlation) in regression context
- List consequences: biased SE, invalid t/F tests, inefficient OLS
- Goldfeld-Quandt: split sample, F-test on RSS ratio
- Glesjer: regress residuals on suspected variable, F-test
- State the Order Condition (K - Ki >= Mi - 1)
- Apply Order Condition to restriction set (i)
- Apply Order Condition to restriction set (ii)
- Conclude on identifiability (identified/under-identified) for each case
Evaluation rubric
Each sub-part is marked on its own, against the marks and word limit printed on the paper.
- (a) Define autocorrelation, list consequences, and detail Goldfeld-Quandt and Glesjer tests. 20 marks
explain— definition/context → points in order → small example → short close
Must cover
- Define autocorrelation (serial correlation) in regression context
- List consequences: biased SE, invalid t/F tests, inefficient OLS
- Goldfeld-Quandt: split sample, F-test on RSS ratio
- Glesjer: regress residuals on suspected variable, F-test
Loses marks
- Confusing autocorrelation with multicollinearity
- Failing to state the null hypothesis for the tests
Earns more
- Mention Durbin-Watson as a related diagnostic
- Distinguish between heteroscedasticity and autocorrelation clearly
Extra mark
- Mention Breusch-Pagan as an alternative to Glesjer
- (b) Check identifiability of the two-equation system under two specific restriction sets. 15 marks
examine— intro → how/why with reasoning → evidence → conclusion
Must cover
- State the Order Condition (K - Ki >= Mi - 1)
- Apply Order Condition to restriction set (i)
- Apply Order Condition to restriction set (ii)
- Conclude on identifiability (identified/under-identified) for each case
Loses marks
- Applying the condition to the wrong equation
- Failing to distinguish between the two restriction sets
Earns more
- Explicitly count endogenous (M) and exogenous (K) variables
- Mention the Rank Condition as the sufficient condition
Extra mark
- Show the matrix form of the restrictions
- (c) Define the Leslie matrix and explain its application in population projection. 15 marks
describe— define → structure or process in order → labelled diagram → significance
Must cover
- Define Leslie matrix structure (fertility in top row, survival in sub-diagonal)
- Explain the vector multiplication for projection (n+1 = L * n)
- Describe the components: age-specific fertility and survival rates
- Mention the steady-state growth rate (dominant eigenvalue)
Loses marks
- Confusing Leslie matrix with a general transition matrix
- Failing to explain the biological meaning of the matrix elements
Earns more
- Provide a small numerical example (e.g., 3x3 matrix)
- Discuss the assumptions (closed population, constant rates)
Extra mark
- Mention the stable age distribution
Practice this exact question
Write your answer and it is marked point by point against the model answer above — what you covered, what you missed, what you got wrong.
Evaluate my answer →More from Statistics 2021 Paper II
- Q5 (a) Explain Zellner's seemingly unrelated regression model and the feasible generalized l…
- Q6 (a) Explain Box-Jenkins methodology to build ARIMA models. (15 marks) (b) Prepare the cos…
- Q7 (a) If c(x, t) denote observed proportion of females in the age group (x, x+t) and f(x, t…
- Q8 (a) What is autocorrelation ? What are its consequences ? Explain the Goldfeld-Quandt tes…