Paper I — Q6
(a) In a set of two-way classified data according to k levels of factor A and r levels of factor B, there is one observation in…
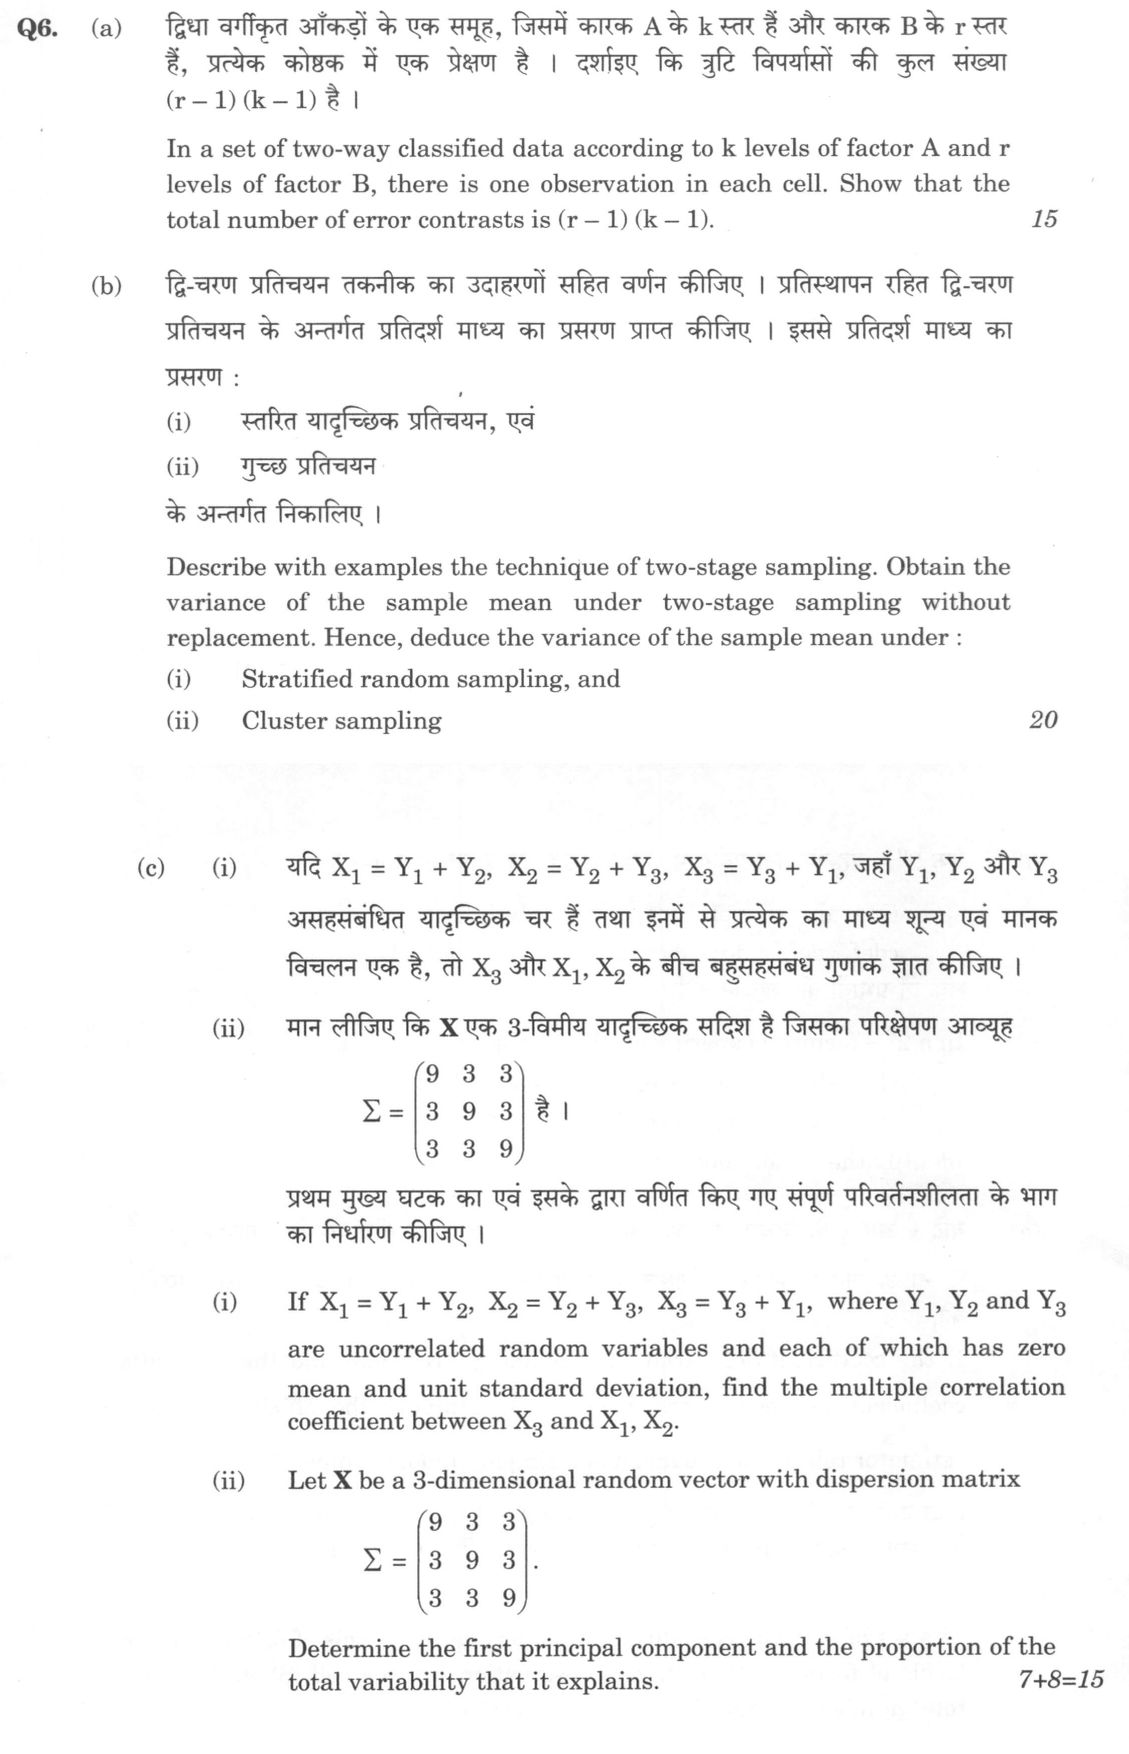
In a set of two-way classified data according to k levels of factor A and r levels of factor B, there is one observation in each cell. Show that the total number of error contrasts is (r – 1) (k – 1). 15 marks
Describe with examples the technique of two-stage sampling. Obtain the variance of the sample mean under two-stage sampling without replacement. Hence, deduce the variance of the sample mean under : (i) Stratified random sampling, and (ii) Cluster sampling 20 marks
If X₁ = Y₁ + Y₂, X₂ = Y₂ + Y₃, X₃ = Y₃ + Y₁, where Y₁, Y₂ and Y₃ are uncorrelated random variables and each of which has zero mean and unit standard deviation, find the multiple correlation coefficient between X₃ and X₁, X₂.
Let X be a 3-dimensional random vector with dispersion matrix Σ = ⎛9 3 3⎞ ⎜3 9 3⎟ ⎝3 3 9⎠. Determine the first principal component and the proportion of the total variability that it explains. (7+8=15 marks)
हिंदी में प्रश्न पढ़ें
द्विधा वर्गीकृत आंकड़ों के एक समूह, जिसमें कारक A के k स्तर हैं और कारक B के r स्तर हैं, प्रत्येक कोष्ठक में एक प्रेक्षण है । दर्शाइए कि त्रुटि विपर्यासों की कुल संख्या (r – 1) (k – 1) है । (15 अंक)
द्वि-चरण प्रतिचयन तकनीक का उदाहरणों सहित वर्णन कीजिए । प्रतिस्थापन रहित द्वि-चरण प्रतिचयन के अंतर्गत प्रतिदर्श माध्य का प्रसरण प्राप्त कीजिए । इससे प्रतिदर्श माध्य का प्रसरण : (i) स्तरित यादृच्छिक प्रतिचयन, एवं (ii) गुच्छ प्रतिचयन के अंतर्गत निकालिए । (20 अंक)
यदि X₁ = Y₁ + Y₂, X₂ = Y₂ + Y₃, X₃ = Y₃ + Y₁, जहाँ Y₁, Y₂ और Y₃ असहसंबंधित यादृच्छिक चर हैं तथा इनमें से प्रत्येक का माध्य शून्य एवं मानक विचलन एक है, तो X₃ और X₁, X₂ के बीच बहुसंबंध गुणांक ज्ञात कीजिए ।
मान लीजिए कि X एक 3-विमीय यादृच्छिक सदिश है जिसका परिक्षेपण आव्यूह Σ = ⎛9 3 3⎞ ⎜3 9 3⎟ ⎝3 3 9⎠ है । प्रथम मुख्य घटक का एवं इसके द्वारा वर्णित किए गए संपूर्ण परिवर्तनशीलता के भाग का निर्धारण कीजिए । (7+8=15 अंक)
What "Derive" is asking you to do
Reach the stated expression from a starting relation, justifying every step. The destination is printed in the question, so only the route earns marks, and the assumptions you work under are part of that route.
Structure that answers it
Assumptions and notation defined → starting relation or governing equation → each step with its justification → the required expression → limiting case or boundary check
Where marks are lost
Writing the standard result first and fitting three lines to it, which an examiner reads at a glance. Marks also go on assumptions left unstated — lossless medium, small amplitude, errors independent with zero mean — and on symbols used before they are defined, even when the question says usual notations.
How this answer will be evaluated
Approach
(a) justify: claim > 3-4 reasons > evidence > conclusion | (b) derive: given > assumptions > stepwise derivation > result > check | (c(i)) calculate: given > formula > substitution > result with units > interpretation | (c(ii)) calculate: given > formula > substitution > result with units > interpretation Full marks: Rigorous derivations with correct notation and clear interpretation of results.
Key points expected
- State total degrees of freedom as N - 1
- Identify df for Factor A as k - 1
- Identify df for Factor B as r - 1
- Show error df = Total - A - B
- Defines two-stage sampling with an example
- Derives Var(ȳ) for two-stage sampling without replacement
- Deduces variance for stratified random sampling
- Deduces variance for cluster sampling
Evaluation rubric
Each sub-part is marked on its own, against the marks and word limit printed on the paper.
- (a) Derive the degrees of freedom for the error term in a two-way ANOVA with one observation per cell. 15 marks
justify— claim → 3-4 reasons → evidence → conclusion
Must cover
- State total degrees of freedom as N - 1
- Identify df for Factor A as k - 1
- Identify df for Factor B as r - 1
- Show error df = Total - A - B
Loses marks
- Assumes multiple observations per cell
- Fails to subtract interaction df
Earns more
- Explicitly defines N = r * k
- Mentions interaction is confounded with error
Extra mark
- Provides a small numerical example (e.g., 2x3 design)
- (b) Derive the variance of the sample mean for two-stage sampling and deduce it for stratified and cluster sampling. 20 marks
derive— given → assumptions → stepwise derivation → result → check
Must cover
- Defines two-stage sampling with an example
- Derives Var(ȳ) for two-stage sampling without replacement
- Deduces variance for stratified random sampling
- Deduces variance for cluster sampling
Loses marks
- Confuses cluster sampling with stratified sampling
- Omits the finite population correction factor
Earns more
- Clearly distinguishes between primary and secondary units
- Uses correct notation for finite population correction
Extra mark
- Compares the efficiency of the three methods
- (c(i)) Calculate the multiple correlation coefficient between X3 and X1, X2 given the linear relationships. 7 marks
calculate— given → formula → substitution → result with units → interpretation
Must cover
- Constructs the covariance matrix of X1, X2, X3
- Identifies the relevant sub-matrices for R²
- Calculates the determinant of the matrices
- Computes R = sqrt(1 - |Σxx|/|Σ11|)
Loses marks
- Incorrectly calculates the covariance terms
- Uses the wrong formula for multiple correlation
Earns more
- Shows the step-by-step matrix construction
- Verifies the result using the correlation formula
Extra mark
- Interprets the magnitude of the correlation
- (c(ii)) Determine the first principal component and the proportion of total variability it explains. 8 marks
calculate— given → formula → substitution → result with units → interpretation
Must cover
- Sets up the characteristic equation |Σ - λI| = 0
- Solves for the eigenvalues of the matrix
- Identifies the largest eigenvalue λ1
- Calculates the eigenvector corresponding to λ1
Loses marks
- Fails to normalize the eigenvector
- Calculates the proportion using the wrong denominator
Earns more
- Normalizes the eigenvector to unit length
- Calculates the proportion as λ1 / trace(Σ)
Extra mark
- Mentions the geometric interpretation of the PC
Model answer coming soon
Every evaluation on this site is marked against a verified model answer. This question's answer is still being written; evaluation opens the moment it lands.
More from Statistics 2022 Paper I
- Q3 (a) (i) How large a sample must be taken in order that the probability will be at least 0…
- Q4 (a) Consider Poisson distribution P_θ(X = j) = (e⁻θ θ^j)/(j!) = pⱼ, j = 0, 1, 2, .... Let…
- Q5 (a) Define general linear model with usual assumptions. If y₁ = β₁ + u₁, y₂ = –β₁ + β₂ +…
- Q6 (a) In a set of two-way classified data according to k levels of factor A and r levels of…
- Q7 (a) Consider the following data given for a BIBD with v = b = 4, r = k = 3, λ = 2 and N =…
- Q8 (a) (i) What are orthogonal polynomials ? How do you fit an orthogonal polynomial of degr…