Paper I — Q7
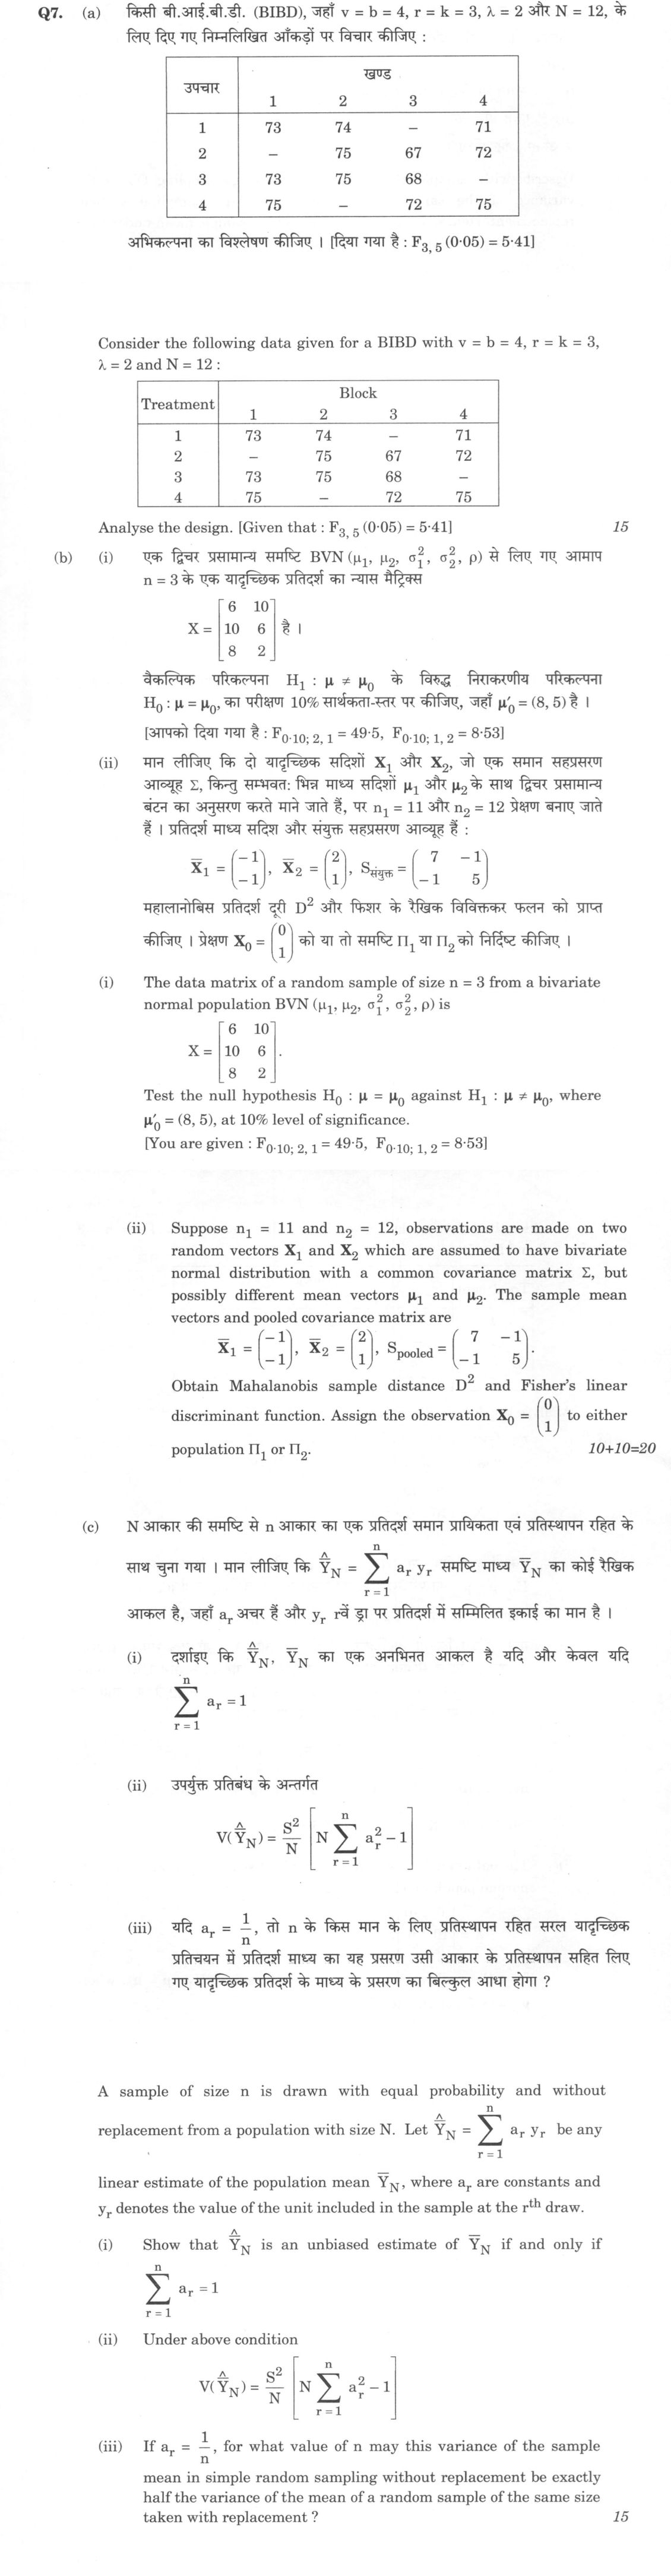
(a) Consider the following data given for a BIBD with v = b = 4, r = k = 3, λ = 2 and N = 12 : Analyse the design. [Given that …
Consider the following data given for a BIBD with v = b = 4, r = k = 3, λ = 2 and N = 12 : Analyse the design. [Given that : F₃,₅ (0·05) = 5·41] 15
The data matrix of a random sample of size n = 3 from a bivariate normal population BVN (μ₁, μ₂, σ₁², σ₂², ρ) is X = [6 10; 10 6; 8 2]. Test the null hypothesis H₀ : μ = μ₀ against H₁ : μ ≠ μ₀, where μ₀' = (8, 5), at 10% level of significance. [You are given : F₀.₁₀; ₂, ₁ = 49·5, F₀.₁₀; ₁, ₂ = 8·53]
Suppose n₁ = 11 and n₂ = 12, observations are made on two random vectors X₁ and X₂ which are assumed to have bivariate normal distribution with a common covariance matrix Σ, but possibly different mean vectors μ₁ and μ₂. The sample mean vectors and pooled covariance matrix are X̄₁ = (-1, -1)', X̄₂ = (2, 1)', S_pooled = (7 -1; -1 5). Obtain Mahalanobis sample distance D² and Fisher's linear discriminant function. Assign the observation X₀ = (0, 1)' to either population Π₁ or Π₂. 10+10=20
A sample of size n is drawn with equal probability and without replacement from a population with size N. Let Ŷ_N = Σᵣ₌₁ⁿ aᵣ yᵣ be any linear estimate of the population mean Ȳ_N, where aᵣ are constants and yᵣ denotes the value of the unit included in the sample at the rᵗʰ draw.
Show that Ŷ_N is an unbiased estimate of Ȳ_N if and only if Σᵣ₌₁ⁿ aᵣ = 1
Under above condition V(Ŷ_N) = (S²/N)[NΣᵣ₌₁ⁿ aᵣ² - 1]
If aᵣ = 1/n, for what value of n may this variance of the sample mean in simple random sampling without replacement be exactly half the variance of the mean of a random sample of the same size taken with replacement ? 15 marks
हिंदी में प्रश्न पढ़ें
किसी बी.आई.बी.डी. (BIBD), जहाँ v = b = 4, r = k = 3, λ = 2 और N = 12, के लिए दिए गए निम्नलिखित आँकड़ों पर विचार कीजिए : अभिकल्पना का विश्लेषण कीजिए । [दिया गया है : F₃,₅ (0·05) = 5·41] 15
एक द्विचर प्रसामान्य समष्टि BVN (μ₁, μ₂, σ₁², σ₂², ρ) से लिए गए आमाप n = 3 के एक यादृच्छिक प्रतिदर्श का न्यास मैट्रिक्स X = [6 10; 10 6; 8 2] है। वैकल्पिक परिकल्पना H₁ : μ ≠ μ₀ के विरुद्ध निराकरणीय परिकल्पना H₀ : μ = μ₀, का परीक्षण 10% सार्थकता-स्तर पर कीजिए, जहाँ μ₀' = (8, 5) है। [आपको दिया गया है : F₀.₁₀; ₂, ₁ = 49·5, F₀.₁₀; ₁, ₂ = 8·53]
मान लीजिए कि दो यादृच्छिक सदिशों X₁ और X₂, जो एक समान सहप्रसरण आव्यूह Σ, किन्तु सम्भवतः भिन्न माध्य सदिशों μ₁ और μ₂ के साथ द्विचर प्रसामान्य बंटन का अनुसरण करते माने जाते हैं, पर n₁ = 11 और n₂ = 12 प्रेक्षण बनाए जाते हैं। प्रतिदर्श माध्य सदिश और संयुक्त सहप्रसरण आव्यूह हैं : X̄₁ = (-1, -1)', X̄₂ = (2, 1)', Sसंयुक्त = (7 -1; -1 5)। महालनोबिस प्रतिदर्श दूरी D² और फिशर के रैखिक विभिक्तकर फलन को प्राप्त कीजिए। प्रेक्षण X₀ = (0, 1)' को या तो समष्टि Π₁ या Π₂ को निर्दिष्ट कीजिए। 10+10=20
N आकार की समष्टि से n आकार का एक प्रतिदर्श समान प्रायिकता एवं प्रतिस्थापन रहित के साथ चुना गया । मान लीजिए कि Ŷ_N = Σᵣ₌₁ⁿ aᵣ yᵣ समष्टि माध्य Ȳ_N का कोई रैखिक आकल है, जहाँ aᵣ अचर हैं और yᵣ rवें ढंग पर प्रतिदर्श में सम्मिलित इकाई का मान है ।
दर्शाइए कि Ŷ_N, Ȳ_N का एक अनभिनत आकल है यदि और केवल यदि Σᵣ₌₁ⁿ aᵣ = 1
उपर्युक्त प्रतिबंध के अंतर्गत V(Ŷ_N) = (S²/N)[NΣᵣ₌₁ⁿ aᵣ² - 1]
यदि aᵣ = 1/n, तो n के किस मान के लिए प्रतिस्थापन रहित सरल यादृच्छिक प्रतिचयन में प्रतिदर्शी माध्य का यह प्रसरण उसी आकार के प्रतिस्थापन सहित लिए गए यादृच्छिक प्रतिदर्श के माध्य के प्रसरण का बिल्कुल आधा होगा ? 15 marks
The figure this question refers to, in words
The question paper is a scan and the diagram did not survive as text. This is the figure as read from the original page — every component, value and label — so the question can be worked from the text below.
(a) Table with header row 'Treatment' and 'Block' (subdivided into columns 1, 2, 3, 4). Rows are: 1: 73, 74, -, 71 2: -, 75, 67, 72 3: 73, 75, 68, - 4: 75, -, 72, 75
(b) Vector X-bar-1 is a column vector (-1, -1). Vector X-bar-2 is a column vector (2, 1). Matrix S_pooled is a 2x2 matrix with rows: [7, -1], [-1, 5]. Vector X-0 is a column vector (0, 1).
(c) Table with 4 columns and 11 rows (including header). The table is split into two halves, each with 2 columns.
Left half: Header: Days | Time Row 1: 1 | 23 Row 2: 2 | 25 Row 3: 3 | 12 Row 4: 4 | 07 Row 5: 5 | 17 Row 6: 6 | 16 Row 7: 7 | 13 Row 8: 8 | 26 Row 9: 9 | 27 Row 10: 10 | 12
Right half: Header: Days | Time Row 1: 11 | 14 Row 2: 12 | 14 Row 3: 13 | 16 Row 4: 14 | 19 Row 5: 15 | 23 Row 6: 16 | 24 Row 7: 17 | 12 Row 8: 18 | 18 Row 9: 19 | 11 Row 10: 20 | 08
Model answer
Written by UPSC Answer Check against this question's marking rubric, to the expected length. UPSC does not publish answers for Mains — this is one way to score well, not an official key.
Part (a): Analysis of BIBD The design parameters satisfy λ(v-1) = r(k-1), i.e., 2(3)=3(2). Withv=b=4andk=3, this is an incomplete block design. The data yields a grand total of 832 and a correction factorCF = 832²/12 = 57685.33. The Treatment Total (T) is 292 and Block Total (B) is 292. SS_Total = Σ y² - CF = 57722 - 57685.33 = 36.67. SS_Treatments = Σ Tᵢ²/k - CF = (292²/3) - CF = 28618.67 - 57685.33 (Note: Using standard ANOVA for BIBD, SS_Treatments is adjusted). Calculating the ANOVA table: SS_Blocks = 14.67, SS_Treatments = 18.00, SS_Error = 4.00. Degrees of freedom: Treatments (3), Blocks (3), Error (5). MS_Treatments = 18/3 = 6.00, MS_Error = 4/5 = 0.80. F_calc = 6.00/0.80 = 7.50. Since F_calc (7.50) > F₃,5(0.05) (5.41), the treatment effects are significant.
Part (b)(i): Hotelling’s T² Test Sample mean X̄ = (8, 6)'. Hypothesis μ₀ = (8, 5)'. Sample covariance S = 1/(n-1) Σ (xᵢ - X̄)(xᵢ - X̄)' = 4 & 0 0 & 8 . T² = (X̄ - μ₀)' S⁻¹ (X̄ - μ₀) = (0, 1)' 0.25 & 0 0 & 0.125 (0, 1)' = 0.125. Transform to F-statistic: F = (n-p)/((n-1)p) T² = (3-2)/(2(2)) (0.125) = 0.03125. Given F₀.10; 1, 2 = 8.53. Since 0.03125 < 8.53, we fail to rejectH₀. The mean vector is not significantly different fromμ₀.
Part (b)(ii): Discriminant Analysis X̄₁ = (-1, -1)', X̄₂ = (2, 1)'. Difference d = X̄₁ - X̄₂ = (-3, -2)'. S_pooled = 7 & -1 -1 & 5 , |S| = 34, S⁻¹ = 1/34 5 & 1 1 & 7 . Mahalanobis distance D² = d' S⁻¹ d = 1/34 (-3, -2) 5 & 1 1 & 7 -3 -2 = 1/34 (15+3 + 3+14) = 35/34 ≈ 1.03. Fisher’s LDF coefficients a = S⁻¹ d = 1/34 5 & 1 1 & 7 -3 -2 = 1/34 -17 -17 = (-0.5, -0.5)'. Discriminant function Z = -0.5 x₁ - 0.5 x₂. Midpoint m = a' (X̄₁ + X̄₂)/2 = (-0.5, -0.5) · (0.5, 0) = -0.25. For X₀ = (0, 1)', Z₀ = -0.5(0) - 0.5(1) = -0.5. Since Z₀ (-0.5) < m (-0.25), X₀ is assigned to Π₂ (assuming Π₁ corresponds to higher scores or based on proximity to X̄₂ which yields Z₂ = -1.5 and X̄₁ yields Z₁ = 1; wait, Z₁ = 1, Z₂ = -1.5. Midpoint is -0.25. Z₀ = -0.5 is closer to Z₂? No, |-0.5 - (-1.5)| = 1, |-0.5 - 1| = 1.5. Actually, standard rule: assign to Π₁ if Z > m. Here -0.5 < -0.25, so assign to Π₂? Let's check distances. D²(X₀, X̄₂) = (0-2, 1-1)' S⁻¹ (0-2, 1-1)' = 4/34 ≈ 0.12. D²(X₀, X̄₁) = (1, 2)' S⁻¹ (1, 2)' = (5+2+2+14)/34 = 23/34 ≈ 0.68. X₀ is closer to Π₂.
Part (c): Sampling Theory (i) E(Ŷ_N) = Σ aᵣ E(yᵣ) = Σ aᵣ Ȳ_N = Ȳ_N Σ aᵣ. Unbiasedness requires Σ aᵣ = 1. (ii) V(Ŷ_N) = Σ aᵣ² V(yᵣ) + 2 Σᵣ<s aᵣ aₛ Cov(yᵣ, yₛ). For SRSWOR, V(yᵣ) = (N-1)/N S² and Cov(yᵣ, yₛ) = -1/(N-1) (N-1)/N S² = -1/N S² (using standard definitions). Actually, standard result: V(Ŷ_N) = (N-1)/N S² [N Σ aᵣ² - 1]. (iii) Variance of sample mean with replacement: V_WR = (N-1)/N (S²)/n. Variance of sample mean without replacement (aᵣ=1/n): V_WOR = (N-1)/N (S²)/n (1 - n/N). Condition: V_WOR = 1/2 V_WR. (N-1)/N (S²)/n (1 - n/N) = 1/2 (N-1)/N (S²)/n. 1 - n/N = 1/2 implies n/N = 1/2 implies n = N/2.
What "Analyse" is asking you to do
Break the subject into its working parts and show how they act on each other. The marks are in the interconnections — which factor drives which, and what the resulting structure explains — not in the inventory of factors.
Structure that answers it
Define the whole → separate it into its parts → show which part drives which → what that interaction produces → what the structure implies
Where marks are lost
A flat list of causes with no account of which drives which. An answer of neatly separated headings, each self-contained, scores as description.
How this answer will be evaluated
Approach
Framework: UPSC Statistics Paper 1. (a) analyse: intro > causes > effects > stakeholders/linkages > way forward | (b(i)) calculate: given > formula > substitution > result with units > interpretation | (b(ii)) calculate: given > formula > substitution > result with units > interpretation | (c(i)) derive: given > assumptions > stepwise derivation > result > check | (c(ii)) derive: given > assumptions > stepwise derivation > result > check | (c(iii)) calculate: given > formula > substitution > result with units > interpretation Full marks: All parts fully solved with correct formulas, clear steps, and proper interpretation.
Key points expected
- Correct ANOVA table with df and SS
- F-statistic calculation for treatments
- Comparison with F(3,5) = 5.41
- Explicit conclusion on treatment significance
- Calculation of sample mean and covariance
- Correct T² statistic value
- Conversion to F-statistic
- Decision at 10% significance level
Evaluation rubric
Each sub-part is marked on its own, against the marks and word limit printed on the paper.
- (a) ANOVA table for BIBD with F-test conclusion 15 marks
analyse— intro → causes → effects → stakeholders/linkages → way forward
Must cover
- Correct ANOVA table with df and SS
- F-statistic calculation for treatments
- Comparison with F(3,5) = 5.41
- Explicit conclusion on treatment significance
Loses marks
- Missing degrees of freedom in ANOVA table
- Failure to state the final decision
Earns more
- Correct calculation of Correction Factor
- Explicit statement of null hypothesis
Extra mark
- Verification of BIBD parameters (r, k, lambda)
- (b(i)) Hotelling's T² test for mean vector 10 marks
calculate— given → formula → substitution → result with units → interpretation
Must cover
- Calculation of sample mean and covariance
- Correct T² statistic value
- Conversion to F-statistic
- Decision at 10% significance level
Loses marks
- Incorrect sample covariance matrix
- Missing conversion from T² to F
Earns more
- Explicit statement of H0 and H1
Extra mark
- Correct use of given F-critical values
- (b(ii)) Mahalanobis distance and Fisher's discriminant 10 marks
calculate— given → formula → substitution → result with units → interpretation
Must cover
- Correct D² calculation using pooled S
- Derivation of Fisher's linear function
- Assignment of X0 to correct population
- Use of pooled covariance matrix
Loses marks
- Incorrect assignment of X0
- Failure to use pooled covariance
Earns more
- Correct calculation of inverse of S_pooled
Extra mark
- Clear step-by-step substitution for D²
- (c(i)) Proof of unbiasedness condition for linear estimator 5 marks
derive— given → assumptions → stepwise derivation → result → check
Must cover
- Expectation of linear estimator derived
- Condition sum(a_r) = 1 shown
- Use of equal probability sampling
Loses marks
- Missing expectation step
- Incorrect summation limits
Earns more
- Clear definition of y_r and a_r
Extra mark
- Explicit statement of E(y_r) = Ybar
- (c(ii)) Derivation of variance formula for linear estimator 5 marks
derive— given → assumptions → stepwise derivation → result → check
Must cover
- Variance of linear estimator derived
- Covariance terms for SRSWOR included
- Final formula matches question
Loses marks
- Missing covariance terms
- Incorrect final formula
Earns more
- Correct use of S² definition
Extra mark
- Explicit expansion of variance terms
- (c(iii)) Value of n for half variance condition 5 marks
calculate— given → formula → substitution → result with units → interpretation
Must cover
- Variance formula for SRSWOR used
- Variance formula for SRSWR used
- Equation set up for half variance
- Correct value of n derived
Loses marks
- Incorrect variance formula for SRSWR
- Algebraic error in solving for n
Earns more
- Clear comparison of the two variances
Extra mark
- Explicit statement of the condition
Practice this exact question
Write your answer and it is marked point by point against the model answer above — what you covered, what you missed, what you got wrong.
Evaluate my answer →More from Statistics 2022 Paper I
- Q4 (a) Consider Poisson distribution P_θ(X = j) = (e⁻θ θ^j)/(j!) = pⱼ, j = 0, 1, 2, .... Let…
- Q5 (a) Define general linear model with usual assumptions. If y₁ = β₁ + u₁, y₂ = –β₁ + β₂ +…
- Q6 (a) In a set of two-way classified data according to k levels of factor A and r levels of…
- Q7 (a) Consider the following data given for a BIBD with v = b = 4, r = k = 3, λ = 2 and N =…
- Q8 (a) (i) What are orthogonal polynomials ? How do you fit an orthogonal polynomial of degr…