Paper II — Q1
(a) Distinguish between process control and product control. Explain the various sources of variation encountered in a process…
Distinguish between process control and product control. Explain the various sources of variation encountered in a process control study. Suggest how they can be eliminated from the process. 10 marks
The management of ABC company is considering the question of marketing a new product. The fixed cost required in the project is ₹ 4,000. Three factors are uncertain, viz., selling price, variable cost and annual sales volume. The product has life of only one year. The management has the data on three factors as under:
| Selling Price (₹) | Probability | Variable Cost (₹) | Probability | Sales Volume (units) | Probability |
|---|---|---|---|---|---|
| 3 | 0·2 | 1 | 0·3 | 2000 | 0·3 |
| 4 | 0·5 | 2 | 0·6 | 3000 | 0·3 |
| 5 | 0·3 | 3 | 0·1 | 5000 | 0·4 |
Consider the sequence of thirty random numbers 81, 32, 60, 04, 46, 31, 67, 25, 24, 10, 40, 02, 39, 68, 08, 59, 66, 90, 12, 64, 79, 31, 86, 68, 82, 89, 25, 11, 98, 16 and using the sequence (first 3 random numbers for the first trial, etc.), simulate the average profit for the above project on the basis of 10 trials. 10 marks
If N(t) is a Poisson process and s < t, find P(N(s) = k | N(t) = n) and comment. 10 marks
What are the assumptions made in the theory of games? Describe the maximin principle and minimax principle. Explain the algebraic method for games without saddle point. 10 marks
What are the importances of censoring in life-testing experiments? Discuss the estimation of parameters involved in exponential distribution with mean θ, using type-2 censored sample. 10 marks
हिंदी में प्रश्न पढ़ें
प्रक्रम नियंत्रण और उत्पाद नियंत्रण में विभेदन कीजिए। एक प्रक्रम नियंत्रण अध्ययन में आने वाले परिवर्तन के विभिन्न स्रोतों की व्याख्या कीजिए। सुझाइए कि इनको प्रक्रम से कैसे विलुप्त किया जा सकता है। 10 अंक
ABC कंपनी का प्रबंधन एक नये उत्पाद के विपणन के प्रश्न पर विचार कर रहा है। इस परियोजना में निश्चित लागत ₹ 4,000 की आवश्यकता है। तीन कारक अनिश्चित हैं, जैसे बिक्री मूल्य, परिवर्तनीय लागत और वार्षिक बिक्री मात्रा। इस उत्पाद का जीवन केवल एक वर्ष का है। प्रबंधन के पास तीन कारकों का डेटा निम्नलिखित है :
| बिक्री मूल्य (₹) | प्रायिकता | परिवर्तनीय लागत (₹) | प्रायिकता | बिक्री मात्रा (इकाइयाँ) | प्रायिकता |
|---|---|---|---|---|---|
| 3 | 0·2 | 1 | 0·3 | 2000 | 0·3 |
| 4 | 0·5 | 2 | 0·6 | 3000 | 0·3 |
| 5 | 0·3 | 3 | 0·1 | 5000 | 0·4 |
तीस यादृच्छिक संख्याओं के अनुक्रम 81, 32, 60, 04, 46, 31, 67, 25, 24, 10, 40, 02, 39, 68, 08, 59, 66, 90, 12, 64, 79, 31, 86, 68, 82, 89, 25, 11, 98, 16 पर विचार कीजिए और इस अनुक्रम का प्रयोग करते हुए (पहले अभिप्रयोग के लिए पहली 3 यादृच्छिक संख्याएँ आदि) 10 अभिप्रयोगों के आधार पर उपरोक्त परियोजना के लिए औसत लाभ का अनुकरण (सिमुलेट) कीजिए। 10 अंक
यदि N(t) एक प्वासों प्रक्रम है और s < t है, तो P(N(s) = k | N(t) = n) प्राप्त कीजिए और टिप्पणी दीजिए। 10 अंक
खेलों के सिद्धांत में कौन-सी कल्पनाएँ की जाती हैं? मैक्सिमिन नियम और मिनिमैक्स नियम का वर्णन कीजिए। पल्याण बिंदु रहित खेलों के लिए बीजीय विधि को समझाइए। 10 अंक
जीवन-परीक्षण प्रयोगों में खंड-वर्जन के क्या महत्व हैं? प्रकार-2 के खंड-वर्जित प्रतिदर्श का प्रयोग करके, चरघातांकी बंटन, जिसका माध्य θ है, के प्राचलों के आकलन का वर्णन कीजिए। 10 अंक
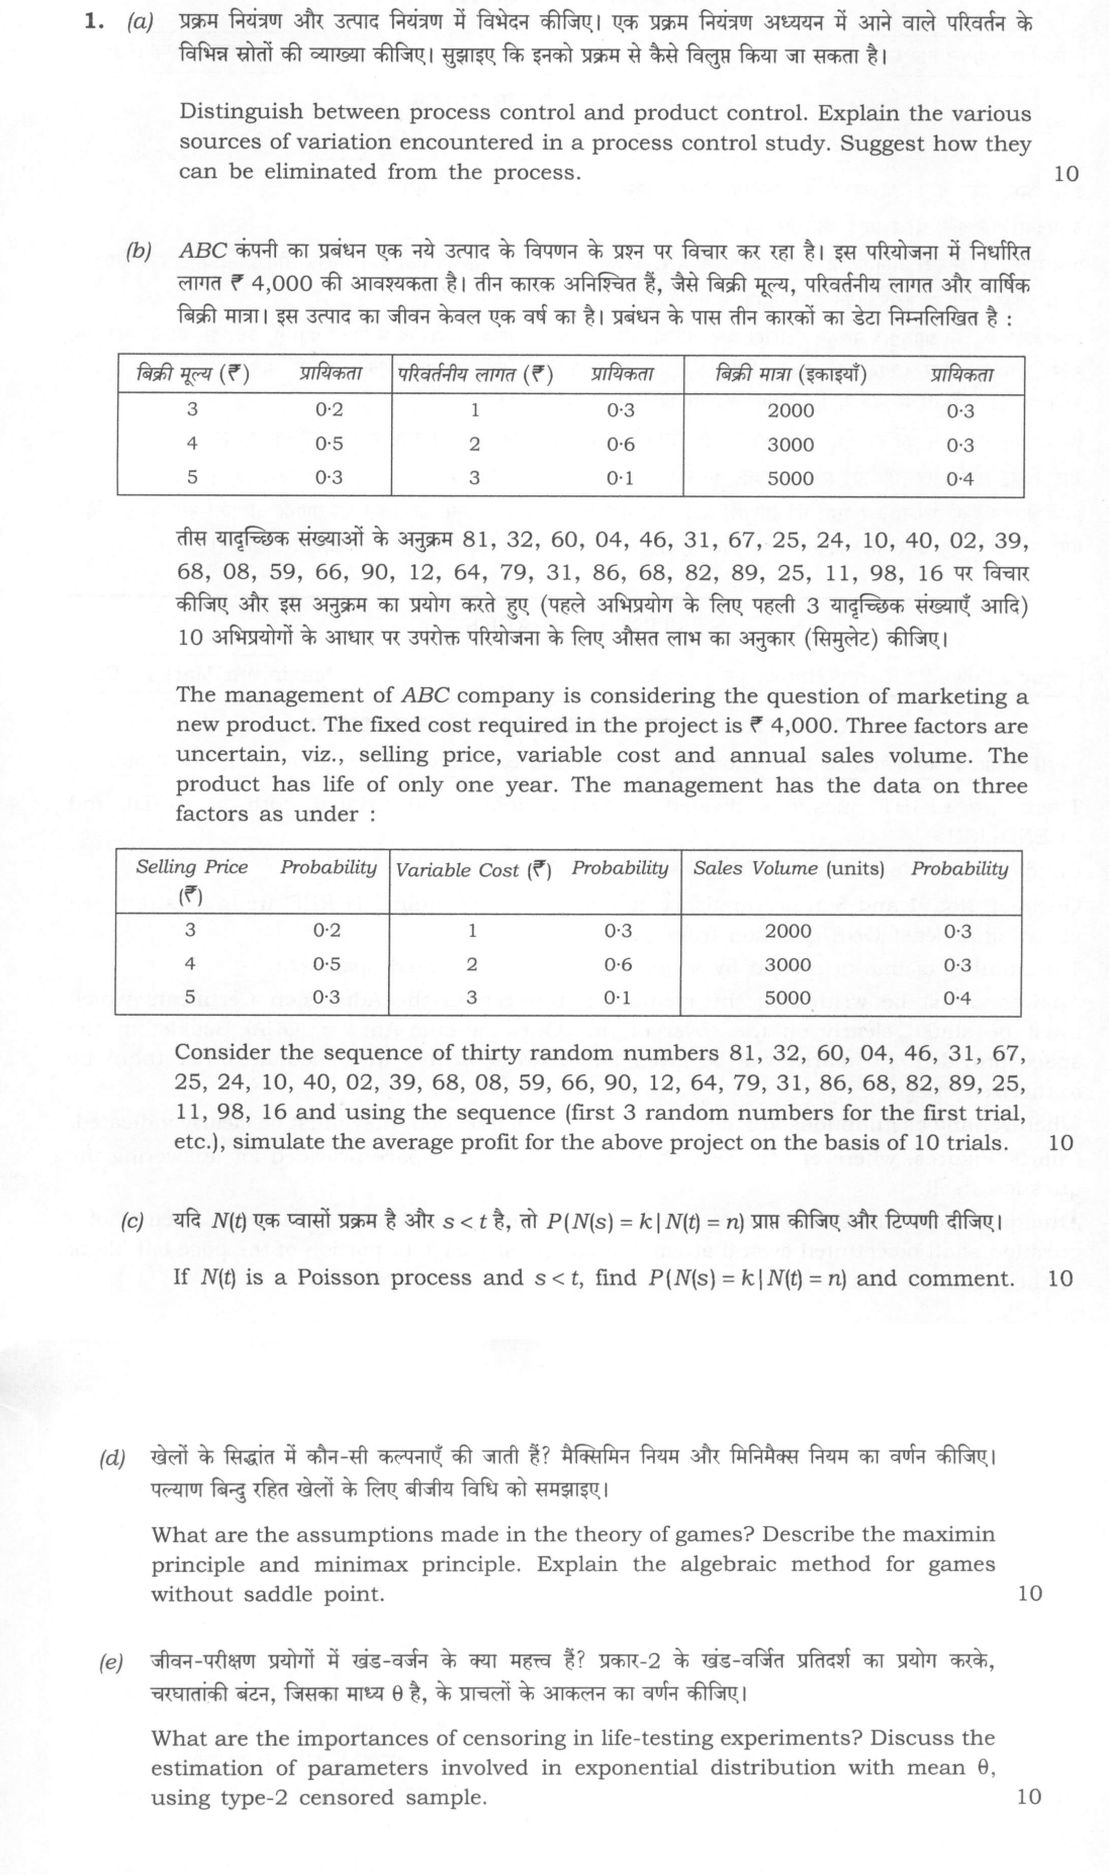
The figure this question refers to, in words
The question paper is a scan and the diagram did not survive as text. This is the figure as read from the original page — every component, value and label — so the question can be worked from the text below.
(b) Table with three columns of data: Column 1: Selling Price (₹) | Probability 3 | 0.2 4 | 0.5 5 | 0.3
Column 2: Variable Cost (₹) | Probability 1 | 0.3 2 | 0.6 3 | 0.1
Column 3: Sales Volume (units) | Probability 2000 | 0.3 3000 | 0.3 5000 | 0.4
Model answer
Written by UPSC Answer Check against this question's marking rubric, to the expected length. UPSC does not publish answers for Mains — this is one way to score well, not an official key.
(a) Process and product control. Process control is the in-process use of statistical methods, especially control charts and process capability studies, to monitor quality characteristics while production is taking place. Its object is to keep the process in statistical control, detect departures early, and reduce variation before defective items are made. Product control is the examination of finished goods or lots after production, usually by acceptance sampling, to decide whether a lot meets specification. The property process control has that product control lacks is direct, real-time feedback to the production system; product control only accepts or rejects output and does not by itself correct the process. Thus process control is preventive and process-improving, while product control is detective and lot-disposition oriented. Variation in a process control study arises from chance causes and assignable causes. These sources are often summarised as man, machine, material, method, measurement and environment. Chance causes are numerous, small, random and inherent, such as minor fluctuations in temperature, humidity, operator attention and measurement noise; they cannot be traced to a single source and are reduced by redesigning the process, improving machines, tightening tolerances, standardising methods, better training and environmental control. Assignable or special causes are identifiable and avoidable, such as worn tooling, wrong material batch, machine misalignment, faulty measurement instrument, untrained operator or method change; they are detected through control-chart signals, Pareto diagrams, stratification and cause-and-effect analysis, and eliminated by immediate corrective action such as replacing material, recalibrating or repairing equipment, revising the method, retraining personnel and improving measurement systems.
(b) Simulation. Assign two-digit random numbers to cumulative probabilities. Selling price: 00–19 gives ₹3, 20–69 gives ₹4, 70–99 gives ₹5. Variable cost: 00–29 gives ₹1, 30–89 gives ₹2, 90–99 gives ₹3. Sales volume: 00–29 gives 2000, 30–59 gives 3000, 60–99 gives 5000. For each trial the first number gives price, second variable cost, third volume, and profit is (price − variable cost) × volume − 4000. Trial 1: 81,32,60 gives price 5, cost 2, volume 5000, profit 11000. Trial 2: 04,46,31 gives price 3, cost 2, volume 3000, profit −1000. Trial 3: 67,25,24 gives price 4, cost 1, volume 2000, profit 2000. Trial 4: 10,40,02 gives price 3, cost 2, volume 2000, profit −2000. Trial 5: 39,68,08 gives price 4, cost 2, volume 2000, profit 0. Trial 6: 59,66,90 gives price 4, cost 2, volume 5000, profit 6000. Trial 7: 12,64,79 gives price 3, cost 2, volume 5000, profit 1000. Trial 8: 31,86,68 gives price 4, cost 2, volume 5000, profit 6000. Trial 9: 82,89,25 gives price 5, cost 2, volume 2000, profit 2000. Trial 10: 11,98,16 gives price 3, cost 3, volume 2000, profit −4000. The total profit is 21000, so the simulated average profit is ₹2100.
(c) Conditional Poisson. Let N(t) be a Poisson process with rate λ, so N(t) has mean λt and independent increments. For s<t, and 0≤k≤n, P(N(s)=k | N(t)=n) = P(N(s)=k, N(t)−N(s)=n−k)/P(N(t)=n) = [e^−λs(λs)^k/k! × e^−λ(t−s)(λ(t−s))ⁿ−k/(n−k)!] / [e^−λt(λt)ⁿ/n!] = n!/[k!(n−k)!] (s/t)^k (1−s/t)ⁿ−k. Thus the conditional distribution is Binomial(n, s/t). The comment is that once the total number of events in [0,t] is fixed, the number occurring by time s depends only on the fraction of the interval, s/t, and not on the rate λ. Equivalently, the n event times are distributed as order statistics of n independent uniform random variables on [0,t], so the count before s is binomial.
(d) Game theory. The theory of games assumes two rational players, each with a finite set of pure strategies, who choose simultaneously. They have complete knowledge of the payoff matrix, no cooperation or collusion, and conflicting interests; in the two-person zero-sum case one player's gain is exactly the other's loss. The maximin principle is used by player A: A examines the minimum payoff in each row and chooses the row with the largest such minimum. This gives A's security level, the best guaranteed payoff. The minimax principle is used by player B: B examines the maximum payoff to A in each column and chooses the column with the smallest such maximum. This gives B's security level. If maximin equals minimax, the game has a saddle point and pure strategies are optimal. If not, the players use mixed strategies. For larger games the same idea is implemented through linear programming, but the 2×2 algebraic form shows the logic clearly. For a 2×2 game with payoff matrix (a11, a12; a21, a22), let A play row 1 with probability p and row 2 with 1−p. B's expected losses in columns 1 and 2 are p a11+(1−p)a21 and p a12+(1−p)a22. To make B indifferent, set them equal; this gives p=(a22−a21)/(a11−a12−a21+a22), and the value is v=p a11+(1−p)a21. Let B play column 1 with probability q. To make A indifferent between rows, q a11+(1−q)a12 = q a21+(1−q)a22, giving q=(a22−a12)/(a11−a12−a21+a22), and the same value follows. Thus the algebraic method solves the simultaneous indifference equations to obtain the optimal mixed probabilities and the value of the game.
(e) Censoring and exponential estimation. Censoring is important in life-testing experiments because complete failure data may require prohibitively long times and high cost, may be unethical in medical or safety tests, and may be unnecessary when only a few failures are needed to estimate reliability. It also allows study of heavy-tailed lifetimes where waiting for all failures is impractical. Type-II censoring is often preferred when a fixed number of failures is required for a reliable estimate; the censored observations contribute survival information, not just failure times. In type-II censoring, n items are put on test and the experiment stops at the r-th failure. The observed data are x_(1),...,x_(r) and n−r items censored at x_(r). For an exponential lifetime with mean θ, f(x)=θ⁻¹e^-x/θ, S(x)=e^-x/θ. The likelihood is L=θ^-r exp−[Σᵢ₌₁^r xᵢ+(n−r)x_(r)]/θ=θ^-re^−T/θ, where T is total time on test. The log-likelihood is −r log θ−T/θ. Differentiating gives −r/θ+T/θ²=0, so θhat=T/r. Since T=Σᵢ₌₁^r (n−i+1)(X_(i)−X_(i−1)) and each spacing has mean θ/(n−i+1), E(T)=rθ; hence θhat is unbiased. The spacings are independent with variance θ²/(n−i+1)², so Var(T)=rθ² and Var(θhat)=θ²/r. Thus type-II censoring makes life testing feasible while retaining an unbiased estimator of θ with variance θ²/r.
What "Distinguish" is asking you to do
Name the property that separates the items and say which side holds it. Distinguish is marked exactly as differentiate is, with no difference in expectation, but its stems more often line up three terms rather than two — gender equality, gender equity and empowerment — and every pair in the set has to be separated.
Structure that answers it
The category they all sit in → the property dividing the first pair → the second pair → the third → why the boundary matters in practice
Where marks are lost
Separating the two obviously different items and leaving the middle term unplaced. A description of each side from which the line must be inferred is marked as description, not as a distinction.
How this answer will be evaluated
Approach
(a) compare: paired headings or table > key differences > significance > conclusion | (b) calculate: given > formula > substitution > result with units > interpretation | (c) derive: given > assumptions > stepwise derivation > result > check | (d) describe: define > structure or process in order > labelled diagram > significance | (e) discuss: intro > 3-4 dimensions > example > balanced close Full marks: All parts answered with correct derivations, clear tables, and precise definitions.
Key points expected
- Define process control (monitoring production)
- Define product control (inspecting finished goods)
- List sources of variation (man, machine, material)
- Suggest specific elimination measures for each source
- Map random numbers to price, cost, volume
- Calculate profit for each of 10 trials
- Compute average profit from the 10 trials
- Show the mapping logic (e.g., 00-29 for price 3)
Evaluation rubric
Each sub-part is marked on its own, against the marks and word limit printed on the paper.
- (a) Differentiate process vs product control and list sources of variation with elimination methods. 10 marks
compare— paired headings or table → key differences → significance → conclusion
Must cover
- Define process control (monitoring production)
- Define product control (inspecting finished goods)
- List sources of variation (man, machine, material)
- Suggest specific elimination measures for each source
Loses marks
- Confusing process control with quality assurance
- Listing sources without elimination methods
Earns more
- Mention SPC charts or control limits
- Distinguish assignable vs chance causes
Extra mark
- Reference to Six Sigma or TQM
- (b) Simulate 10 trials using random numbers to find average profit for the project. 10 marks
calculate— given → formula → substitution → result with units → interpretation
Must cover
- Map random numbers to price, cost, volume
- Calculate profit for each of 10 trials
- Compute average profit from the 10 trials
- Show the mapping logic (e.g., 00-29 for price 3)
Loses marks
- Incorrect mapping of random number ranges
- Arithmetic errors in profit calculation
Earns more
- Presenting results in a clear table
- Correctly handling the fixed cost of 4000
Extra mark
- Calculating standard deviation of profits
- (c) Derive the conditional probability P(N(s)=k|N(t)=n) for a Poisson process. 10 marks
derive— given → assumptions → stepwise derivation → result → check
Must cover
- Use definition of conditional probability
- Apply independent increments property
- Derive the Binomial distribution result
- State the final formula clearly
Loses marks
- Failing to use independent increments
- Algebraic errors in the derivation
Earns more
- Commenting on the Binomial nature of the result
- Mentioning the parameter p = s/t
Extra mark
- Brief note on the limit as t approaches infinity
- (d) Explain game theory assumptions, maximin/minimax principles, and algebraic method for no saddle point. 10 marks
describe— define → structure or process in order → labelled diagram → significance
Must cover
- List assumptions (rationality, zero-sum, etc.)
- Define maximin and minimax principles
- Explain algebraic method for no saddle point
- Mention the use of linear equations for mixed strategies
Loses marks
- Confusing maximin with maximax
- Failing to explain the algebraic method
Earns more
- Defining saddle point clearly
- Example of a 2x2 game without saddle point
Extra mark
- Reference to von Neumann's minimax theorem
- (e) Discuss importance of censoring and parameter estimation for exponential distribution with type-2 censoring. 10 marks
discuss— intro → 3-4 dimensions → example → balanced close
Must cover
- Explain importance of censoring in life-testing
- Define type-2 censored sample
- Derive MLE for mean theta
- Show the likelihood function for censored data
Loses marks
- Confusing type-1 and type-2 censoring
- Failing to derive the MLE correctly
Earns more
- Comparing type-1 and type-2 censoring
- Mentioning the variance of the estimator
Extra mark
- Example of a censored dataset
Practice this exact question
Write your answer and it is marked point by point against the model answer above — what you covered, what you missed, what you got wrong.
Evaluate my answer →More from Statistics 2022 Paper II
- Q1 (a) Distinguish between process control and product control. Explain the various sources…
- Q2 (a) Samples of size n = 5 units are taken from a process every hour. The x̄ and R̄ values…
- Q3 (a) It is planned to raise a research team to a strength of 50 chemists, which is to be m…
- Q4 (a) Use penalty method to solve the following linear programming problem : Maximize Z = x…