Paper II — Q8
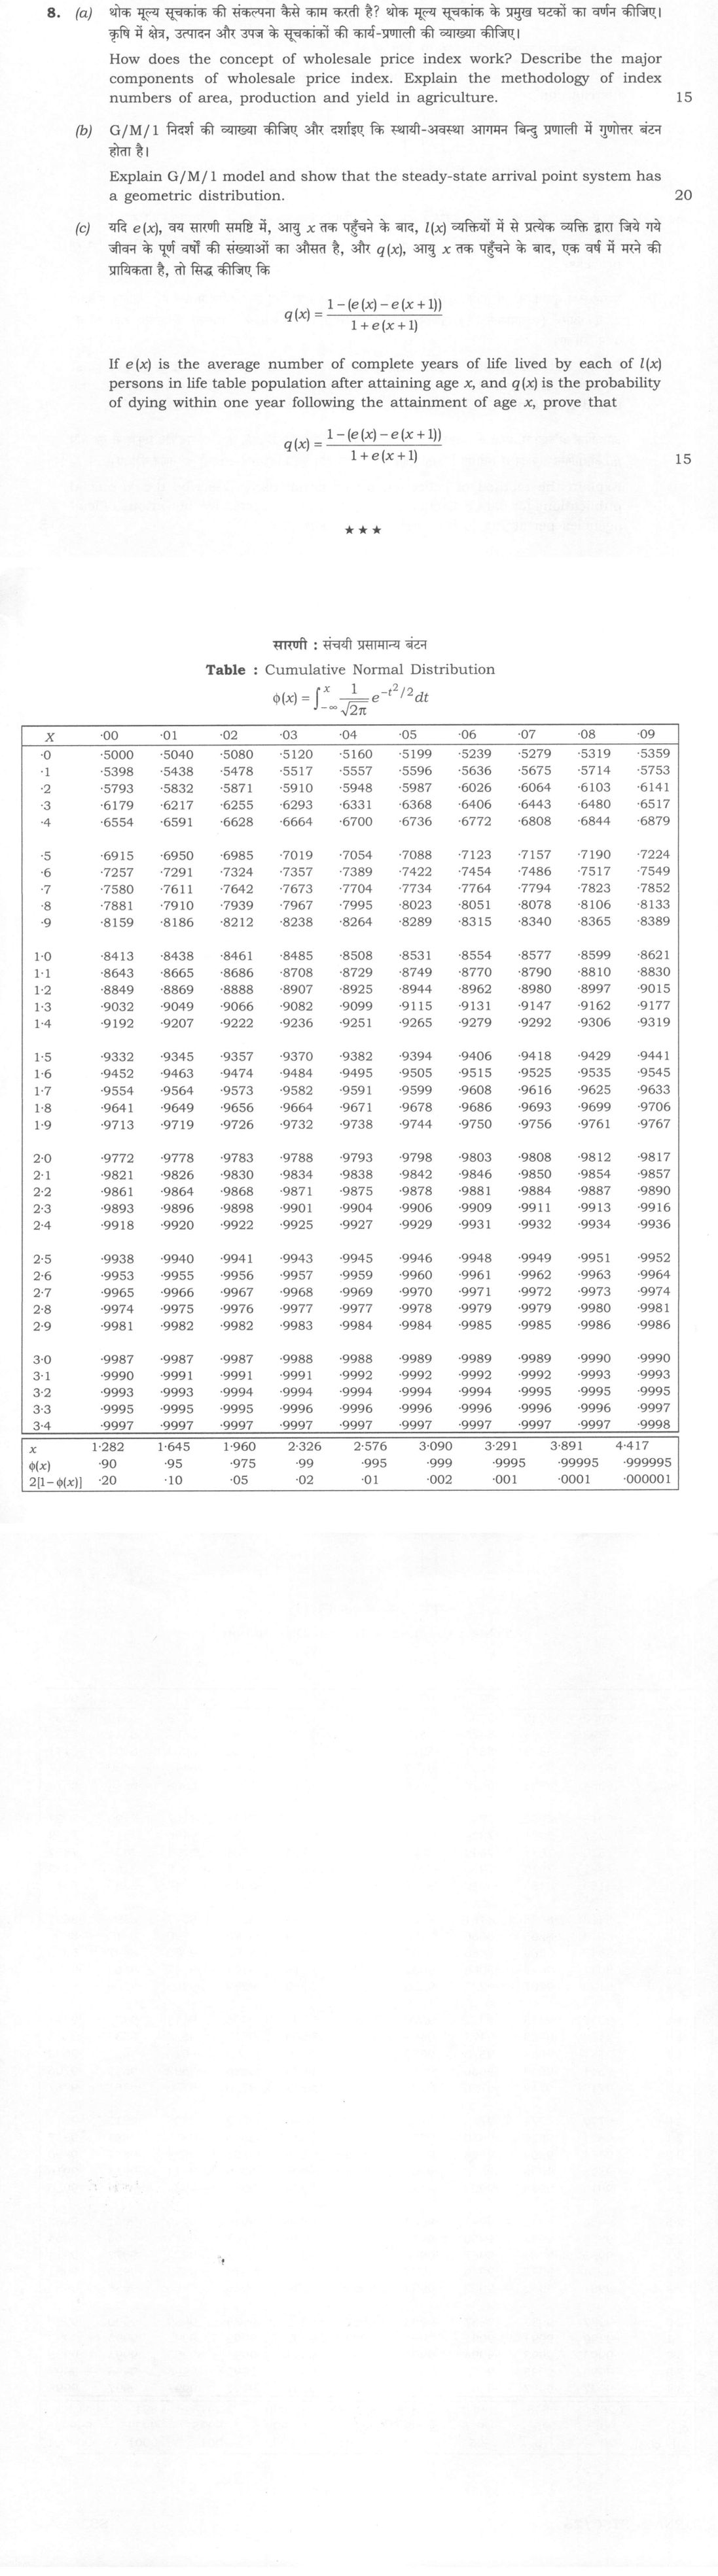
(a) How does the concept of wholesale price index work? Describe the major components of wholesale price index. Explain the…
How does the concept of wholesale price index work? Describe the major components of wholesale price index. Explain the methodology of index numbers of area, production and yield in agriculture. 15 marks
Explain G/M/1 model and show that the steady-state arrival point system has a geometric distribution. 20 marks
If e(x) is the average number of complete years of life lived by each of l(x) persons in life table population after attaining age x, and q(x) is the probability of dying within one year following the attainment of age x, prove that
q(x) = (1 - (e(x) - e(x+1))) / (1 + e(x+1)) 15 marks
हिंदी में प्रश्न पढ़ें
थोक मूल्य सूचकांक की संकल्पना कैसे काम करती है? थोक मूल्य सूचकांक के प्रमुख घटकों का वर्णन कीजिए। कृषि में क्षेत्र, उत्पादन और उपज के सूचकांकों की कार्य-प्रणाली की व्याख्या कीजिए। (15 अंक)
G/M/1 निदर्श की व्याख्या कीजिए और दर्शाइए कि स्थायी-अवस्था आगमन बिन्दु प्रणाली में गुणोत्तर बंटन होता है। (20 अंक)
यदि e(x), वय सारणी समष्टि में, आयु x तक पहुँचने के बाद, l(x) व्यक्तियों में से प्रत्येक व्यक्ति द्वारा जिये गये जीवन के पूर्ण वर्षों की संख्याओं का औसत है, और q(x), आयु x तक पहुँचने के बाद, एक वर्ष में मरने की प्रायिकता है, तो सिद्ध कीजिए कि
q(x) = (1 - (e(x) - e(x+1))) / (1 + e(x+1)) (15 अंक)
Model answer
Written by UPSC Answer Check against this question's marking rubric, to the expected length. UPSC does not publish answers for Mains — this is one way to score well, not an official key.
WPI and agricultural indices The Wholesale Price Index is a fixed-base, base-weighted price index compiled in India by the Office of Economic Adviser, DPIIT, currently on 2011-12 base. It measures how wholesale prices of commodities move relative to the base period, using base-year weights so that the index is a Laspeyres-type aggregate: current value at base weights divided by base value, P01=Σp1q0/Σp0q0×100. Its three major groups are primary articles (~23 per cent), fuel and power (~13 per cent, including mineral oils such as crude petroleum), and manufactured products (~64 per cent). The index works by collecting prices for representative commodities, converting them into relatives, and aggregating with fixed weights; a rise in primary articles raises the index more if their weight is high, while fuel and power transmit cost changes to industry. Because weights are fixed, WPI isolates price movement from quantity shifts, though it may become less representative if the commodity mix changes. For example, a sharp rise in crude petroleum under fuel and power raises the index even if primary articles are stable.
For agriculture, area, production and yield indices are physical relatives. A base year is chosen; fixed-base indices compare each year with that year, while chain-base indices link successive years. For each crop i, area relative = A1i/A0i×100 and production relative = P1i/P0i×100. Crop relatives are aggregated, usually by a weighted arithmetic mean using base-year area or value weights; geometric aggregation is a theoretical alternative, but the yield index is normally derived as production index divided by area index×100, because yield is output per unit area. Thus the area index captures expansion of sown area, the production index captures output change, and the yield index isolates productivity change; if area rises but production rises less, the yield index falls. This keeps the three indices consistent.
G/M/1 and geometric arrival-point distribution In a G/M/1 queue, interarrival times are general with mean 1/λ, service times are exponential with rate μ, and there is one server. Stability requires λ/μ<1. Let aₖ be the probability that k services are completed during one interarrival time. If A*(s)=E[e^-sX] is the Laplace transform of the interarrival time, then a(z)=Σaₖ z^k=A*(μ(1-z)). Because a(z) is convex, a(0)>0, a(1)=1 and a'(1)=μ/λ>1, there is a unique σ∈(0,1) satisfying A*(μ(1-σ))=σ. The equation balances the probabilities of different numbers of services completed before the next arrival.
Let Yₙ be the number in the system just before the nth arrival. If Yₙ=i, after the arrival there are i+1 customers; during the next interarrival K services finish, so Yₙ₊₁=max(0,i+1-K). Hence pᵢ₀=Σₖ₌ᵢ₊₁∞aₖ and pᵢⱼ=aᵢ₊₁₋ⱼ for 1≤j≤i+1. The stationary equations are, for j≥1, πⱼ=Σᵢ≥j-1πᵢ aᵢ₊₁₋ⱼ=Σₖ≥0aₖπⱼ₋₁₊ₖ, and π₀=Σₖ≥1aₖΣₘ₌₀^k-1πₘ. Now put πⱼ=(1-σ)σ^j. For j≥1, the right side is (1-σ)σ^j-1Σaₖσ^k=(1-σ)σ^j-1a(σ)=(1-σ)σ^j=πⱼ. Summing the j≥1 equations and using Σπⱼ=1 gives the j=0 equation automatically. Since the chain is irreducible and positive recurrent, this normalized solution is the steady-state distribution; thus the arrival-point system is geometric. The geometric form follows because the memoryless service time makes the embedded chain one-step-up and the same root σ enters every balance equation. This distribution is the arrival-epoch analogue of the M/M/1 geometric queue-length distribution.
Life-table identity Here e(x) is the curtate expectation: the average number of complete years lived after age x, so e(x)=Σᵣ≥1l(x+r)/l(x), and e(x+1)=Σᵣ≥2l(x+r)/l(x+1). Equivalently, e(x)=(1-q)[1+e(x+1)], because a person aged x contributes one complete year only if surviving to x+1, and then contributes the complete years expected at x+1. Let S=Σᵣ≥2l(x+r). Then e(x)-e(x+1)=[l(x+1)+S]/l(x)-S/l(x+1) =l(x+1)/l(x)+S(1/l(x)-1/l(x+1)). Since l(x+1)=l(x)[1-q(x)], 1/l(x)-1/l(x+1)=-q(x)/l(x+1). Therefore e(x)-e(x+1)=1-q(x)-q(x)S/l(x+1)=1-q(x)-q(x)e(x+1) =1-q(x)[1+e(x+1)]. Rearranging gives q(x)=[1-(e(x)-e(x+1))]/[1+e(x+1)]. The denominator 1+e(x+1) appears because survival to x+1 adds one complete year to the future complete years. At the terminal age the sums vanish and the identity remains consistent, because e(x)=e(x+1)=0 and q(x)=1.
What "Explain" is asking you to do
Make the working of something clear — what sets it off, what follows from what, and what it produces. Explain is the Commission's mechanism word: it dominates the technical papers and the “explain why” stems, where the marks sit in the causal chain and not in the label.
Structure that answers it
State what it is → the initiating condition → the chain of cause, step by step → an instance where it plays out → what the chain produces
Where marks are lost
Describing what something looks like instead of why it works that way. Naming the stages without linking them reads as description too.
How this answer will be evaluated
Approach
Framework: UPSC Statistics Paper 2. (a) explain: definition/context > points in order > small example > short close | (b) explain: definition/context > points in order > small example > short close | (c) derive: given > assumptions > stepwise derivation > result > check Full marks: Complete derivations with correct notation and clear explanations
Key points expected
- Define WPI and its economic purpose
- List major WPI components (e.g., food, fuel)
- Explain methodology for area index
- Explain methodology for production and yield indices
- Define G/M/1 queueing model parameters
- State assumptions of the model
- Derive steady-state arrival point distribution
- Show result is geometric distribution
Evaluation rubric
Each sub-part is marked on its own, against the marks and word limit printed on the paper.
- (a) Explain WPI concept, components, and agricultural index methodology. 15 marks
explain— definition/context → points in order → small example → short close
Must cover
- Define WPI and its economic purpose
- List major WPI components (e.g., food, fuel)
- Explain methodology for area index
- Explain methodology for production and yield indices
Loses marks
- Confusing WPI with CPI
- Omitting agricultural index methodology
- Vague description of components
Earns more
- Mention specific weighting schemes
- Distinguish between area and yield indices
- Reference specific agricultural commodities
Extra mark
- Mention specific WPI base year
- Reference specific agricultural index formula
- (b) Explain G/M/1 model and prove geometric distribution of arrival points. 20 marks
explain— definition/context → points in order → small example → short close
Must cover
- Define G/M/1 queueing model parameters
- State assumptions of the model
- Derive steady-state arrival point distribution
- Show result is geometric distribution
Loses marks
- Incorrect model definition
- Missing derivation steps
- Confusing arrival and service distributions
Earns more
- Define arrival and service processes
- Use correct notation for queue length
- Show step-by-step derivation
Extra mark
- Mention specific queueing theory theorem
- Provide numerical example
- (c) Prove the relationship between e(x), e(x+1), and q(x). 15 marks
derive— given → assumptions → stepwise derivation → result → check
Must cover
- Define e(x) and q(x) clearly
- State life table relationships
- Show step-by-step algebraic derivation
- Arrive at the given formula
Loses marks
- Incorrect definition of e(x) or q(x)
- Algebraic errors in derivation
- Missing intermediate steps
Earns more
- Use correct actuarial notation
- Show intermediate algebraic steps
- Verify the final formula
Extra mark
- Mention specific life table identity
- Provide numerical verification
Practice this exact question
Write your answer and it is marked point by point against the model answer above — what you covered, what you missed, what you got wrong.
Evaluate my answer →More from Statistics 2022 Paper II
- Q5 (a) Apply the method of link relatives to the following data and calculate the seasonal i…
- Q6 (a) Explain Akaike information criterion for order selection in an ARMA (p, q) process. 1…
- Q7 (a) What are the various indices of mortality measure? Explain the purpose and procedure…
- Q8 (a) How does the concept of wholesale price index work? Describe the major components of…