Paper I — Q4
(a) What is the role of properties of completeness and sufficiency in Statistical Inference ? Explain. In U (0, θ), find out…
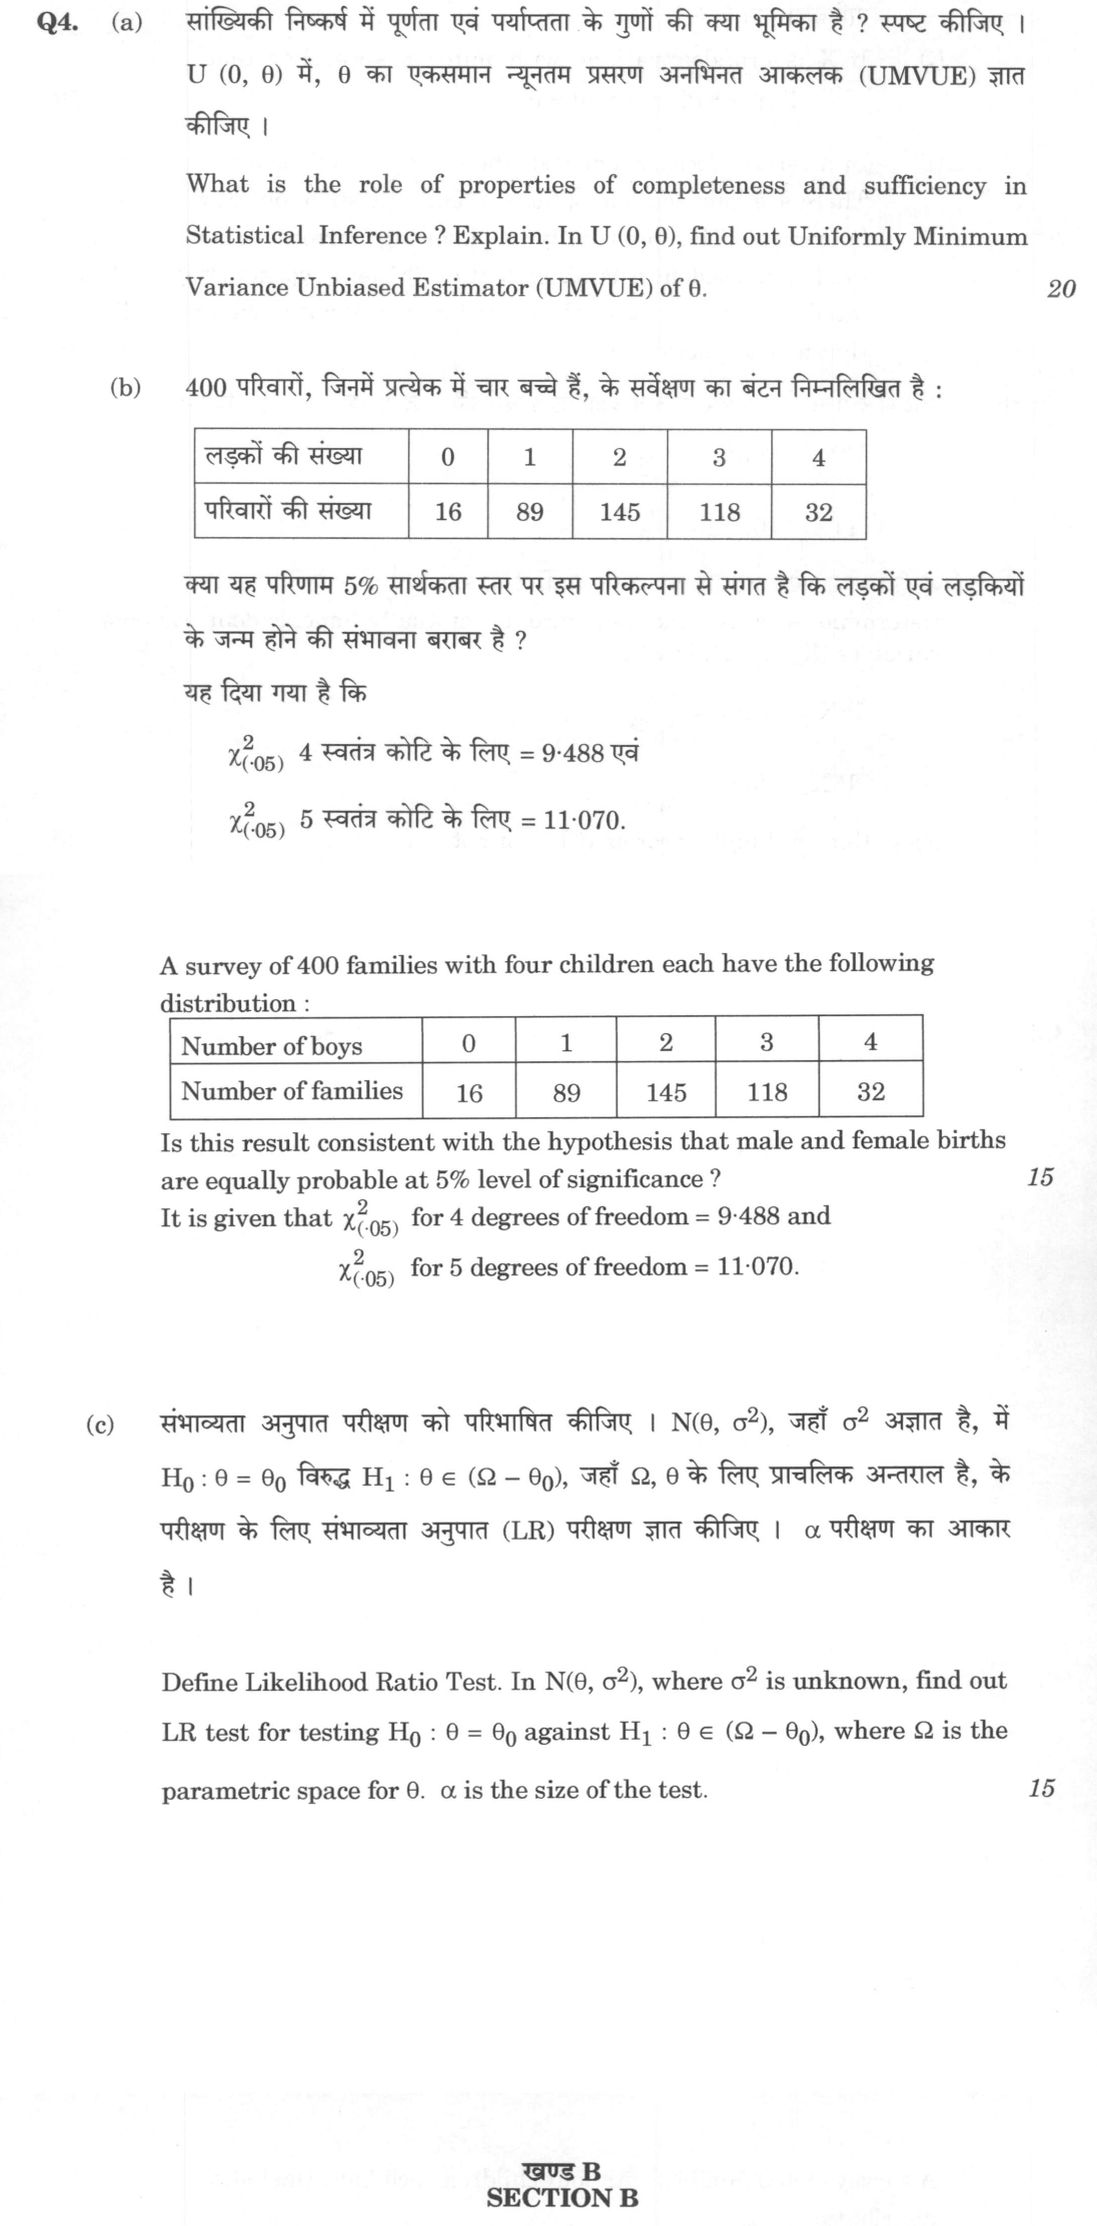
What is the role of properties of completeness and sufficiency in Statistical Inference ? Explain. In U (0, θ), find out Uniformly Minimum Variance Unbiased Estimator (UMVUE) of θ.
20 marks
A survey of 400 families with four children each have the following distribution :
| Number of boys | 0 | 1 | 2 | 3 | 4 |
|---|---|---|---|---|---|
| Number of families | 16 | 89 | 145 | 118 | 32 |
Is this result consistent with the hypothesis that male and female births are equally probable at 5% level of significance ?
It is given that χ²_(.05) for 4 degrees of freedom = 9·488 and χ²_(.05) for 5 degrees of freedom = 11·070.
Define Likelihood Ratio Test. In N(θ, σ²), where σ² is unknown, find out LR test for testing H₀ : θ = θ₀ against H₁ : θ ∈ (Ω – θ₀), where Ω is the parametric space for θ. α is the size of the test.
हिंदी में प्रश्न पढ़ें
सांख्यिकी निष्कर्ष में पूर्णता एवं पर्याप्तता के गुणों की क्या भूमिका है ? स्पष्ट कीजिए । U (0, θ) में, θ का एकसमान न्यूनतम प्रसरण अनभिनत आकलक (UMVUE) ज्ञात कीजिए ।
(20 अंक)
400 परिवारों, जिनमें प्रत्येक में चार बच्चे हैं, के सर्वेक्षण का बंटन निम्नलिखित है :
| लड़कों की संख्या | 0 | 1 | 2 | 3 | 4 |
|---|---|---|---|---|---|
| परिवारों की संख्या | 16 | 89 | 145 | 118 | 32 |
क्या यह परिणाम 5% सार्थकता स्तर पर इस परिकल्पना से संगत है कि लड़कों एवं लड़कियों के जन्म होने की संभावना बराबर है ?
यह दिया गया है कि χ²_(.०५) 4 स्वतंत्र कोटि के लिए = 9·488 एवं χ²_(.०५) 5 स्वतंत्र कोटि के लिए = 11·070.
संभाव्यता अनुपात परीक्षण को परिभाषित कीजिए । N(θ, σ²), जहाँ σ² अज्ञात है, में H₀ : θ = θ₀ विरुद्ध H₁ : θ ∈ (Ω – θ₀), जहाँ Ω, θ के लिए प्राचलिक अंतराल है, के परीक्षण के लिए संभाव्यता अनुपात (LR) परीक्षण ज्ञात कीजिए । α परीक्षण का आकार है ।
Model answer
Written by UPSC Answer Check against this question's marking rubric, to the expected length. UPSC does not publish answers for Mains — this is one way to score well, not an official key.
(a) Completeness, Sufficiency and UMVUE in U(0, θ)
A statistic T is sufficient for θ if the conditional distribution of the sample X, given T, is free of θ. Sufficiency means T captures all information about θ contained in the data, so no other function of the sample can add information about θ. A statistic T is complete if E_θ[g(T)] = 0 for all θ implies g(T) = 0 almost surely. Completeness guarantees that any unbiased estimator based on T is unique, and hence of minimum variance.
Their combined role is central to inference. The Rao–Blackwell theorem says that if T is sufficient and W is any unbiased estimator, then E[W|T] is unbiased with variance no greater than W. The Lehmann–Scheffé theorem strengthens this: if T is complete and sufficient and h(T) is unbiased for θ, then h(T) is the UMVUE. Thus sufficiency permits reduction of data without loss of information, while completeness ensures uniqueness and minimal variance.
For X₁,…,Xₙ ~ U(0, θ), the joint density is θ⁻ⁿ for 0 < xᵢ < θ. By the factorisation criterion, T = X₍ₙ₎ = max(Xᵢ) is sufficient. Its density is f(t) = n tⁿ⁻¹/θⁿ, 0 < t < θ. For completeness, suppose E[g(T)] = 0 for all θ, i.e. (n/θⁿ)∫₀^θ g(t)tⁿ⁻¹dt = 0, so ∫₀^θ g(t)tⁿ⁻¹dt = 0 for all θ. Differentiating with respect to θ gives g(θ)θⁿ⁻¹ = 0, hence g(θ) = 0. Thus T is complete and sufficient.
Now E[X₍ₙ₎] = ∫₀^θ t·n tⁿ⁻¹/θⁿ dt = nθ/(n+1). Hence E[((n+1)/n)X₍ₙ₎] = θ, so it is unbiased. By Lehmann–Scheffé, since X₍ₙ₎ is complete and sufficient, the UMVUE of θ is θ̂ = ((n+1)/n)X₍ₙ₎.
(b) Chi-square goodness-of-fit test
Let p be the probability of a male birth. Under H₀: p = 0.5, the number of boys in a family of four follows Binomial(4, 0.5). Expected proportions are 1/16, 4/16, 6/16, 4/16, 1/16. For 400 families, expected frequencies are 25, 100, 150, 100, 25.
Observed: 16, 89, 145, 118, 32.
χ² = Σ(Oᵢ − Eᵢ)²/Eᵢ = (16−25)²/25 + (89−100)²/100 + (145−150)²/150 + (118−100)²/100 + (32−25)²/25 = 81/25 + 121/100 + 25/150 + 324/100 + 49/25 = 3.24 + 1.21 + 0.1667 + 3.24 + 1.96 = 9.8167.
Degrees of freedom = 5 − 1 = 4 (no parameter estimated). Critical value χ²₀.₀₅,₄ = 9.488. Since 9.8167 > 9.488, we reject H₀ at the 5% level. The result is not consistent with the hypothesis that male and female births are equally probable.
(c) Likelihood Ratio Test
The Likelihood Ratio Test uses λ(x) = sup_θ∈Θ₀ L(θ) / sup_θ∈Θ L(θ), where Θ₀ is the null parameter space and Θ the full space. We reject H₀ when λ ≤ k, with k chosen so the test has size α.
Let X₁,…,Xₙ ~ N(θ, σ²), both unknown. Test H₀: θ = θ₀ against H₁: θ ≠ θ₀. Under Θ, the MLEs are θ̂ = x̄ and σ̂² = (1/n)Σ(xᵢ − x̄)². Under Θ₀, θ = θ₀ and σ̂₀² = (1/n)Σ(xᵢ − θ₀)².
The likelihood ratio simplifies to λ = (σ̂₀² / σ̂²)^(−n/2) = [Σ(xᵢ − x̄)² / Σ(xᵢ − θ₀)²]^(n/2).
Now Σ(xᵢ − θ₀)² = Σ(xᵢ − x̄)² + n(x̄ − θ₀)². Hence λ^(2/n) = Σ(xᵢ − x̄)² / [Σ(xᵢ − x̄)² + n(x̄ − θ₀)²] = 1 / [1 + t²/(n−1)], where t = (x̄ − θ₀)/(s/√n) and s² = Σ(xᵢ − x̄)²/(n−1).
λ ≤ k ⟺ t² ≥ constant, so the rejection region is |t| > t_α/2, n−1. Thus the LRT reduces to the familiar Student's t-test with n − 1 degrees of freedom, rejecting H₀ when |t| exceeds the two-tailed critical value at level α.
What "Explain" is asking you to do
Make the working of something clear — what sets it off, what follows from what, and what it produces. Explain is the Commission's mechanism word: it dominates the technical papers and the “explain why” stems, where the marks sit in the causal chain and not in the label.
Structure that answers it
State what it is → the initiating condition → the chain of cause, step by step → an instance where it plays out → what the chain produces
Where marks are lost
Describing what something looks like instead of why it works that way. Naming the stages without linking them reads as description too.
How this answer will be evaluated
Approach
(a) explain: definition/context > points in order > small example > short close | (b) calculate: given > formula > substitution > result with units > interpretation | (c) derive: given > assumptions > stepwise derivation > result > check Full marks: Rigorous derivations, correct test statistics, and clear interpretation of results.
Key points expected
- Define completeness and sufficiency in inference
- Identify a complete sufficient statistic for U(0, θ)
- Apply Lehmann-Scheffé theorem for UMVUE
- Derive the specific UMVUE of θ
- State H0: p=0.5 and H1: p≠0.5
- Calculate expected frequencies using Binomial distribution
- Compute Chi-square statistic with correct degrees of freedom
- Compare calculated value with critical value 9.488
Evaluation rubric
Each sub-part is marked on its own, against the marks and word limit printed on the paper.
- (a) Explain the role of completeness and sufficiency and derive the UMVUE of θ for U(0, θ). 20 marks
explain— definition/context → points in order → small example → short close
Must cover
- Define completeness and sufficiency in inference
- Identify a complete sufficient statistic for U(0, θ)
- Apply Lehmann-Scheffé theorem for UMVUE
- Derive the specific UMVUE of θ
Loses marks
- Confusing sufficient with complete
- Deriving UMVUE without stating the sufficient statistic
Earns more
- Mention Rao-Blackwell theorem
- Show the unbiased estimator before conditioning
Extra mark
- Reference to Cramér-Rao lower bound
- (b) Perform a Chi-square goodness-of-fit test to check if male/female births are equally probable. 15 marks
calculate— given → formula → substitution → result with units → interpretation
Must cover
- State H0: p=0.5 and H1: p≠0.5
- Calculate expected frequencies using Binomial distribution
- Compute Chi-square statistic with correct degrees of freedom
- Compare calculated value with critical value 9.488
Loses marks
- Using wrong degrees of freedom (e.g., 5 instead of 4)
- Failing to state the conclusion in context
Earns more
- Clean table of observed vs expected frequencies
- Explicit calculation of degrees of freedom (n-1)
Extra mark
- Mentioning the specific p-value range
- (c) Define the Likelihood Ratio Test and derive it for N(θ, σ²) with unknown σ². 15 marks
derive— given → assumptions → stepwise derivation → result → check
Must cover
- Define Likelihood Ratio Test statistic λ
- Write likelihood function for N(θ, σ²)
- Find MLEs for θ and σ² under H0 and H1
- Derive the final test statistic form
Loses marks
- Assuming σ² is known
- Failing to define the parametric space Ω
Earns more
- Showing the maximization steps for σ²
- Stating the asymptotic distribution of the statistic
Extra mark
- Mentioning the relationship to the t-test
Practice this exact question
Write your answer and it is marked point by point against the model answer above — what you covered, what you missed, what you got wrong.
Evaluate my answer →More from Statistics 2023 Paper I
- Q1 (a) Out of 1000 persons born, only 900 reach the age of 15 years, and out of every 1000 w…
- Q2 (a) Let X, Y, Z be three mutually independent standard exponential variates and W₁ = X +…
- Q3 (a) (i) If X is a random variable with finite variance, show that lim n² P{|X| > n} = 0.…
- Q4 (a) What is the role of properties of completeness and sufficiency in Statistical Inferen…
- Q5 (a) (i) If **X** = (X₁ X₂ X₃)' is distributed as N₃ (μ, Σ), find the distribution of [(X₁…
- Q6 (a) Let **X** = (X₁ X₂ X₃)' be distributed as N₃ (μ, Σ), where μ = (2 −1 3)' and Σ = 4 &…
- Q7 (a) Discuss the difference between sampling for variables and sampling for attributes wit…