Paper II — Q4
(a) A Company ships truckloads of grain from three silos to four mills. The supply (in truckloads) and the demand (also in…
A Company ships truckloads of grain from three silos to four mills. The supply (in truckloads) and the demand (also in truckloads) together with the unit transportation costs per truckload on the different routes are summarized in the following table : Purpose is to find the minimum-cost shipping schedule between the silos and the mills. Use any method. Obtain the starting basic feasible solution.
Suppose that the life in hours of an electric Gadget manufactured by a certain process is normally distributed with parameters μ = 160 hours and some σ. What would be the maximum allowable value of σ if the life X of the gadget is to have a probability 0.80 of being between 120 hours and 200 hours ? (Normal distribution Table is given at the end).
Let the compressive strength X of concrete be log-normally distributed with parameters μY = 3 MPa and σY = 0.2 MPa where Y = logeX. What is the probability that the strength is less than or equal to 10 MPa ? (Normal distribution Table is given at the end)
A departmental store operates with three checkout counters. To determine the number of counters in operation based on the number of customers, the manager uses the following schedule : | Number of customers in store | Number of customers in operation | |---|---| | 1 to 3 | 1 | | 4 to 6 | 2 | | More than 6 | 3 | Customers arrive in the counter(s) according to a Poisson distribution with a mean rate of 10 customers/hour. The average checkout time per customer is exponential with mean 12 minutes. Determine the steady state probability pn of n customers in the checkout area.
हिंदी में प्रश्न पढ़ें
एक कंपनी अनाज से भरे ट्रकों को 3 भूमिगत कक्षों (सिलोस) से 4 फैक्ट्रियों (मिल्स) को जहाजों से भेजती है। आपूर्ति (भरे ट्रकों में) और मांग (भी भरे ट्रकों में), विभिन्न मांगों पर इकाई परिवहन लागत प्रति भरा ट्रक के साथ, निम्नलिखित सारणी में संक्षेप में दिये गये हैं : उद्देश्य यह है कि न्यूनतम लागत शिपिंग अनुसूची भूमिगत कक्षों (सिलोस) और फैक्ट्रियों (मिल्स) के बीच में ज्ञात कीजिए। कोई भी विधि का उपयोग करें। प्रारंभिक आधारी सुसंगत हल प्राप्त कीजिए।
मान लीजिए कि एक निश्चित प्रक्रिया द्वारा निर्मित एक इलेक्ट्रिक गैजेट का जीवनकाल (घंटों में) प्रसामान्यतः बंटित है, जिसके प्राचल μ = 160 घंटे और σ कोई एक मान है। σ का अधिकतम स्वीकार्य मान क्या होगा यदि गैजेट के जीवनकाल X के 120 घंटे और 200 घंटे के बीच होने की प्रायिकता 0.80 है ? (प्रसामान्य बंटन सारणी पृष्ठ के अंत में दी गई है)
मान लीजिए X कंक्रीट की संपीडक शक्ति है जो लघुगणकीय प्रसामान्यतः बंटित है जिसके प्राचल μY = 3 MPa और σY = 0.2 MPa है जबकि Y = logeX है। क्षमता (शक्ति) 10 MPa से कम हो या इसके बराबर हो की प्रायिकता क्या है ? (प्रसामान्य बंटन के लिये सारणी आखरी पृष्ठ में दी है)
एक डिपार्टमेंटल स्टोर तीन चेकआउट काउंटरों के साथ संचालित होता है। ग्राहकों की संख्या के आधार पर संचालन में काउंटरों की संख्या निर्धारित करने के लिए, प्रबंधक निम्नलिखित अनुसूची का उपयोग करता है : | भंडार में ग्राहकों की संख्या | संचालन में ग्राहकों की संख्या | |---|---| | 1 से 3 | 1 | | 4 से 6 | 2 | | 6 से अधिक | 3 | प्वासों बंटन के अनुसार ग्राहक काउंटर पर पहुंचते हैं जिसका माध्य दर 10 ग्राहक प्रति घंटा है। औसत चेकआउट समय प्रति ग्राहक एक चरघातीय बंटन है जिसका माध्य 12 मिनट है। चेक आउट क्षेत्र में n ग्राहकों की स्थायी अवस्था प्रायिकता pn ज्ञात कीजिए।
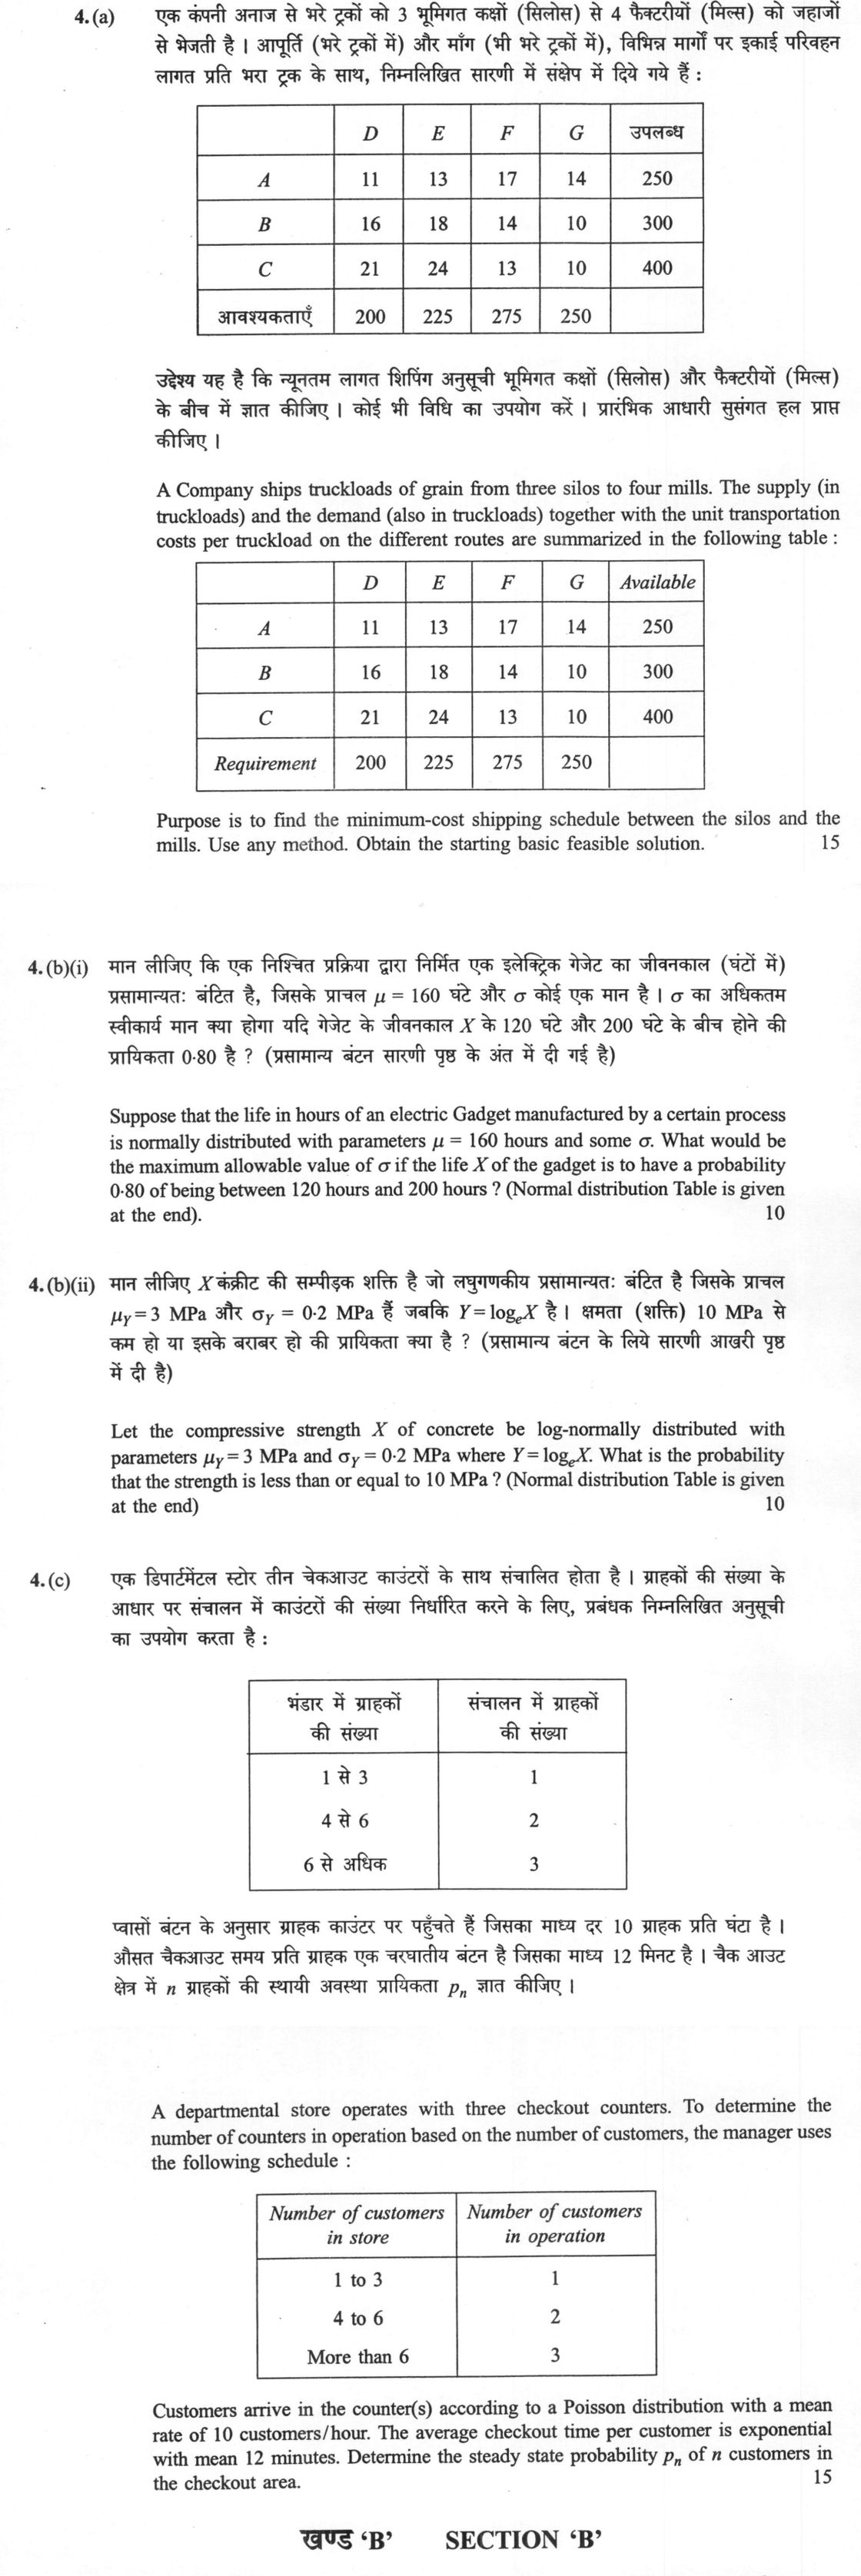
The figure this question refers to, in words
The question paper is a scan and the diagram did not survive as text. This is the figure as read from the original page — every component, value and label — so the question can be worked from the text below.
(a) A transportation table with supply (Available) and demand (Requirement):
Row headers / Column headers: D, E, F, G, Available A: 11, 13, 17, 14, 250 B: 16, 18, 14, 10, 300 C: 21, 24, 13, 10, 400 Requirement: 200, 225, 275, 250
A table with 2 columns and 3 data rows: Number of customers in store | Number of customers in operation 1 to 3 | 1 4 to 6 | 2 More than 6 | 3
Model answer
Written by UPSC Answer Check against this question's marking rubric, to the expected length. UPSC does not publish answers for Mains — this is one way to score well, not an official key.
(a) Total supply = 250+300+400 = 950 truckloads. Total demand = 200+225+275+250 = 950 truckloads, so the problem is balanced. Using the North-West Corner Rule:
- A-D: min(250,200)=200. A left 50, D satisfied.
- A-E: min(50,225)=50. A exhausted, E left 175.
- B-E: min(300,175)=175. B left 125, E satisfied.
- B-F: min(125,275)=125. B exhausted, F left 150.
- C-F: min(400,150)=150. C left 250, F satisfied.
- C-G: min(250,250)=250. C and G satisfied.
Thus the starting basic feasible solution has allocations: A-D=200, A-E=50, B-E=175, B-F=125, C-F=150, C-G=250. Number of positive allocations = 6 = 3+4−1, so it is non-degenerate.
Total cost = 200×11 + 50×13 + 175×18 + 125×14 + 150×13 + 250×10 = 2200 + 650 + 3150 + 1750 + 1950 + 2500 = 12200 monetary units.
This is the starting BFS; an optimality test would follow if the minimum-cost solution is required.
(b)(i) Let Z = (X−160)/σ. Since X is normal with mean 160 and standard deviation σ, Z is standard normal. The condition is P(120 < X < 200) = 0.80. Standardizing, P(−40/σ < Z < 40/σ) = 0.80. By symmetry, 2Φ(40/σ) − 1 = 0.80, so Φ(40/σ) = 0.90. From the normal table, the z-value with Φ(z)=0.90 is z = 1.2816. Hence 40/σ = 1.2816, so σ = 40/1.2816 = 31.21 hours. Since a larger σ makes the interval wider in X but narrower in Z, the probability would fall below 0.80. Thus the maximum allowable σ is 31.21 hours.
(b)(ii) Let Y = ln X. Given Y ~ N(3, 0.2²). Then P(X ≤ 10) = P(ln X ≤ ln 10) = P(Y ≤ 2.302585). Standardize: Z = (2.302585 − 3)/0.2 = −3.487. From the normal table, Φ(−3.487) = 0.00024. Therefore, P(X ≤ 10) = 0.00024 approximately, i.e. about 0.024%.
(c) Let λ = 10 customers/hour. The mean checkout time is 12 minutes = 1/5 hour, so the service rate per counter is μ = 5 customers/hour. For state n = number of customers in the checkout area, the number of counters in operation is cₙ = 1 for n = 1,2,3; cₙ = 2 for n = 4,5,6; cₙ = 3 for n ≥ 7. Thus the total service rate is μₙ = cₙμ.
For a birth-death queue, the balance equation is λpₙ₋₁ = μₙpₙ, n ≥ 1, so pₙ = (λ/μₙ)pₙ₋₁. Multiplying through gives pₙ = (λ/μ₁)(λ/μ₂)...(λ/μₙ)p₀.
Now compute the ratios:
- For k = 1,2,3: λ/μₖ = 10/5 = 2.
- For k = 4,5,6: λ/μₖ = 10/10 = 1.
- For k ≥ 7: λ/μₖ = 10/15 = 2/3.
Therefore, p₁ = 2p₀, p₂ = 4p₀, p₃ = 8p₀, p₄ = 8p₀, p₅ = 8p₀, p₆ = 8p₀, and for n ≥ 7, pₙ = 8(2/3)^(n−6)p₀.
Normalize: 1 = p₀[1+2+4+8+8+8+8 + Σ over n=7 to ∞ of 8(2/3)^(n−6)]. The finite part is 1+2+4+8+8+8+8 = 39. The tail is 8[(2/3)+(2/3)²+(2/3)³+...] = 8 × 2 = 16. So 1 = p₀(39+16) = 55p₀, hence p₀ = 1/55.
Thus the steady-state probabilities are:
- p₀ = 1/55,
- p₁ = 2/55,
- p₂ = 4/55,
- p₃ = p₄ = p₅ = p₆ = 8/55,
- pₙ = (8/55)(2/3)^(n−6) for n ≥ 7.
Steady state exists because λ/(3μ) = 10/15 = 2/3 < 1.
What "Solve" is asking you to do
Choose the method, then carry it through to a final answer. Identifying what kind of problem this is and why that method applies is the first thing marked; a correct figure arrived at invisibly earns almost nothing.
Structure that answers it
Given data and what is required → method chosen, with the reason it applies → set-up (equation, circuit, free body, trial balance) → working, step by step → answer with units and any condition of validity
Where marks are lost
Doing the middle steps mentally and writing only the result. In mathematics papers, a further loss comes from giving a decimal where the exact value in surds or fractions was wanted, or from skipping the justification a part explicitly asks for.
How this answer will be evaluated
Approach
Framework: Operations Research / Applied Statistics. (a) calculate: given > formula > substitution > result with units > interpretation | (b(i)) calculate: given > formula > substitution > result with units > interpretation | (b(ii)) calculate: given > formula > substitution > result with units > interpretation | (c) calculate: given > formula > substitution > result with units > interpretation Full marks: Rigorous derivation, correct notation, and clear interpretation of results.
Key points expected
- Verify total supply equals total demand (950 units).
- State the specific method used (e.g., LCM, NWC, VAM).
- Show step-by-step allocation logic for each cell.
- Present final allocation table with total cost.
- Standardize X to Z using μ = 160.
- Set up equation P(120 < X < 200) = 0.80.
- Use symmetry to find Z-value for 0.40 area.
- Solve for σ using the Z-table value.
Evaluation rubric
Each sub-part is marked on its own, against the marks and word limit printed on the paper.
- (a) Minimum-cost shipping schedule via starting basic feasible solution. 15 marks
calculate— given → formula → substitution → result with units → interpretation
Must cover
- Verify total supply equals total demand (950 units).
- State the specific method used (e.g., LCM, NWC, VAM).
- Show step-by-step allocation logic for each cell.
- Present final allocation table with total cost.
Loses marks
- Allocation violates row or column constraints.
- Method name omitted or inconsistent with steps.
Earns more
- Correctly identifies degenerate solution if applicable.
- Uses Vogel's Approximation Method (VAM) for efficiency.
Extra mark
- Calculates opportunity costs for non-basic cells.
- (b(i)) Maximum allowable standard deviation σ for given probability. 10 marks
calculate— given → formula → substitution → result with units → interpretation
Must cover
- Standardize X to Z using μ = 160.
- Set up equation P(120 < X < 200) = 0.80.
- Use symmetry to find Z-value for 0.40 area.
- Solve for σ using the Z-table value.
Loses marks
- Uses 0.80 directly as Z-table area instead of 0.40.
- Fails to state the standardization formula.
Earns more
- Correctly identifies Z = 1.28 for 0.40 probability.
- Shows clear substitution into the standardization formula.
Extra mark
- Verifies the result by back-substitution.
- (b(ii)) Probability that log-normal strength X ≤ 10 MPa. 10 marks
calculate— given → formula → substitution → result with units → interpretation
Must cover
- Transform X to Y = ln(X) using log-normal property.
- Calculate Z-score for Y = ln(10) with μ=3, σ=0.2.
- Look up probability for calculated Z in normal table.
- State final probability clearly.
Loses marks
- Uses log base 10 instead of natural log (ln).
- Confuses parameters of X with parameters of Y.
Earns more
- Correctly computes ln(10) ≈ 2.3026.
- Shows the Z-calculation: (2.3026 - 3) / 0.2.
Extra mark
- Notes that Z is negative, implying P < 0.5.
- (c) Steady state probability pn for variable server queue. 15 marks
calculate— given → formula → substitution → result with units → interpretation
Must cover
- Identify system as M/M/c with variable c.
- Calculate traffic intensity ρ for each state range.
- Derive pn for n=0, 1, 2, 3 using balance equations.
- Derive general formula for n > 3.
Loses marks
- Assumes constant number of servers (c=3) throughout.
- Fails to account for the change in service rate.
Earns more
- Correctly identifies λ=10 and μ=5 (1/12 min).
- Sets up the general formula for pn based on the nu.
Extra mark
- Calculates numerical values for p0, p1, p2, p3.
Practice this exact question
Write your answer and it is marked point by point against the model answer above — what you covered, what you missed, what you got wrong.
Evaluate my answer →More from Statistics 2023 Paper II
- Q1 (a) What do you understand by Statistical Quality Control (SQC)? Discuss briefly its need…
- Q2 (a) What do you understand by control chart for fraction defective? Explain its construct…
- Q3 (a) Solve the following Linear Programming problem using Two Phase method : Maximize Z =…
- Q4 (a) A Company ships truckloads of grain from three silos to four mills. The supply (in tr…
- Q5 (c) What do you mean by reliability and validity of tests ? What is the difference betwee…
- Q6 (a) Explain the principle of least squares. How it is used in fitting trend in time serie…
- Q7 7.(a) Derive, by starting from a suitable functional form for lₓ, the formula (i) Lₓ = (l…