Paper II — Q5
(a) Discuss the Indian Statistical System. State some important organisations and explain the main working of the National…
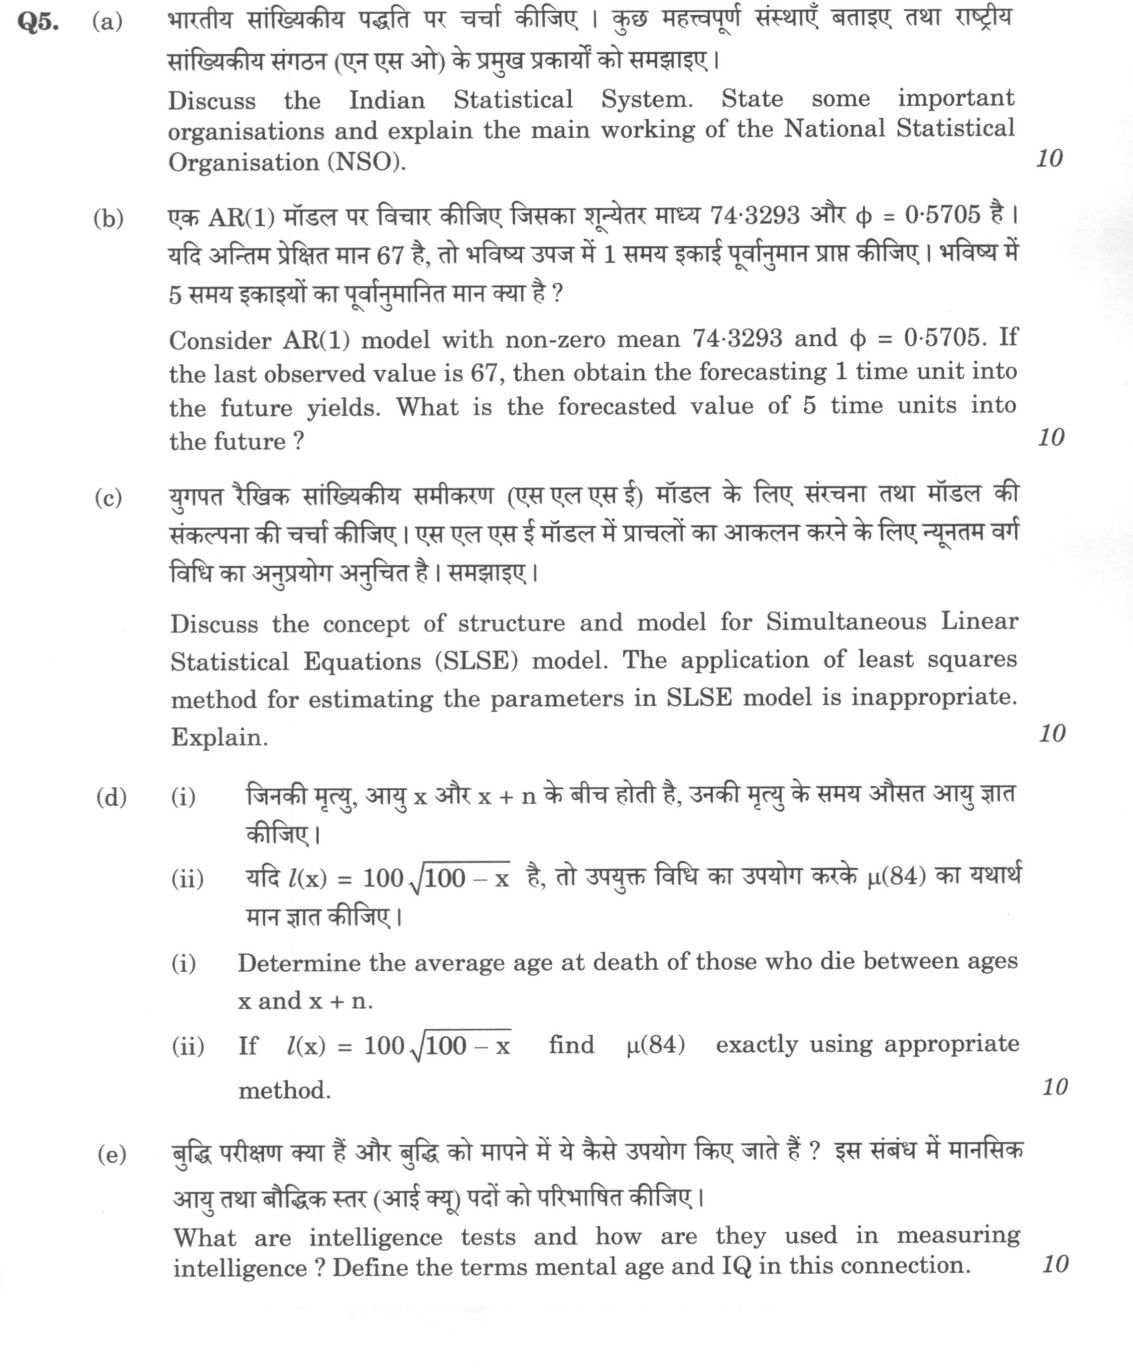
Discuss the Indian Statistical System. State some important organisations and explain the main working of the National Statistical Organisation (NSO). 10 marks
Consider AR(1) model with non-zero mean 74·3293 and φ = 0·5705. If the last observed value is 67, then obtain the forecasting 1 time unit into the future yields. What is the forecasted value of 5 time units into the future ? 10 marks
Discuss the concept of structure and model for Simultaneous Linear Statistical Equations (SLSE) model. The application of least squares method for estimating the parameters in SLSE model is inappropriate. Explain. 10 marks
Determine the average age at death of those who die between ages x and x + n.
If l(x) = 100√(100 – x) find μ(84) exactly using appropriate method. 10 marks
What are intelligence tests and how are they used in measuring intelligence ? Define the terms mental age and IQ in this connection. 10 marks
हिंदी में प्रश्न पढ़ें
भारतीय सांख्यिकीय पद्धति पर चर्चा कीजिए । कुछ महत्वपूर्ण संस्थाएँ बताइए तथा राष्ट्रीय सांख्यिकीय संगठन (एन एस ओ) के प्रमुख प्रकार्यों को समझाइए । 10
एक AR(1) मॉडल पर विचार कीजिए जिसका शून्येतर माध्य 74·3293 और φ = 0·5705 है । यदि अंतिम प्रेक्षित मान 67 है, तो भविष्य उपज में 1 समय इकाई पूर्वानुमान प्राप्त कीजिए । भविष्य में 5 समय इकाइयों का पूर्वानुमानित मान क्या है ? 10 marks
युगपत रैखिक सांख्यिकीय समीकरण (एस एल एस ई) मॉडल के लिए संरचना तथा मॉडल की संकल्पना की चर्चा कीजिए । एस एल एस ई मॉडल में प्राचलों का आकलन करने के लिए न्यूनतम वर्ग विधि का अनुप्रयोग अनुचित है । समझाइए । 10
जिनकी मृत्यु, आयु x और x + n के बीच होती है, उनकी मृत्यु के समय औसत आयु ज्ञात कीजिए ।
यदि l(x) = 100√(100 – x) है, तो उपयुक्त विधि का उपयोग करके μ(84) का यथार्थ मान ज्ञात कीजिए । 10
बुद्धि परीक्षण क्या हैं और बुद्धि को मापने में ये कैसे उपयोग किए जाते हैं ? इस संबंध में मानसिक आयु तथा बौद्धिक स्तर (आई क्यू) पदों को परिभाषित कीजिए । 10
Model answer
Written by UPSC Answer Check against this question's marking rubric, to the expected length. UPSC does not publish answers for Mains — this is one way to score well, not an official key.
Indian Statistical System
The Indian Statistical System (ISS) is a decentralised, multi-agency framework for collection, compilation and dissemination of official statistics, whose foundations were laid by P.C. Mahalanobis with the establishment of the Indian Statistical Institute (1931) and the National Sample Survey (1950). It is broadly divided into Central and State statistical machinery, coordinated through the Ministry of Statistics and Programme Implementation (MoSPI). Key central organisations include the Central Statistics Office (CSO), the National Sample Survey Office (NSSO), the Registrar General of India (RGI, responsible for census and vital statistics), NITI Aayog, and the Reserve Bank of India for monetary and external sector data. State Directorates of Economics and Statistics handle state-level data, while the National Statistical Commission (NSC), constituted on the Rangarajan Committee's recommendation, acts as the apex advisory body.
The National Statistical Organisation (NSO), formed by merging the CSO and NSSO in 2019, functions through three broad mandates: data collection through large-scale sample surveys (employment-unemployment, consumer expenditure, health, education); coordination and standardisation of concepts, definitions and classifications across agencies to ensure comparability; and dissemination of statistical products such as national accounts estimates, CPI, IIP and survey reports. It works under NSC oversight, which safeguards methodological integrity and independence. Thus the ISS, despite coordination challenges and calls for a unified National Statistical Office, remains the backbone of evidence-based policymaking in India.
AR(1) Forecasting
For the AR(1) model with non-zero mean, Xₜ = μ + φ(Xₜ₋₁ − μ) + εₜ, with μ = 74.3293, φ = 0.5705 and xₙ = 67.
One-step-ahead forecast: X̂ₙ₊₁ = μ + φ(xₙ − μ) = 74.3293 + 0.5705(67 − 74.3293) = 74.3293 + 0.5705(−7.3293) = 74.3293 − 4.1814 = 70.1479.
For h steps ahead, X̂ₙ₊ₕ = μ + φ^h(xₙ − μ). For h = 5, φ⁵ = (0.5705)⁵ ≈ 0.0604. Hence X̂ₙ₊₅ = 74.3293 + 0.0604(−7.3293) = 74.3293 − 0.4427 ≈ 73.8866. The forecast converges towards the mean μ as h increases, since φ^h → 0 for |φ| < 1.
SLSE Model: Structure and Inappropriateness of OLS
A Simultaneous Linear Statistical Equations (SLSE) model describes interdependence among endogenous variables, where each endogenous variable may appear as regressor in other equations. Its structure consists of a set of structural equations derived from economic theory, e.g. demand and supply functions, with endogenous variables on both sides and stochastic disturbances. The reduced form expresses each endogenous variable solely in terms of predetermined (exogenous and lagged) variables, obtained by solving the structural system.
Applying OLS to structural equations is inappropriate because the endogenous regressor is correlated with the disturbance term. In a demand-supply system, price and quantity are jointly determined, so the regressor (price) covaries with the error, violating the Gauss-Markov assumption of zero covariance between regressors and errors. This produces simultaneous equation bias: OLS estimators are biased and inconsistent, and the bias does not vanish even asymptotically. Identification issues compound this — a structural equation may be under-identified, making estimation impossible without restrictions. Hence methods such as Indirect Least Squares, Instrumental Variables, Two-Stage Least Squares or Limited Information Maximum Likelihood are used, which exploit predetermined variables as instruments to break the correlation between regressors and errors.
Average Age at Death and Force of Mortality
(i) The average age at death of those dying between ages x and x + n is the mean of the ages at death in that interval, weighted by the distribution of deaths. It is given by
nₐₓ = [∫₀ⁿ (x + t) μ(x + t) l(x + t) dt] / [l(x) − l(x + n)]
equivalently expressible using life table functions as nₐₓ = x + n·aₓ, where n·aₓ is the average number of years lived in the interval by those dying within it. This measure is useful in constructing life tables and in actuarial valuation.
(ii) The force of mortality is μ(x) = −d[ln l(x)]/dx. Given l(x) = 100(100 − x)¹/2, ln l(x) = ln 100 + ½ ln(100 − x), so d[ln l(x)]/dx = −1/[2(100 − x)]. Hence μ(x) = 1/[2(100 − x)]. At x = 84, μ(84) = 1/[2(16)] = 1/32.
Intelligence Tests, Mental Age and IQ
Intelligence tests are standardised instruments designed to measure cognitive abilities such as reasoning, comprehension, memory, numerical and verbal aptitude, and problem-solving. They originated with Binet and Simon (1905) and were refined by Terman (Stanford-Binet) and Wechsler (WAIS, WISC). Tests may be individual or group, verbal or performance-based. They are used in education for identifying gifted and slow learners and for streaming; in clinical settings for diagnosing intellectual disability and learning disorders; in occupational selection and placement; and in research on cognitive development. In India, adaptations such as the Binet-Kamat Test and Bhatia's Battery of Performance Tests are widely used.
Mental age (MA) is the chronological age at which the average child performs at the level demonstrated by the examinee — i.e., the age-equivalent of test performance. Intelligence Quotient (IQ) was originally defined by Stern as the ratio IQ: IQ = (MA / CA) × 100, where CA is chronological age. Wechsler later introduced the deviation IQ, based on standard scores relative to age-group norms, which avoids the statistical problems of ratio IQ in adults. Thus intelligence tests provide a norm-referenced, quantifiable measure of cognitive functioning, though their cultural fairness and predictive limits must be acknowledged.
Overall, the five parts together illustrate the breadth of applied statistics — from national data infrastructure and time-series forecasting to simultaneous-equation econometrics, actuarial life-table methods and psychometrics — each requiring both conceptual clarity and computational precision.
What "Discuss" is asking you to do
Lay the issue out from more than one side — how it arose, what is claimed for it, what is held against it, and where it now stands. UPSC attaches discuss to broad topics with several live dimensions, so coverage of the dimensions earns more than the strength of your opinion.
Structure that answers it
Set the issue up → the case as it is made → the case against → the dimension both sides leave out → where the balance now lies
Where marks are lost
Listing facts with no thread between them, or arguing one side throughout and calling it a discussion.
How this answer will be evaluated
Approach
(a) discuss: intro > 3-4 dimensions > example > balanced close | (b) calculate: given > formula > substitution > result with units > interpretation | (c) discuss: intro > 3-4 dimensions > example > balanced close | (d(i)) derive: given > assumptions > stepwise derivation > result > check | (d(ii)) calculate: given > formula > substitution > result with units > interpretation | (e) define: precise definition > the distinguishing feature > one example Full marks: Comprehensive, accurate, and well-structured answers with clear derivations and interpretations.
Key points expected
- Define Indian Statistical System (ISS) scope
- List key organizations (NSO, CSO, RBI, etc.)
- Explain NSO's role in data collection
- Mention NSO's role in data dissemination
- State AR(1) forecasting formula
- Substitute given mean and phi values
- Calculate 1-step forecast correctly
- Calculate 5-step forecast correctly
Evaluation rubric
Each sub-part is marked on its own, against the marks and word limit printed on the paper.
- (a) Overview of Indian Statistical System and specific workings of NSO. 10 marks
discuss— intro → 3-4 dimensions → example → balanced close
Must cover
- Define Indian Statistical System (ISS) scope
- List key organizations (NSO, CSO, RBI, etc.)
- Explain NSO's role in data collection
- Mention NSO's role in data dissemination
Loses marks
- Confusing NSO with CSO functions
- Listing organizations without explaining their role
Earns more
- Mention NSO's role in census coordination
- Reference to specific NSO surveys (e.g., CPI)
Extra mark
- Mention specific NSO reports or data portals
- (b) Forecasting values for AR(1) model at 1 and 5 time units. 10 marks
calculate— given → formula → substitution → result with units → interpretation
Must cover
- State AR(1) forecasting formula
- Substitute given mean and phi values
- Calculate 1-step forecast correctly
- Calculate 5-step forecast correctly
Loses marks
- Using wrong formula for multi-step forecast
- Arithmetic errors in substitution
Earns more
- Show step-by-step substitution for 5-step
- Interpret the decay of forecast to mean
Extra mark
- Mention confidence interval for forecast
- (c) SLSE structure and why OLS is inappropriate for estimation. 10 marks
discuss— intro → 3-4 dimensions → example → balanced close
Must cover
- Define Simultaneous Linear Statistical Equations
- Explain the structure of SLSE models
- State why OLS is inappropriate (bias)
- Mention endogeneity as the cause
Loses marks
- Failing to link endogeneity to OLS bias
- Confusing SLSE with simple regression
Earns more
- Mention 2SLS or 3SLS as alternatives
- Distinguish between structural and reduced form
Extra mark
- Provide a simple example of simultaneous equations
- (d(i)) Derive the average age at death for those dying between x and x+n.
derive— given → assumptions → stepwise derivation → result → check
Must cover
- Define the integral for average age
- Use survival function l(x) in derivation
- Show the limit of integration
- State the final formula clearly
Loses marks
- Incorrect limits of integration
- Failing to define the survival function
Earns more
- Explain the meaning of the derived formula
- Mention the assumption of uniform distribution
Extra mark
- Relate to life expectancy concepts
- (d(ii)) Calculate μ(84) exactly using the given l(x) function.
calculate— given → formula → substitution → result with units → interpretation
Must cover
- Substitute l(x) into the derived formula
- Perform the integration correctly
- Calculate the exact value for μ(84)
- Show all steps of the calculation
Loses marks
- Arithmetic errors in integration
- Failing to substitute the correct value of x
Earns more
- Verify the result using an alternative method
- Interpret the value in context
Extra mark
- Mention the significance of the exact value
- (e) Define intelligence tests, mental age, and IQ, and explain their use. 10 marks
define— precise definition → the distinguishing feature → one example
Must cover
- Define intelligence tests
- Define mental age
- Define IQ (Intelligence Quotient)
- Explain how these are used in measurement
Loses marks
- Confusing mental age with chronological age
- Failing to explain the formula for IQ
Earns more
- Mention specific types of intelligence tests
- Discuss the limitations of IQ tests
Extra mark
- Reference to Binet-Simon scale or Wechsler scales
Practice this exact question
Write your answer and it is marked point by point against the model answer above — what you covered, what you missed, what you got wrong.
Evaluate my answer →More from Statistics 2024 Paper II
- Q2 (a) Obtain the control limits for X̄-chart and R-chart and describe the significance of j…
- Q3 (a) With respect to a given Linear Programming Problem (LPP), explain the following conce…
- Q4 (a) A manually handled toll-booth has two tellers, who are each capable of handling an av…
- Q5 (a) Discuss the Indian Statistical System. State some important organisations and explain…
- Q6 (a) For the linear model Y = Xβ + u, obtain the expressions for Ordinary Least Squares (O…
- Q7 (a) Explain the problem of identification with a suitable example. Also discuss the condi…
- Q8 (a) Four items are to be constructed so that they are equispaced on the difficulty scale.…