Paper II — Q7
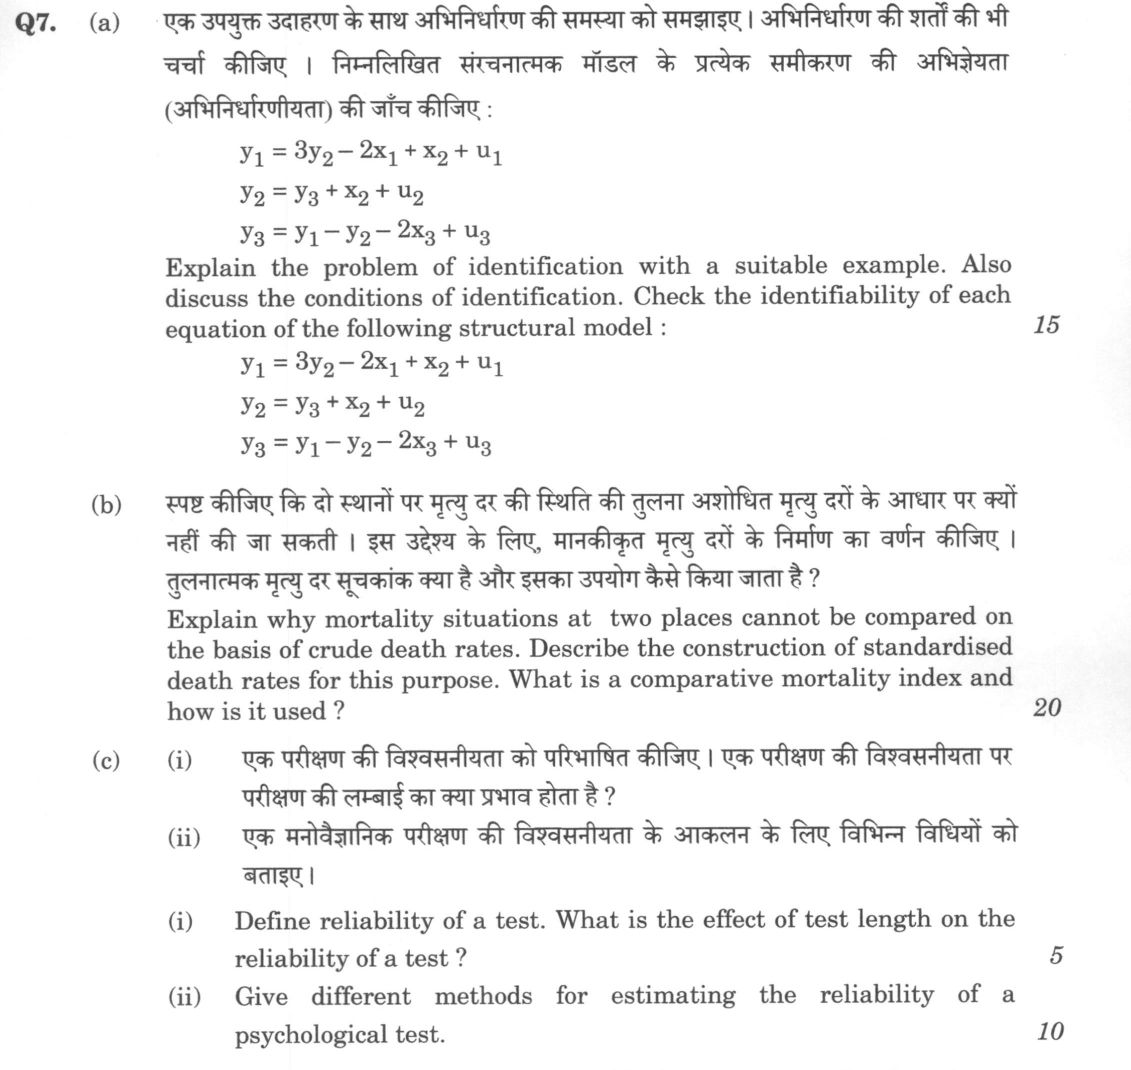
(a) Explain the problem of identification with a suitable example. Also discuss the conditions of identification. Check the…
Explain the problem of identification with a suitable example. Also discuss the conditions of identification. Check the identifiability of each equation of the following structural model :
y₁ = 3y₂ – 2x₁ + x₂ + u₁
y₂ = y₃ + x₂ + u₂
y₃ = y₁ – y₂ – 2x₃ + u₃ 15
Explain why mortality situations at two places cannot be compared on the basis of crude death rates. Describe the construction of standardised death rates for this purpose. What is a comparative mortality index and how is it used ? 20 marks
Define reliability of a test. What is the effect of test length on the reliability of a test ? 5 marks
Give different methods for estimating the reliability of a psychological test. 10 marks
हिंदी में प्रश्न पढ़ें
एक उपयुक्त उदाहरण के साथ अभिनिर्धारण की समस्या को समझाइए। अभिनिर्धारण की शर्तों की भी चर्चा कीजिए । निम्नलिखित संरचनात्मक मॉडल के प्रत्येक समीकरण की अभिज्ञेयता (अभिनिर्धारणीयता) की जाँच कीजिए :
y₁ = 3y₂ – 2x₁ + x₂ + u₁
y₂ = y₃ + x₂ + u₂
y₃ = y₁ – y₂ – 2x₃ + u₃ 15
स्पष्ट कीजिए कि दो स्थानों पर मृत्यु दर की स्थिति की तुलना अशोधित मृत्यु दरों के आधार पर क्यों नहीं की जा सकती । इस उद्देश्य के लिए, मानकीकृत मृत्यु दरों के निर्माण का वर्णन कीजिए । तुलनात्मक मृत्यु दर सूचकांक क्या है और इसका उपयोग कैसे किया जाता है ? 20 marks
एक परीक्षण की विश्वसनीयता को परिभाषित कीजिए । एक परीक्षण की विश्वसनीयता पर परीक्षण की लंबाई का क्या प्रभाव होता है ? 5 marks
एक मनोवैज्ञानिक परीक्षण की विश्वसनीयता के आकलन के लिए विभिन्न विधियों को बताइए । 10
Model answer
Written by UPSC Answer Check against this question's marking rubric, to the expected length. UPSC does not publish answers for Mains — this is one way to score well, not an official key.
Identification. In simultaneous equations, identification asks whether the structural parameters of one equation can be recovered from the reduced form. In a simple market, demand Q=α+βP+γIncome+u and supply Q=δ+θP+v. If only P and Q are observed and no variable shifts only one curve, the reduced form gives only the equilibrium line; β and θ cannot be separated. If Income is excluded from supply, demand is identified; if two excluded variables are available, it is over-identified. An equation is under-identified if too few excluded exogenous variables are available, just-identified if exactly enough, and over-identified if more than enough.
The order condition is K−k≥m−1, where K is total exogenous variables, k included exogenous variables, and m endogenous variables in the equation. The rank condition requires the matrix of coefficients of variables excluded from the equation but present in other equations to have rank M−1, where M is total endogenous variables. If this rank is lower, the equation is not identified even if the order condition holds. Here M=3 and K=3. Equation 1 includes y1 and y2, so m=2; it includes x1 and x2, so k=2; K−k=1=m−1. Excluded y3 and x3 have coefficients (−1,0) and (1,2) in equations 2 and 3, rank 2; hence just-identified. Equation 2 includes y2 and y3, m=2; includes x2, k=1; K−k=2>1. Excluded y1, x1 and x3 have coefficients (1,2,0) and (−1,0,2), rank 2; hence over-identified. Equation 3 includes y1, y2 and y3, m=3; includes x3, k=1; K−k=2=m−1. Excluded x1 and x2 have coefficients (2,−1) and (0,−1), rank 2; hence just-identified.
Mortality comparison. Crude death rates are total deaths divided by total population. They cannot be compared directly because age-sex composition differs: Kerala has a larger elderly share, so its crude rate may be higher than Bihar or Uttar Pradesh even if age-specific risks are lower; younger states appear artificially healthier. A high CDR may therefore reflect an old age structure rather than poor health. Standardisation removes this compositional effect. Direct standardisation applies the study population’s age-specific rates m_a to a standard population P_a^s: ASR=ΣP_a^s m_a/ΣP_a^s. It is useful when age-specific rates are stable. Indirect standardisation applies standard age-specific rates M_a^s to the study population P_a: expected deaths E=ΣP_a M_a^s; SMR=ΣP_a M_a^s/ΣP_a; if a rate is needed, multiply SMR by the standard crude rate. It is useful when age-specific rates are unstable.
A comparative mortality index compares a region’s mortality with a standard. For indirect standardisation, CMI=ΣP_a m_a/ΣP_a M_a^s×100, i.e. observed deaths divided by expected deaths using the region’s own age distribution. For direct-standardised comparison, CMI=[ΣP_a^s m_a/ΣP_a^s]/[ΣP_a^s M_a^s/ΣP_a^s]×100=ΣP_a^s m_a/ΣP_a^s M_a^s×100. A CMI above 100 indicates mortality above the standard, below 100 below it; it allows ranking states or districts relative to a common standard.
Reliability. Reliability is the proportion of observed score variance due to true score variance: r=σ_T^2/σ_X^2, where X=T+E and error is uncorrelated with true score. Test length affects reliability through the Spearman-Brown prophecy formula, r_L=n r/[1+(n−1)r], where n is new length divided by original length. Longer tests reduce random error and raise reliability, but with diminishing returns. A longer test with similar items is therefore more reliable than a shorter one.
Methods include test-retest, which correlates the same test administered twice but is affected by practice effects; parallel forms, which correlates equivalent forms; and split-half, which divides items into halves, correlates them, and corrects with Spearman-Brown. For dichotomous items, KR-20 is r_20=k/(k−1)[1−Σp_iq_i/σ_X^2]; KR-21 assumes equal item difficulty and is r_21=k/(k−1)[1−k p(1−p)/σ_X^2], where p=M/k. Cronbach’s alpha generalises this to continuous items: α=k/(k−1)[1−Σσ_i^2/σ_X^2]. Thus identification, standardisation and reliability all require removing confounding—simultaneity, age composition and measurement error—to recover the underlying parameter.
What "Explain" is asking you to do
Make the working of something clear — what sets it off, what follows from what, and what it produces. Explain is the Commission's mechanism word: it dominates the technical papers and the “explain why” stems, where the marks sit in the causal chain and not in the label.
Structure that answers it
State what it is → the initiating condition → the chain of cause, step by step → an instance where it plays out → what the chain produces
Where marks are lost
Describing what something looks like instead of why it works that way. Naming the stages without linking them reads as description too.
How this answer will be evaluated
Approach
Framework: Simultaneous Equation Models (SEM) Identification; Demographic Standardization; Psychometric Reliability. (a) explain: definition of identification problem > order and rank conditions > application to given model | (b) explain: limitations of crude rates > construction of standardised rates > comparative mortality index | (c) explain: definition of reliability > effect of test length > estimation methods Full marks: Rigorous application of SEM conditions; clear distinction of standardization methods; precise psychometric definitions.
Key points expected
- Order Condition: G - Gi > Mi - 1
- Rank Condition: Rank of excluded exogenous variables
- Direct Standardization: (Σ expected deaths) / (Σ standard population)
- Indirect Standardization: (Observed deaths) / (Expected deaths)
- Spearman-Brown Prophecy Formula
- Cronbach's Alpha
Evaluation rubric
Each sub-part is marked on its own, against the marks and word limit printed on the paper.
- (a) Define identification, state order/rank conditions, and verify for the 3-equation model. 15 marks
explain— definition of identification problem → order and rank conditions → application to given model
Must cover
- Define identification problem in SEM
- State Order Condition (G - Gi > Mi - 1)
- State Rank Condition (rank of excluded variables)
- Apply conditions to each of the 3 equations
Loses marks
- Confusing endogenous and exogenous variables
- Skipping the rank condition check
Earns more
- Correctly identifies y1 as under-identified
- Correctly identifies y2 as exactly identified
- Correctly identifies y3 as over-identified
- Clear matrix representation for rank check
Extra mark
- Mention of Zellner's theorem
- (b) Explain limitations of crude rates, describe standardization methods, and define CMI. 20 marks
explain— limitations of crude rates → construction of standardised rates → comparative mortality index
Must cover
- Explain age/sex structure bias in crude rates
- Describe Direct Standardization method
- Describe Indirect Standardization method
- Define Comparative Mortality Index (CMI)
Loses marks
- Confusing direct and indirect methods
- Failing to link CMI to standardization
Earns more
- Formula for Direct Standardized Rate
- Formula for Indirect Standardized Rate (SMR)
- Example of CMI calculation
- Mention of standard population choice
Extra mark
- Mention of WHO standard population
- (c) Define reliability, explain test length effect, and list estimation methods. 15 marks
explain— definition of reliability → effect of test length → estimation methods
Must cover
- Define reliability (consistency of measurement)
- Explain Spearman-Brown prophecy formula
- List Test-Retest method
- List Split-Half method
Loses marks
- Confusing reliability with validity
- Failing to mention Spearman-Brown for length effect
Earns more
- Mention of Cronbach's Alpha
- Mention of Parallel Forms method
- Distinction between reliability and validity
- Formula for Spearman-Brown
Extra mark
- Mention of Kuder-Richardson formula
Practice this exact question
Write your answer and it is marked point by point against the model answer above — what you covered, what you missed, what you got wrong.
Evaluate my answer →More from Statistics 2024 Paper II
- Q4 (a) A manually handled toll-booth has two tellers, who are each capable of handling an av…
- Q5 (a) Discuss the Indian Statistical System. State some important organisations and explain…
- Q6 (a) For the linear model Y = Xβ + u, obtain the expressions for Ordinary Least Squares (O…
- Q7 (a) Explain the problem of identification with a suitable example. Also discuss the condi…
- Q8 (a) Four items are to be constructed so that they are equispaced on the difficulty scale.…