Paper I — Q7
(a) Analyse and interpret the following data concerning output of wheat per field obtained as a result of experiment conducted to…
Analyse and interpret the following data concerning output of wheat per field obtained as a result of experiment conducted to test four varieties of wheat A, B, C and D under a Latin square design at 5% level of significance. [Given F(3, 6) = 4·76; F(4, 7) = 4·12] 20 marks
Explain the need of factorial experiments with an example from pharmaceutical study. 6 marks
Divide the 16 treatments of 2⁴ factorial experiment into 4 blocks of 4 treatments each, confounding the interaction effect AB and CD completely with blocks. Which other interaction is automatically confounded in this design ? 9 marks
Define Horvitz-Thompson estimator for estimating the population total, and show that it is unbiased for probability proportional to size sampling without replacement. Also find its sampling variance. 15 marks
हिंदी में प्रश्न पढ़ें
गेहूँ की चार किस्मों A, B, C और D के परीक्षण के लिए किये गये प्रयोग के परिणाम स्वरूप प्रति खेत गेहूँ के उत्पादन से संबंधित निम्नलिखित आँकड़ों का विश्लेषण और व्याख्या कीजिए, जो 5% सार्थकता स्तर पर एक लैटिन वर्ग अभिकल्पना के अंतर्गत किया गया हो । [दिया गया है F(3, 6) = 4·76; F(4, 7) = 4·12] (20 अंक)
बहु-उपादानी प्रयोगों की आवश्यकता की, एक औषध अध्ययन के उदाहरण के साथ, व्याख्या कीजिए। (6 अंक)
2⁴ बहु-उपादानी प्रयोग के 16 उपचारों को 4 समूहों में, प्रत्येक में 4 उपचारों के साथ, विभाजित कीजिए, जिसमें अन्योन्य क्रिया प्रभाव AB और CD को समूहों के साथ पूरी तरह से संकरण किया गया है। इस अभिकल्पना में कौन सी अन्य अन्योन्य क्रिया स्वचालित रूप से संकरित होती है ? (9 अंक)
हारविट्ज-थॉम्पसन आकलक को समष्टि योग का आकलन करने के लिए परिभाषित कीजिए, और दर्शाइए कि यह आकार के समानुपात प्रायिकता वाले प्रतिचयन, प्रतिस्थापन रहित, के लिए अनभिनत है। इस का प्रतिचयन प्रसरण भी ज्ञात कीजिए। (15 अंक)
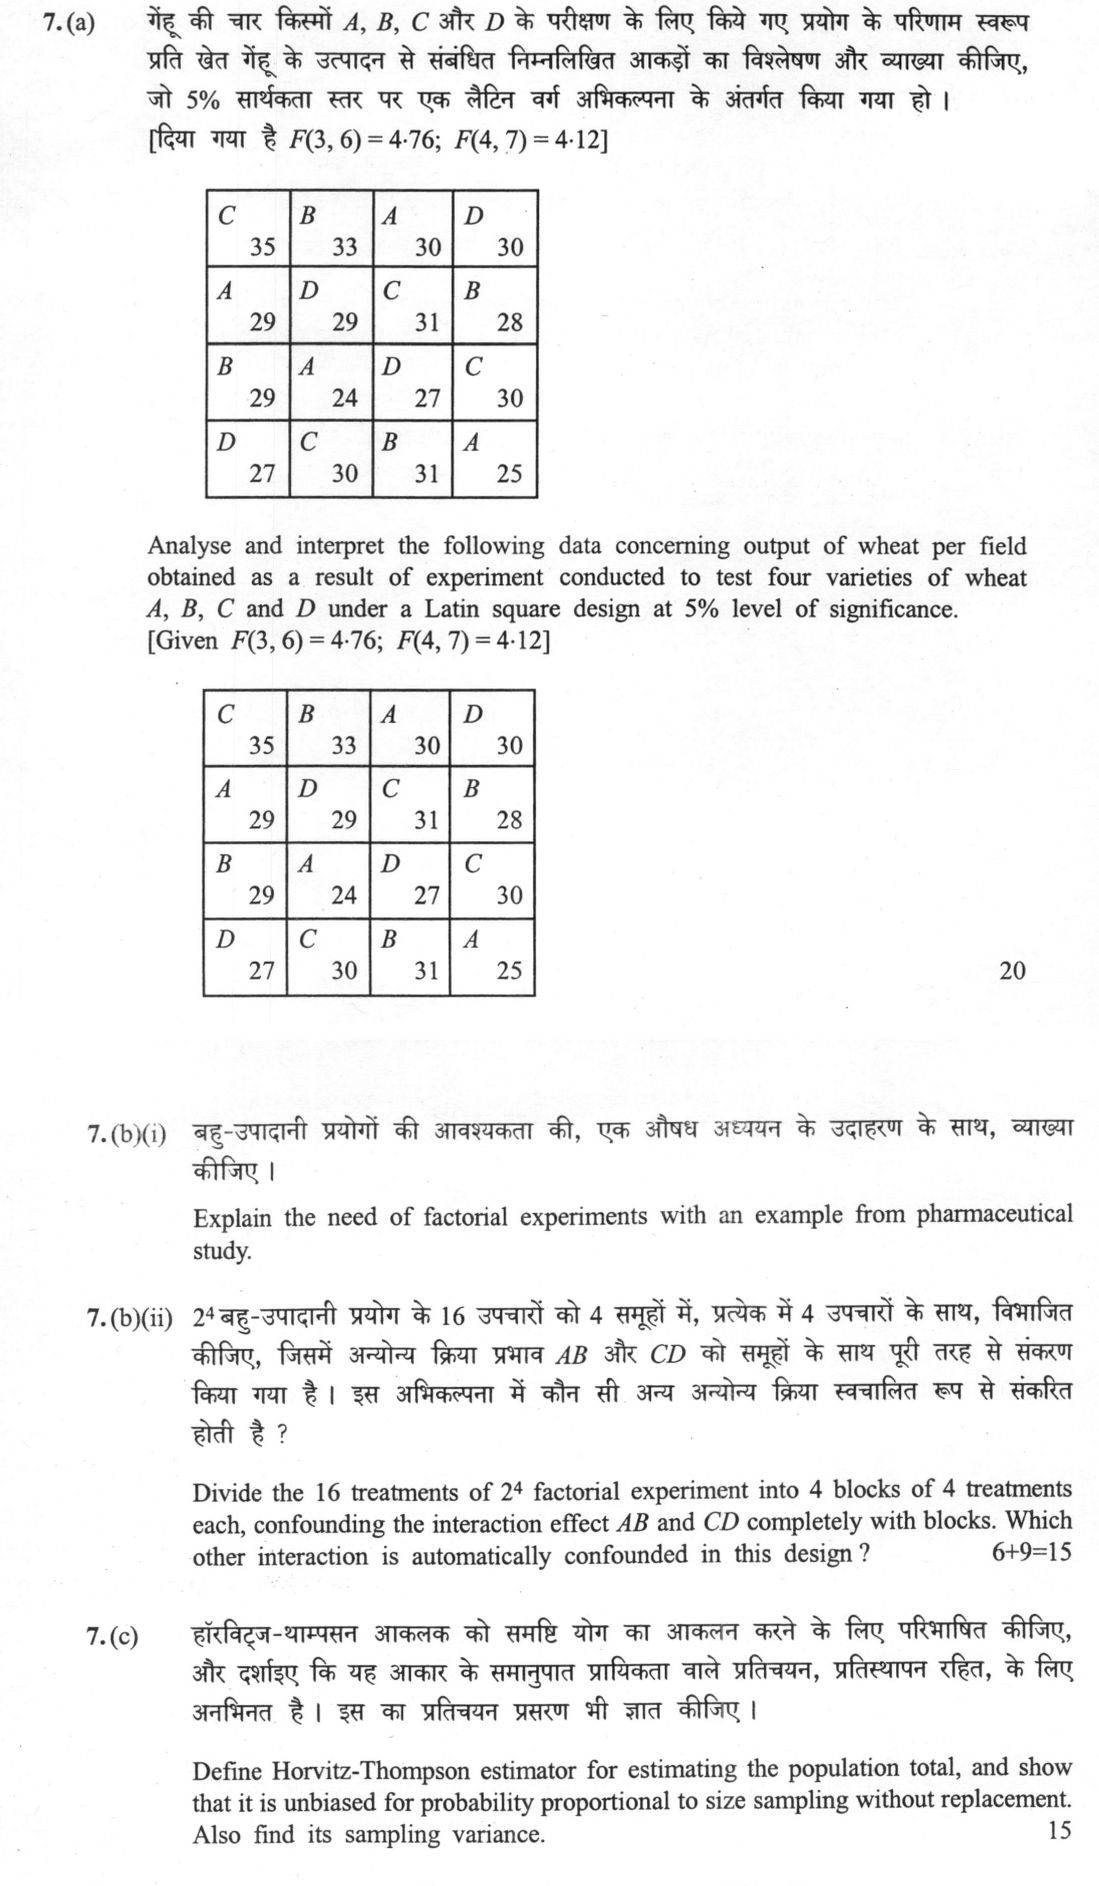
The figure this question refers to, in words
The question paper is a scan and the diagram did not survive as text. This is the figure as read from the original page — every component, value and label — so the question can be worked from the text below.
(a) A 4x4 grid table representing a Latin square design. The table contains 16 cells. Each cell has a letter (A, B, C, or D) in the top-left corner and a number in the bottom-left corner. The rows and columns are not explicitly labeled with headers, but the arrangement is as follows:
Row 1: Cell 1 (C, 35), Cell 2 (B, 33), Cell 3 (A, 30), Cell 4 (D, 30) Row 2: Cell 1 (A, 29), Cell 2 (D, 29), Cell 3 (C, 31), Cell 4 (B, 28) Row 3: Cell 1 (B, 29), Cell 2 (A, 24), Cell 3 (D, 27), Cell 4 (C, 30) Row 4: Cell 1 (D, 27), Cell 2 (C, 30), Cell 3 (B, 31), Cell 4 (A, 25)
Model answer
Written by UPSC Answer Check against this question's marking rubric, to the expected length. UPSC does not publish answers for Mains — this is one way to score well, not an official key.
(a) Latin square analysis. For a 4×4 square, p=4 and N=16. The row totals are 128, 117, 110 and 113; column totals are 120, 116, 119 and 113; treatment totals are A=108, B=121, C=126 and D=113; grand total G=468. The correction factor is CF=G²/N=219024/16=13689. Since Σy²=13802, total SS=13802−13689=113. Row SS=(128²+117²+110²+113²)/4−CF=46.5; column SS=(120²+116²+119²+113²)/4−CF=7.5; treatment SS=(108²+121²+126²+113²)/4−CF=48.5; error SS=113−46.5−7.5−48.5=10.5. The degrees of freedom are rows 3, columns 3, varieties 3, error 6 and total 15; the error df are (p−1)(p−2)=6. The mean squares are rows 15.5, columns 2.5, varieties 16.17 and error 1.75. Thus the analysis partitions the total variation into row, column, treatment and error components, and the treatment test uses error as the denominator. The F-statistic for varieties is 16.17/1.75=9.24. Since 9.24 exceeds F(3,6)=4.76, H0 that the four varieties have equal mean output is rejected at 5%. The row F=8.86 is significant, while column F=1.43 is not; the other tabulated value F(4,7)=4.12 does not match the df (3,6) of this test and is not used. The treatment means are A=27.00, B=30.25, C=31.50 and D=28.25, so the significant difference is consistent with C giving higher output and A lower output. The significant treatment F means the varieties are not statistically indistinguishable, after the Latin square has removed row and column heterogeneity.
(b)(i) Need for factorial experiments. Factorial experiments are needed when two or more factors may affect a response, because they estimate main effects and interactions in one experiment, use fewer observations than separate one-factor-at-a-time trials, and reveal whether the effect of one factor depends on another. It also allows estimation of interaction effects, which are central in drug-response studies. In an Indian pharmaceutical study, a 2² design can test dose (low/high) and administration timing (morning/evening) on plasma concentration or recovery; it can detect that a high dose is effective only at a particular timing, which single-factor trials would miss.
(b)(ii) Confounding AB and CD. Code the 16 treatments as (a,b,c,d) with 0/1. Use block generators L1=a+b mod2 for AB and L2=c+d mod2 for CD. The four blocks are: I (0,0): (1), ab, cd, abcd; II (1,0): a, b, acd, bcd; III (0,1): c, abc, d, abd; IV (1,1): ac, bc, ad, bd. Each block contains four treatment combinations, and the 16 combinations appear exactly once. In each block AB and CD have constant sign, so both are completely confounded with blocks. The product of the two defining contrasts is AB×CD=ABCD; hence ABCD is automatically confounded with blocks.
(c) Horvitz–Thompson estimator. Let U=1,...,N, values yᵢ, sizes xᵢ, X=Σxᵢ. In PPSWOR of fixed size n, take first-order inclusion probabilities πᵢ=n xᵢ/X, with πᵢ≤1. The HT estimator of total Y=Σyᵢ is hat Y_HT=Σᵢ∈s yᵢ/πᵢ=Σᵢ∈U Iᵢ yᵢ/πᵢ, where Iᵢ=1 if i is sampled. Since E(Iᵢ)=πᵢ, E(hat Y_HT)=Σᵢ πᵢ yᵢ/πᵢ=Y, so it is unbiased. The estimator is design-based and does not require a model for yᵢ. For variance, write aᵢ=yᵢ/πᵢ. Then Var(hat Y_HT)=Σᵢ aᵢ² Var(Iᵢ)+2Σᵢ<j aᵢ aⱼ Cov(Iᵢ,Iⱼ). Using Var(Iᵢ)=πᵢ(1−πᵢ) and Cov(Iᵢ,Iⱼ)=πᵢⱼ−πᵢπⱼ, where πᵢⱼ=P(i,j∈s) and πᵢᵢ=πᵢ, this gives Var(hat Y_HT)=Σᵢ (1−πᵢ)yᵢ²/πᵢ + Σᵢ≠j(πᵢⱼ−πᵢπⱼ)yᵢ yⱼ/(πᵢπⱼ). The sums are over the finite population U; the second sum is over ordered pairs i≠j. For PPSWOR, substitute πᵢ=n xᵢ/X and the appropriate second-order probabilities of the chosen PPSWOR scheme; this is the design-based sampling variance of the HT total estimator.
What "Analyse" is asking you to do
Break the subject into its working parts and show how they act on each other. The marks are in the interconnections — which factor drives which, and what the resulting structure explains — not in the inventory of factors.
Structure that answers it
Define the whole → separate it into its parts → show which part drives which → what that interaction produces → what the structure implies
Where marks are lost
A flat list of causes with no account of which drives which. An answer of neatly separated headings, each self-contained, scores as description.
How this answer will be evaluated
Approach
Framework: UPSC Statistics Paper 1. (a) analyse: intro > causes > effects > stakeholders/linkages > way forward | (b(i)) explain: definition/context > points in order > small example > short close | (b(ii)) calculate: given > formula > substitution > result with units > interpretation | (c) derive: given > assumptions > stepwise derivation > result > check Full marks: Flawless ANOVA, correct block design, rigorous HT derivation
Key points expected
- Compute row, column, and treatment totals
- Calculate Sum of Squares for all sources
- Construct ANOVA table with F-ratios
- Compare F-values with given critical values
- Define factorial experiment concept
- Highlight advantage of studying interactions
- Provide specific pharmaceutical example
- Mention efficiency over one-factor-at-a-time
Evaluation rubric
Each sub-part is marked on its own, against the marks and word limit printed on the paper.
- (a) Perform ANOVA for Latin Square Design and interpret results. 20 marks
analyse— intro → causes → effects → stakeholders/linkages → way forward
Must cover
- Compute row, column, and treatment totals
- Calculate Sum of Squares for all sources
- Construct ANOVA table with F-ratios
- Compare F-values with given critical values
Loses marks
- Arithmetic errors in SS calculation
- Missing degrees of freedom in table
- No interpretation of F-test result
Earns more
- Correct calculation of Correction Factor
- Explicit statement of null hypothesis
- Clear interpretation of significant differences
Extra mark
- Mention of assumptions of LSD
- (b(i)) Explain the need for factorial experiments with a pharmaceutical example. 6 marks
explain— definition/context → points in order → small example → short close
Must cover
- Define factorial experiment concept
- Highlight advantage of studying interactions
- Provide specific pharmaceutical example
- Mention efficiency over one-factor-at-a-time
Loses marks
- Generic example without context
- Failure to mention interaction effects
Earns more
- Example involving dose and time
- Mention of resource efficiency
Extra mark
- Reference to specific drug trial
- (b(ii)) Divide 2^4 treatments into 4 blocks confounding AB and CD. 9 marks
calculate— given → formula → substitution → result with units → interpretation
Must cover
- Identify defining relation for blocks
- List 4 treatments for each of 4 blocks
- Identify the automatically confounded interaction
- Show calculation of block defining contrast
Loses marks
- Incorrect block assignment
- Failure to identify ABCD interaction
Earns more
- Correct identification of ABCD interaction
- Clear tabulation of treatment combinations
Extra mark
- Mention of loss of degrees of freedom
- (c) Define Horvitz-Thompson estimator and prove unbiasedness for PPS sampling. 15 marks
derive— given → assumptions → stepwise derivation → result → check
Must cover
- Define HT estimator formula for total
- Show expectation equals population total
- Derive sampling variance formula
- State PPS sampling without replacement context
Loses marks
- Incorrect variance formula
- Missing proof of unbiasedness
Earns more
- Correct notation for inclusion probabilities
- Step-by-step algebraic derivation
Extra mark
- Mention of Brewer-Hansen estimator
Practice this exact question
Write your answer and it is marked point by point against the model answer above — what you covered, what you missed, what you got wrong.
Evaluate my answer →More from Statistics 2025 Paper I
- Q4 (a) Let X₁, X₂, ... be a sequence of random variables from Bernoulli distribution with me…
- Q5 (a) For a two variable linear regression model Yᵢ = a + bXᵢ + eᵢ, where E(eᵢ) = 0, Var(eᵢ…
- Q6 (a)(i) If (X, Y) follows bivariate normal BN(μ₁, μ₂, σ₁², σ₂², ρ), then obtain (A) E(e^X)…
- Q7 (a) Analyse and interpret the following data concerning output of wheat per field obtaine…
- Q8 (a)(i) What are principal components ? Show that the principal components are uncorrelate…