Paper I — Q6
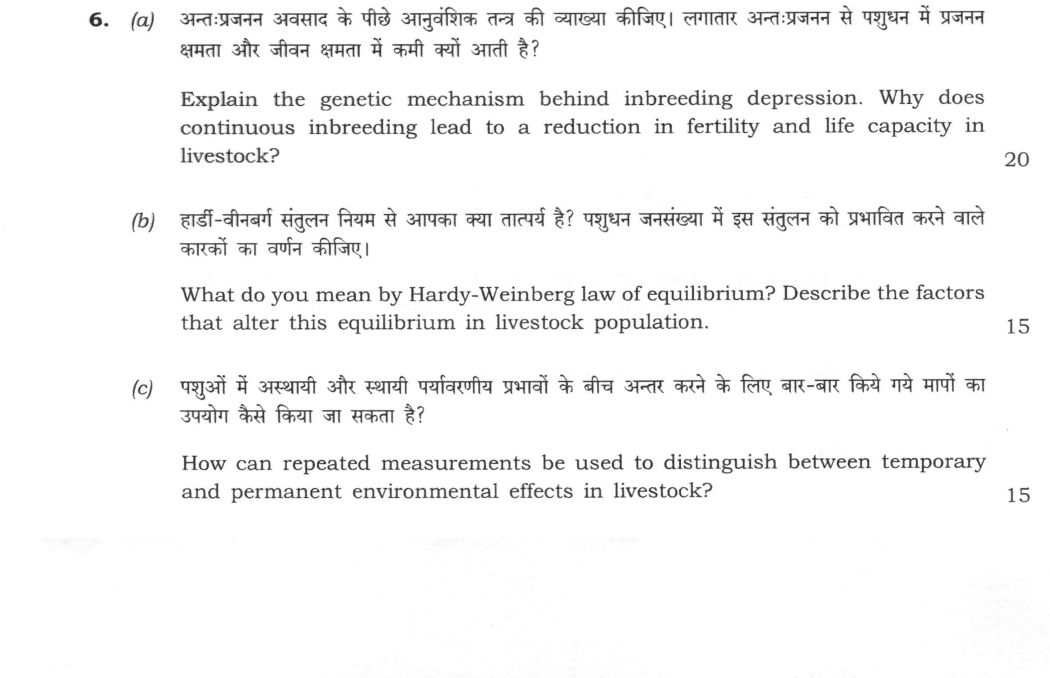
(a) Explain the genetic mechanism behind inbreeding depression. Why does continuous inbreeding lead to a reduction in fertility…
Explain the genetic mechanism behind inbreeding depression. Why does continuous inbreeding lead to a reduction in fertility and life capacity in livestock? 20 marks
What do you mean by Hardy-Weinberg law of equilibrium? Describe the factors that alter this equilibrium in livestock population. 15 marks
How can repeated measurements be used to distinguish between temporary and permanent environmental effects in livestock? 15 marks
हिंदी में प्रश्न पढ़ें
अन्तःप्रजनन अवसाद के पीछे आनुवंशिक तन्त्र की व्याख्या कीजिए। लगातार अन्तःप्रजनन से पशुधन में प्रजनन क्षमता और जीवन क्षमता में कमी क्यों आती है? (20 अंक)
हार्डी-वीनबर्ग संतुलन नियम से आपका क्या तात्पर्य है? पशुधन जनसंख्या में इस संतुलन को प्रभावित करने वाले कारकों का वर्णन कीजिए। (15 अंक)
पशुओं में अस्थायी और स्थायी पर्यावरणीय प्रभावों के बीच अन्तर करने के लिए बार-बार किये गये मापों का उपयोग कैसे किया जा सकता है? (15 अंक)
Model answer
Drafted with AI by UPSC Answer Check against this question's marking rubric, to the expected length. UPSC does not publish answers for Mains — this is one way to score well, not an official key. How we build rubrics and answers.
(a) Genetic mechanism of inbreeding depression and its effect on fertility and life capacity (20 marks)
Inbreeding depression is the decline in the mean performance of inbred animals, in traits such as fertility, survival, growth and production, compared with the non-inbred population. Inbreeding (mating of relatives) raises the inbreeding coefficient F, so heterozygosity falls by the fraction F and homozygosity rises correspondingly.
Genetic mechanism, two explanations:
- Dominance (partial dominance) hypothesis: populations carry many deleterious recessive alleles at low frequency, hidden in heterozygotes by the dominant normal allele. Inbreeding makes these loci homozygous, exposing the recessive alleles, so harmful effects appear, from mild loss of vigour to sub-lethal and lethal defects (as in genetic defects of cattle such as BLAD and complex vertebral malformation).
- Overdominance hypothesis: heterozygotes at some loci are superior to both homozygotes, and inbreeding, by reducing heterozygosity, loses this advantage. It is a less general explanation. Epistasis, the break-up of co-adapted gene combinations, adds to the depression.
The decline in the mean for a trait is roughly proportional to F: ΔM = −F × (the sum of dominance effects over the loci, 2Σdpq). So it is larger where dominance is greater and the inbreeding higher, and it does not occur for traits with purely additive genes.
Why fertility and life capacity fall: fitness traits (fertility, conception, embryo and calf survival, birth weight, viability, disease resistance, longevity) show more directional dominance, since natural and artificial selection has made favourable alleles common and dominant, while the unfavourable ones persist as hidden recessives. So these traits show the largest inbreeding depression. In practice:
- lower conception rate, more embryonic and fetal death, smaller litters and lower semen quality;
- more stillbirths, lower birth weight and calf survival, slower growth and later maturity;
- lower immunity, and so more disease and shorter productive life.
Control: avoid mating close relatives, keep inbreeding rate low (ΔF = 1/2N_e) with enough sires, use rotational mating and crossbreeding, and cull carriers and defective individuals.
(b) Hardy-Weinberg law of equilibrium and factors altering it in livestock populations (15 marks)
The Hardy-Weinberg law states that, in a large population with random mating, and without mutation, migration, selection or genetic drift, the gene frequencies and genotype frequencies remain constant from generation to generation. For an autosomal locus with two alleles at frequencies p and q (p + q = 1), the genotype frequencies after one generation of random mating are p² (AA), 2pq (Aa) and q² (aa), so p² + 2pq + q² = 1. For example, if q = 0.2, then aa = 0.04, Aa = 0.32 and AA = 0.64. The equilibrium is reached in a single generation for an autosomal locus (several generations for a sex-linked one), and it can be tested by the chi-square test.
Factors that alter the equilibrium in livestock:
- Selection: culling and preferential use of bulls and cows in breeding change gene frequencies; this is the chief tool of the breeder.
- Mutation: a small, slow change, unless there is repeated mutation.
- Migration (gene flow): introduction of animals or semen (artificial insemination, importation, crossbreeding) alters the frequencies.
- Genetic drift: a small population, a closed herd, or the use of only a few sires produces random change in frequencies (bottleneck and founder effects).
- Non-random mating: inbreeding changes genotype frequencies (more homozygotes) and assortative mating does likewise, but neither alters the gene frequencies.
- Small population size and overlapping generations also disturb the equilibrium.
(c) Use of repeated measurements to distinguish temporary and permanent environmental effects (15 marks)
Many traits in livestock are measured repeatedly on the same animal (milk yield in successive lactations, litter size, fleece weight, calving interval). The record of an animal in one measurement is the sum of its genetic value (additive genes, A), a permanent environmental effect (P_e) and a temporary environmental effect (T_e): P_ij = μ + A_i + P_e,i + T_e,ij.
- Permanent environmental effects are non-genetic effects common to all the records of an animal, such as udder damage, early nutrition and body size, and the environment of its growth, together with non-additive gene effects.
- Temporary environmental effects act on one record only, such as the year, season, feeding, disease or calving in a particular lactation.
How records separate them: the variance between animals is σ²(A) + σ²(Pe) (and non-additive), while the variance within animals (between records of the same animal) is σ²(Te). Analysis of variance of repeated records gives the between-animal component and the within-animal component, and their ratio is the repeatability r = [σ²(A) + σ²(Pe)]/σ²(P), the intraclass correlation of records. Then:
- temporary environment variance fraction = 1 − r;
- permanent environment variance fraction = r − h², when the heritability h² is known from another source (sire or parent-offspring analysis), since r is an upper limit for h².
Uses: r shows how reliably the first record predicts future ones (milk yield about 0.4 to 0.6; litter size only about 0.1 to 0.2); the heritability of the average of n records is n h²/[1 + (n − 1)r], so more records improve selection where r is low; and the estimate is used in predicting most probable producing ability, culling decisions and BLUP repeatability models.
How this answer will be evaluated
Evaluation rubric
Each sub-part is marked on its own, against the marks and word limit printed on the paper.
- (a) (a) Explain the genetic mechanism behind inbreeding depression; why does continuous inbreeding reduce fertility and life capacity in livestock (20). 20 marks
Must cover
- Inbreeding raises homozygosity by F and lowers heterozygosity
- Dominance hypothesis: unmasking of deleterious recessives; overdominance and epistasis as further explanations
- Depression is proportional to F and to dominance; larger for fitness traits with directional dominance
- Effects on fertility, embryo and calf survival, growth, immunity and longevity; control measures
Loses marks
- Confusing inbreeding depression with loss of heterosis in crossbreds only.
- Stating that inbreeding changes gene frequencies directly.
- No link to fitness traits.
Earns more
- Formula ΔM = −F·2Σdpq.
- Lethal recessives (BLAD, CVM).
Extra mark
- ΔF = 1/2N_e
- (b) (b) What is the Hardy-Weinberg law of equilibrium; describe the factors that alter this equilibrium in livestock populations (15). 15 marks
Must cover
- Statement: gene and genotype frequencies constant in a large, randomly mating population without mutation, migration, selection or drift
- Genotype frequencies p², 2pq, q² with a numerical example
- Factors: selection, mutation, migration or gene flow (AI, crossbreeding), genetic drift
- Non-random mating changes genotype but not gene frequencies; small population
Loses marks
- Stating that inbreeding changes gene frequencies.
- Wrong expansion of the binomial.
- Missing conditions of the law.
Earns more
- Equilibrium in one generation for autosomal loci.
- Chi-square test.
Extra mark
- Sex-linked loci need several generations
- (c) (c) How can repeated measurements be used to distinguish temporary and permanent environmental effects in livestock (15). 15 marks
Must cover
- Model: record = genetic value + permanent environment + temporary environment
- Permanent effects common to all records of an animal; temporary effects specific to a record
- Variance between animals versus within animals; repeatability r as intraclass correlation
- Temporary fraction 1 − r; permanent fraction r − h²; uses of repeatability (accuracy, culling)
Loses marks
- Confusing repeatability with heritability.
- Treating all environment as temporary.
- No use of the variance components.
Earns more
- Typical values (milk yield 0.4–0.6, litter size 0.1–0.2).
- Heritability of the mean of n records.
Extra mark
- BLUP repeatability model
What "Explain" is asking you to do
Make the working of something clear — what sets it off, what follows from what, and what it produces. Explain is the Commission's mechanism word: it dominates the technical papers and the “explain why” stems, where the marks sit in the causal chain and not in the label.
Structure that answers it
State what it is → the initiating condition → the chain of cause, step by step → an instance where it plays out → what the chain produces
Where marks are lost
Describing what something looks like instead of why it works that way. Naming the stages without linking them reads as description too.
Practice this exact question
Write your answer and it is marked point by point against the model answer above — what you covered, what you missed, what you got wrong.
Evaluate my answer →More from Animal Husbandry & Veterinary Science 2026 Paper I
- Q3 (a) Explain why animals with high metabolic rate require more complex excretory and circu…
- Q4 (a) “Silent heat is not a disease, but a failure of management.” Critically evaluate this…
- Q5 Write notes on/Answer the following in about 150 words each : (a) Impact of genetic drift…
- Q6 (a) Explain the genetic mechanism behind inbreeding depression. Why does continuous inbre…
- Q7 (a) How do you estimate the cost of milk production in organised and unorganised dairy se…
- Q8 (a) (i) How do you assess the training needs of rural farmers to ensure that they are rel…