Paper II — Q2
(a) A construction company is planning to purchase an excavation equipment for operating a borrow soil pit that will last 5…
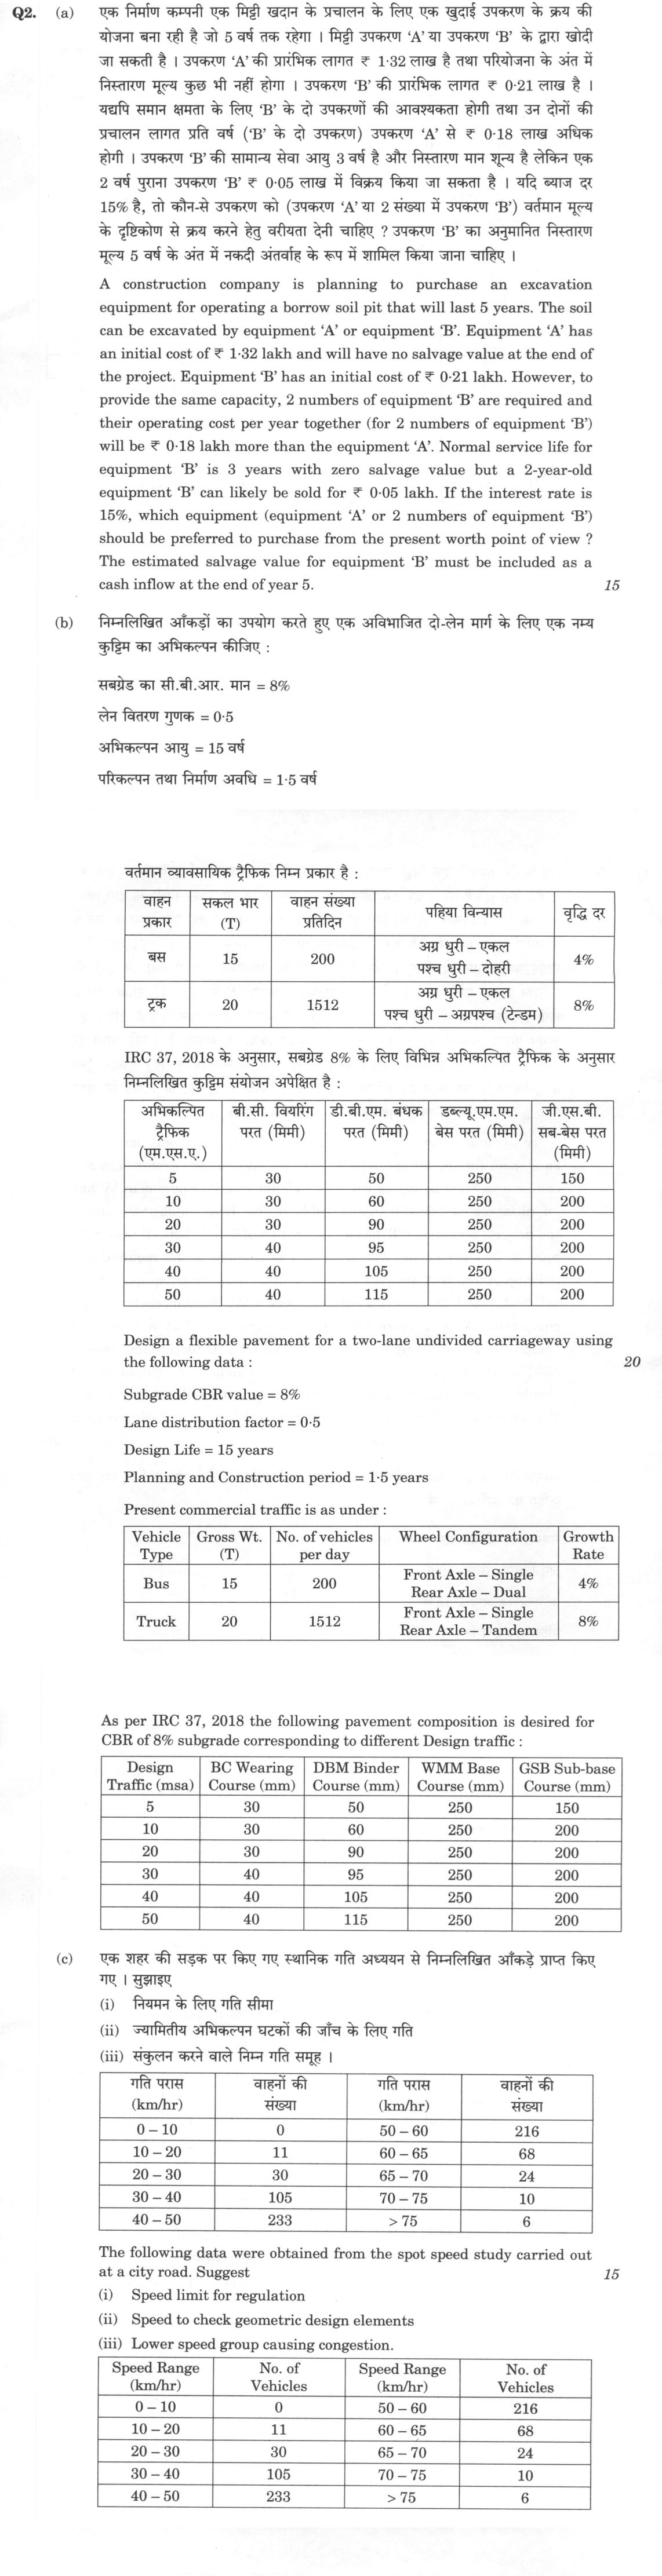
A construction company is planning to purchase an excavation equipment for operating a borrow soil pit that will last 5 years. The soil can be excavated by equipment 'A' or equipment 'B'. Equipment 'A' has an initial cost of ₹ 1·32 lakh and will have no salvage value at the end of the project. Equipment 'B' has an initial cost of ₹ 0·21 lakh. However, to provide the same capacity, 2 numbers of equipment 'B' are required and their operating cost per year together (for 2 numbers of equipment 'B') will be ₹ 0·18 lakh more than the equipment 'A'. Normal service life for equipment 'B' is 3 years with zero salvage value but a 2-year-old equipment 'B' can likely be sold for ₹ 0·05 lakh. If the interest rate is 15%, which equipment (equipment 'A' or 2 numbers of equipment 'B') should be preferred to purchase from the present worth point of view? The estimated salvage value for equipment 'B' must be included as a cash inflow at the end of year 5. 15 marks
Design a flexible pavement for a two-lane undivided carriageway using the following data: Subgrade CBR value = 8%, Lane distribution factor = 0·5, Design Life = 15 years, Planning and Construction period = 1·5 years. Present commercial traffic is as under: Bus (Gross Wt. 15T, 200 vehicles/day, Front Axle – Single, Rear Axle – Dual, Growth Rate 4%), Truck (Gross Wt. 20T, 1512 vehicles/day, Front Axle – Single, Rear Axle – Tandem, Growth Rate 8%). As per IRC 37, 2018 the following pavement composition is desired for CBR of 8% subgrade corresponding to different Design traffic: [Table showing Design Traffic (msa) vs pavement layers]. 15 marks
The following data were obtained from the spot speed study carried out at a city road. Suggest (i) Speed limit for regulation, (ii) Speed to check geometric design elements, (iii) Lower speed group causing congestion. [Table showing Speed Range (km/hr) vs No. of Vehicles]. 15 marks
हिंदी में प्रश्न पढ़ें
एक निर्माण कम्पनी एक मिट्टी खदान के प्रचालन के लिए एक खुदाई उपकरण के क्रय की योजना बना रही है जो 5 वर्ष तक रहेगा। मिट्टी उपकरण 'A' या उपकरण 'B' के द्वारा खोदी जा सकती है। उपकरण 'A' की प्रारंभिक लागत ₹ 1·32 लाख है तथा परियोजना के अंत में निस्तारण मूल्य कुछ भी नहीं होगा। उपकरण 'B' की प्रारंभिक लागत ₹ 0·21 लाख है। यद्यपि समान क्षमता के लिए 'B' के दो उपकरणों की आवश्यकता होगी तथा उन दोनों की प्रचालन लागत प्रति वर्ष ('B' के दो उपकरण) उपकरण 'A' से ₹ 0·18 लाख अधिक होगी। उपकरण 'B' की सामान्य सेवा आयु 3 वर्ष है और निस्तारण मान शून्य है लेकिन एक 2 वर्ष पुराना उपकरण 'B' ₹ 0·05 लाख में विक्रय किया जा सकता है। यदि ब्याज दर 15% है, तो कौन-से उपकरण को (उपकरण 'A' या 2 संख्या में उपकरण 'B') वर्तमान मूल्य के दृष्टिकोण से क्रय करने हेतु वरीयता देनी चाहिए? उपकरण 'B' का अनुमानित निस्तारण मूल्य 5 वर्ष के अंत में नकदी अंतवाह के रूप में शामिल किया जाना चाहिए। (15 अंक)
निम्नलिखित आँकड़ों का उपयोग करते हुए एक अविभाजित दो-लेन मार्ग के लिए एक नम्य कुशिंग का अभिकल्पन कीजिए: सबग्रेड का सी.बी.आर. मान = 8%, लेन वितरण गुणक = 0·5, अभिकल्पन आयु = 15 वर्ष, परिकल्पन तथा निर्माण अवधि = 1·5 वर्ष। वर्तमान व्यावसायिक ट्रैफिक निम्न प्रकार है: बस (सकल भार 15T, 200 वाहन प्रतिदिन, अग्र धुरी – एकल, पश्च धुरी – दोहरी, वृद्धि दर 4%), ट्रक (सकल भार 20T, 1512 वाहन प्रतिदिन, अग्र धुरी – एकल, पश्च धुरी – अग्रपश्च (टैन्डम), वृद्धि दर 8%)। IRC 37, 2018 के अनुसार, सबग्रेड 8% के लिए विभिन्न अभिकल्पित ट्रैफिक के अनुसार निम्नलिखित कुंडिम संयोजन अपेक्षित है: [सारणी दिखाते हुए अभिकल्पित ट्रैफिक (एम.एस.ए.) बनाम परतें]। (15 अंक)
एक शहर की सड़क पर किए गए स्थानिक गति अध्ययन से निम्नलिखित आँकड़े प्राप्त किए गए। सुझाइए (i) नियमन के लिए गति सीमा, (ii) ज्यामितीय अभिकल्प घटकों की जाँच के लिए गति, (iii) संकुलन करने वाले निम्न गति समूह। [सारणी दिखाते हुए गति परास (km/hr) बनाम वाहनों की संख्या]। (15 अंक)
The figure this question refers to, in words
The question paper is a scan and the diagram did not survive as text. This is the figure as read from the original page — every component, value and label — so the question can be worked from the text below.
(a) Table with two columns: 'Time (h)' and 'Ordinate of 4 hr UH (m3/s)'. Rows: 0, 0; 4, 30; 8, 120; 12, 200; 16, 250; 20, 210; 24, 130; 28, 75; 32, 50; 36, 20; 40, 10; 44, 0.
(b) Table: Pavement composition for CBR of 8% subgrade corresponding to different Design traffic. Columns: Design Traffic (msa), BC Wearing Course (mm), DBM Binder Course (mm), WMM Base Course (mm), GSB Sub-base Course (mm). Rows: 5, 30, 50, 250, 150; 10, 30, 60, 250, 200; 20, 30, 90, 250, 200; 30, 40, 95, 250, 200; 40, 40, 105, 250, 200; 50, 40, 115, 250, 200.
(c) Table with 3 columns and 5 rows (including header). Column 1 header: 'Activity' (Hindi: क्रिया). Column 2 header: 'Normal Time (Weeks)' (Hindi: सामान्य समय (सप्ताह)). Column 3 header: 'Normal Cost (₹ in lakh)' (Hindi: सामान्य लागत (₹ लाख में)). Row 1: '1 - 3', '9', '90'. Row 2: '1 - 2', '12', '180'. Row 3: '2 - 3', '18', '210'. Row 4: '3 - 4', '20', '360'.
What "Solve" is asking you to do
Choose the method, then carry it through to a final answer. Identifying what kind of problem this is and why that method applies is the first thing marked; a correct figure arrived at invisibly earns almost nothing.
Structure that answers it
Given data and what is required → method chosen, with the reason it applies → set-up (equation, circuit, free body, trial balance) → working, step by step → answer with units and any condition of validity
Where marks are lost
Doing the middle steps mentally and writing only the result. In mathematics papers, a further loss comes from giving a decimal where the exact value in surds or fractions was wanted, or from skipping the justification a part explicitly asks for.
How this answer will be evaluated
Approach
Framework: UPSC Civil Engineering Paper 2. (a) calculate: given > formula > substitution > result with units > interpretation | (b) calculate: given > formula > substitution > result with units > interpretation | (c) calculate: given > formula > substitution > result with units > interpretation Full marks: Complete method with correct calculations, units, and code references; clear justification for all decisions.
Key points expected
- Calculate PW of Equipment A (Cost 1.32L, 5 yrs, 0 salvage)
- Calculate PW of 2x Equipment B (Cost 0.42L, 3-yr life, 0.05L salvage)
- Account for B's replacement cycle and operating cost differential (0.18L/yr)
- Compare final PW values to justify selection
- Calculate Design Traffic (MSA) using growth rates (4%, 8%)
- Apply Lane Distribution Factor (0.5) to total traffic
- Determine Equivalent Axle Loads (EAL) for Bus and Truck
- Select pavement layers (BC, DBM, WMM, GSB) from IRC table
Evaluation rubric
Each sub-part is marked on its own, against the marks and word limit printed on the paper.
- (a) Determine preferred equipment (A or 2x B) using Present Worth analysis at 15% interest. 15 marks
calculate— given → formula → substitution → result with units → interpretation
Must cover
- Calculate PW of Equipment A (Cost 1.32L, 5 yrs, 0 salvage)
- Calculate PW of 2x Equipment B (Cost 0.42L, 3-yr life, 0.05L salvage)
- Account for B's replacement cycle and operating cost differential (0.18L/yr)
- Compare final PW values to justify selection
Loses marks
- Ignoring the 0.18L/yr operating cost difference
- Treating B's life as 5 years without replacement
- Omitting the 0.05L salvage value for B
Earns more
- Correct application of Present Worth factor (P/A, 15%, 5 yrs)
- Explicit handling of B's 2-year-old salvage value at year 3
- Clear tabulation of cash flows for both options
Extra mark
- Sensitivity analysis on interest rate
- (b) Design flexible pavement thickness for 2-lane road using IRC 37, 2018 data. 15 marks
calculate— given → formula → substitution → result with units → interpretation
Must cover
- Calculate Design Traffic (MSA) using growth rates (4%, 8%)
- Apply Lane Distribution Factor (0.5) to total traffic
- Determine Equivalent Axle Loads (EAL) for Bus and Truck
- Select pavement layers (BC, DBM, WMM, GSB) from IRC table
Loses marks
- Using 15 years instead of 13.5 years for growth
- Ignoring the 0.5 lane distribution factor
- Incorrect EAL calculation for tandem axles
Earns more
- Correct calculation of cumulative standard axle loads
- Explicit statement of Design Life (15 yrs) and Construction Period (1.5 yrs)
- Correct identification of wheel configuration (Single/Dual/Tandem)
Extra mark
- Reference to specific IRC 37, 2018 clause numbers
- (c) Determine speed limit, design speed, and congestion group from spot speed data. 15 marks
calculate— given → formula → substitution → result with units → interpretation
Must cover
- Calculate 15th percentile speed for speed limit regulation
- Calculate 85th percentile speed for geometric design check
- Identify lower speed group causing congestion (typically 15th percentile)
- Show cumulative frequency calculation for percentiles
Loses marks
- Using 50th percentile for speed limit
- Incorrect cumulative frequency calculation
- Failing to distinguish between regulation and design speeds
Earns more
- Correct interpolation for percentile speeds
- Clear tabulation of cumulative vehicle counts
- Logical justification for chosen speed limits
Extra mark
- Graphical representation of speed distribution
Model answer coming soon
Every evaluation on this site is marked against a verified model answer. This question's answer is still being written; evaluation opens the moment it lands.
More from Civil Engineering 2022 Paper II
- Q1 (a) (i) Briefly explain the deterioration of concrete caused by leaching action, and (ii)…
- Q2 (a) A construction company is planning to purchase an excavation equipment for operating…
- Q3 (a) A two-lane State Highway in plain terrain, with cutting section having camber of 2·0%…
- Q4 (a) In a layout of B.G. Yard, an 8° curve branches off from a 4° main curve in an opposit…
- Q5 (a) A catchment has six rain gauge stations. In a year, the annual rainfall recorded by t…