Paper II — Q2
(a) The network for a construction project is shown in the figure given below. The three time estimates for each activity are…
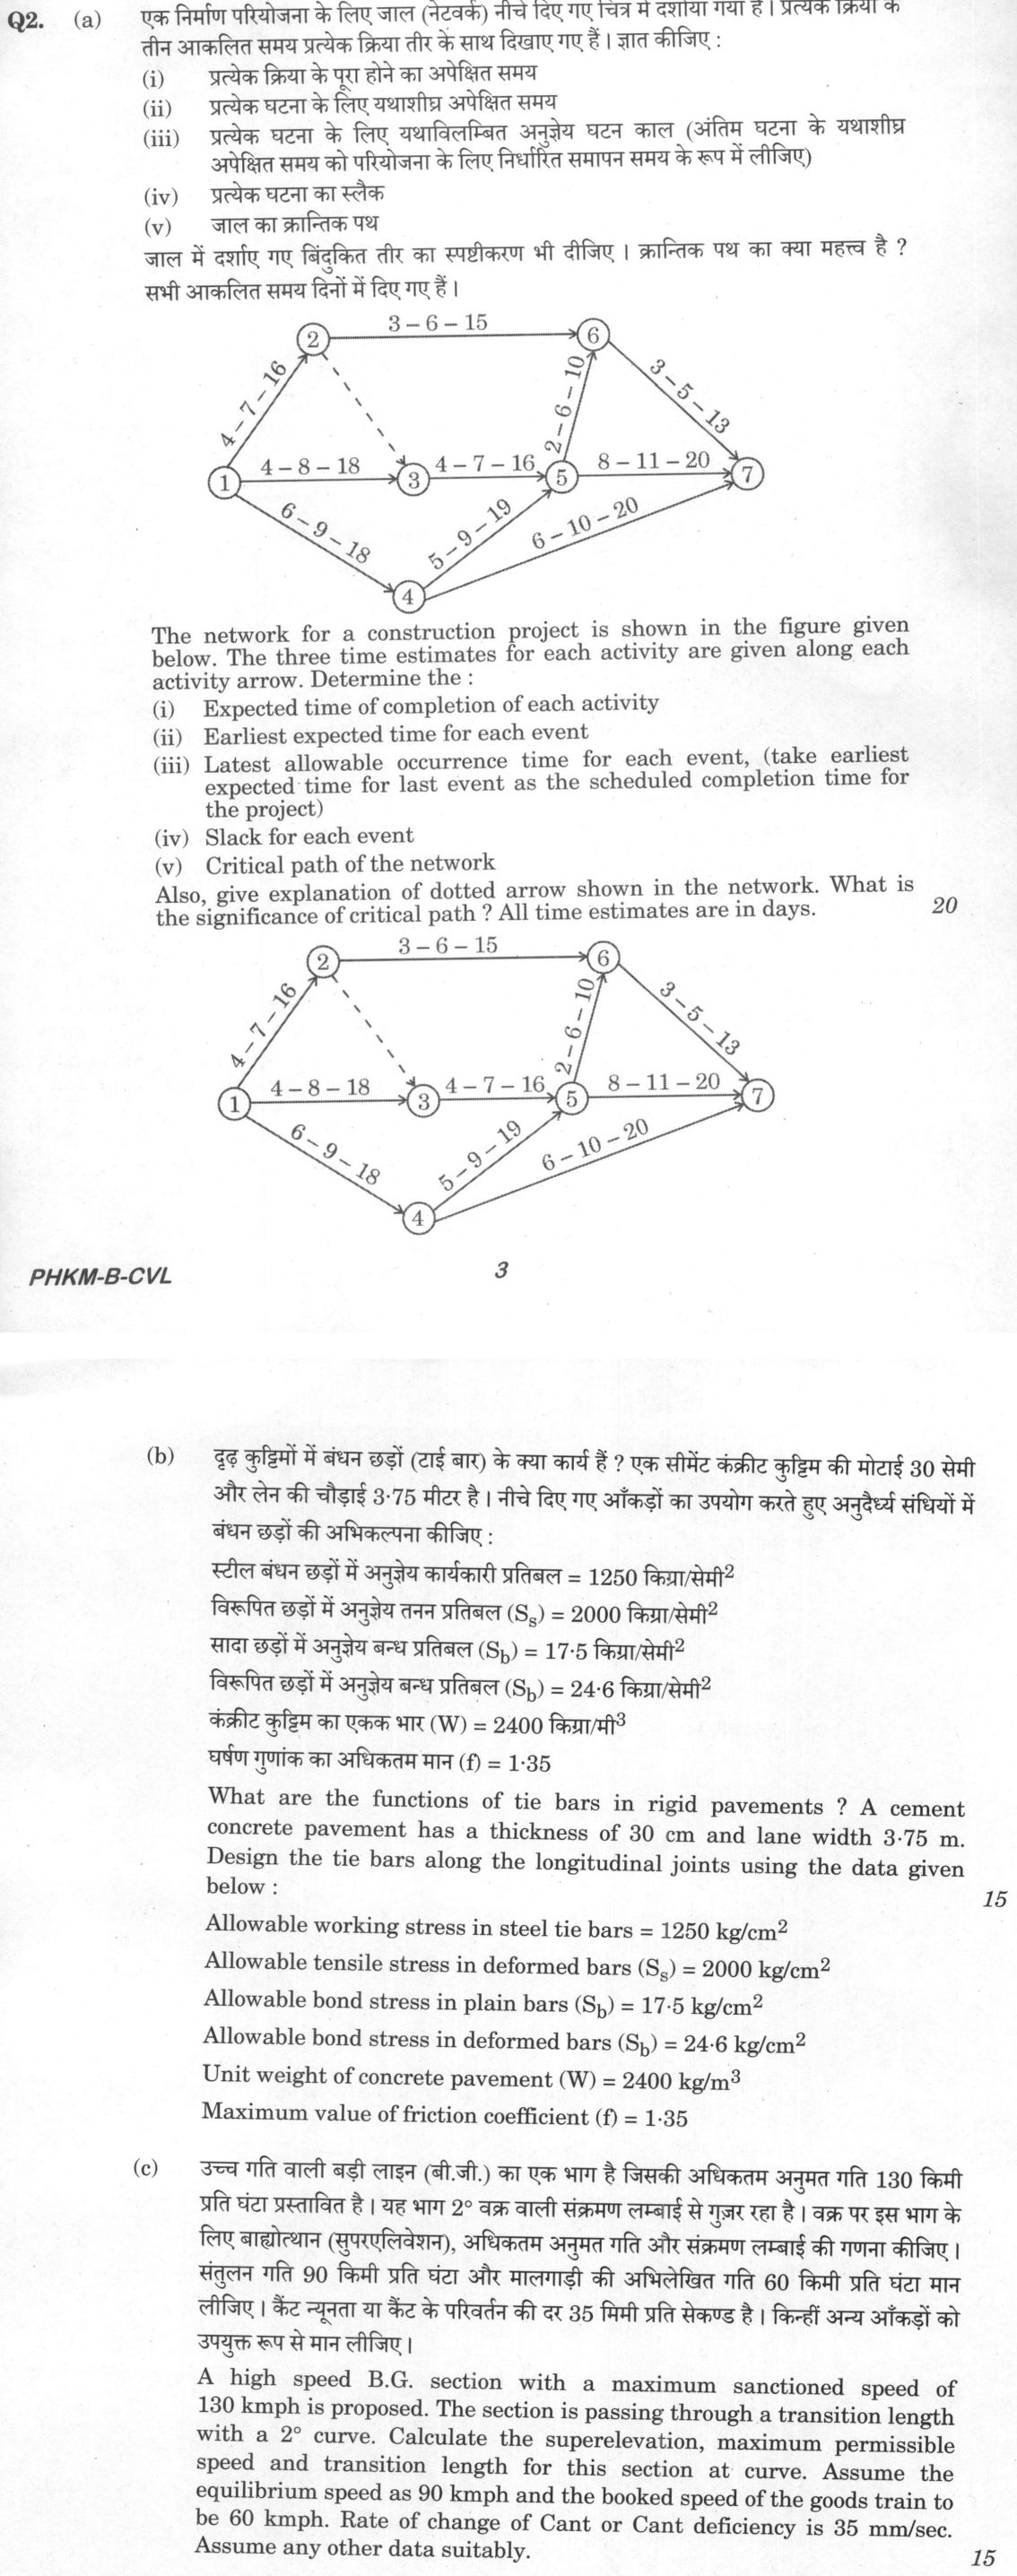
The network for a construction project is shown in the figure given below. The three time estimates for each activity are given along each activity arrow. Determine the: (i) Expected time of completion of each activity, (ii) Earliest expected time for each event, (iii) Latest allowable occurrence time for each event, (take earliest expected time for last event as the scheduled completion time for the project), (iv) Slack for each event, (v) Critical path of the network. Also, give explanation of dotted arrow shown in the network. What is the significance of critical path? All time estimates are in days. 20 marks
What are the functions of tie bars in rigid pavements? A cement concrete pavement has a thickness of 30 cm and lane width 3·75 m. Design the tie bars along the longitudinal joints using the data given below: Allowable working stress in steel tie bars = 1250 kg/cm², Allowable tensile stress in deformed bars (Sₛ) = 2000 kg/cm², Allowable bond stress in plain bars (Sᵦ) = 17·5 kg/cm², Allowable bond stress in deformed bars (Sᵦ) = 24·6 kg/cm², Unit weight of concrete pavement (W) = 2400 kg/m³, Maximum value of friction coefficient (f) = 1·35. 15 marks
A high speed B.G. section with a maximum sanctioned speed of 130 kmph is proposed. The section is passing through a transition length with a 2° curve. Calculate the superelevation, maximum permissible speed and transition length for this section at curve. Assume the equilibrium speed as 90 kmph and the booked speed of the goods train to be 60 kmph. Rate of change of Cant or Cant deficiency is 35 mm/sec. Assume any other data suitably. 15 marks
हिंदी में प्रश्न पढ़ें
एक निर्माण परियोजना के लिए जाल (नेटवर्क) नीचे दिए गए चित्र में दर्शाया गया है। प्रत्येक क्रिया के तीन आकलित समय प्रत्येक क्रिया तीर के साथ दिखाए गए हैं। ज्ञात कीजिए: (i) प्रत्येक क्रिया के पूरा होने का अपेक्षित समय, (ii) प्रत्येक घटना के लिए यथाशीघ्र अपेक्षित समय, (iii) प्रत्येक घटना के लिए यथाविलम्बित अनुज्ञेय घटन काल (अंतिम घटना के यथाशीघ्र अपेक्षित समय को परियोजना के लिए निर्धारित समापन समय के रूप में लीजिए), (iv) प्रत्येक घटना का स्लैक, (v) जाल का क्रांतिक पथ। जाल में दर्शाए गए बिंदुकित तीर का स्पष्टीकरण भी दीजिए। क्रांतिक पथ का क्या महत्व है? सभी आकलित समय दिनों में दिए गए हैं। 20
दृढ़ कुंडियों में बंधन छड़ों (टाई बार) के क्या कार्य हैं? एक सीमेंट कंक्रीट कुंडिम की मोटाई 30 सेमी और लेन की चौड़ाई 3·75 मीटर है। नीचे दिए गए आंकड़ों का उपयोग करते हुए अनुदैर्ध्य संधियों में बंधन छड़ों की अभिकल्पना कीजिए: स्टील बंधन छड़ों में अनुज्ञेय कार्यकारी प्रतिबल = 1250 किग्रा/सेमी², विकृत छड़ों में अनुज्ञेय तनन प्रतिबल (Sₛ) = 2000 किग्रा/सेमी², सादा छड़ों में अनुज्ञेय बंध प्रतिबल (Sᵦ) = 17·5 किग्रा/सेमी², विकृत छड़ों में अनुज्ञेय बंध प्रतिबल (Sᵦ) = 24·6 किग्रा/सेमी², कंक्रीट कुंडिम का एकक भार (W) = 2400 किग्रा/मी³, घर्षण गुणांक का अधिकतम मान (f) = 1·35। 15
उच्च गति वाली बड़ी लाइन (बी.जी.) का एक भाग है जिसकी अधिकतम अनुमत गति 130 किमी प्रति घंटा प्रस्तावित है। यह भाग 2° वक्र वाली संक्रमण लंबाई से गुजर रहा है। वक्र पर इस भाग के लिए बाहोत्थान (सुपरएलिवेशन), अधिकतम अनुमत गति और संक्रमण लंबाई की गणना कीजिए। संतुलन गति 90 किमी प्रति घंटा और मालगाड़ी की अभिलेखित गति 60 किमी प्रति घंटा मान लीजिए। कैंट न्यूनता या कैंट के परिवर्तन की दर 35 मिमी प्रति सेकंड है। किन्हीं अन्य आंकड़ों को उपयुक्त रूप से मान लीजिए। 15
The figure this question refers to, in words
The question paper is a scan and the diagram did not survive as text. This is the figure as read from the original page — every component, value and label — so the question can be worked from the text below.
(a) An activity-on-arrow (AOA) project network diagram with 7 numbered circular event nodes (1 through 7). Node 1 is the start event on the left, node 7 is the end event on the right. Solid arrows represent activities, each labelled with three time estimates in days in the format optimistic-most likely-pessimistic. The activities are: 1-2 labelled 4-7-16; 1-3 labelled 4-8-18; 1-4 labelled 6-9-18; 2-6 labelled 3-6-15; 3-5 labelled 4-7-16; 4-5 labelled 5-9-19; 4-7 labelled 6-10-20; 5-6 labelled 2-6-10; 5-7 labelled 8-11-20; 6-7 labelled 3-5-13. A dashed (dummy) arrow runs from node 2 to node 3. The question asks for expected activity times, earliest and latest event times, event slacks, the critical path, and the meaning of the dashed arrow.
(b) Table 1 (Photographic Coordinates): Point | Photographic Coordinates x (cm) | y (cm) A | + 5.65 | + 3.75 B | - 3.45 | + 8.55
Table 2 (Closed Traverse ABCD): Line | Length (m) | Latitude | Departure AB | 350.8 | + 303.03 | + 176.6 BC | 408.5 | - 336.7 | + 231.4 CD | 285.4 | - 211.3 | - 191.9
Model answer
Written by UPSC Answer Check against this question's marking rubric, to the expected length. UPSC does not publish answers for Mains — this is one way to score well, not an official key.
(a) Using PERT, expected activity time tₑ = (o + 4m + p)/6.
(i) Expected time of each activity:
- 1–2: tₑ = (4 + 4×7 + 16)/6 = 8 days
- 1–3: tₑ = (4 + 4×8 + 18)/6 = 9 days
- 1–4: tₑ = (6 + 4×9 + 18)/6 = 10 days
- 2–6: tₑ = (3 + 4×6 + 15)/6 = 7 days
- 3–5: tₑ = (4 + 4×7 + 16)/6 = 8 days
- 4–5: tₑ = (5 + 4×9 + 19)/6 = 10 days
- 4–7: tₑ = (6 + 4×10 + 20)/6 = 11 days
- 5–6: tₑ = (2 + 4×6 + 10)/6 = 6 days
- 5–7: tₑ = (8 + 4×11 + 20)/6 = 12 days
- 6–7: tₑ = (3 + 4×5 + 13)/6 = 6 days
- Dummy 2–3: tₑ = 0 days
(ii) Earliest expected event times (forward pass): E₁ = 0; E₂ = 8; E₃ = max(9, 8 + 0) = 9; E₄ = 10; E₅ = max(9 + 8, 10 + 10) = 20; E₆ = max(8 + 7, 20 + 6) = 26; E₇ = max(10 + 11, 20 + 12, 26 + 6) = 32 days.
(iii) Latest allowable event times (backward pass): L₇ = 32; L₆ = 26; L₅ = min(32 − 12, 26 − 6) = 20; L₄ = min(20 − 10, 32 − 11) = 10; L₃ = 20 − 8 = 12; L₂ = min(26 − 7, 12 − 0) = 12; L₁ = min(12 − 8, 12 − 9, 10 − 10) = 0.
(iv) Event slacks Sᵢ = Lᵢ − Eᵢ: S₁ = 0; S₂ = 4; S₃ = 3; S₄ = 0; S₅ = 0; S₆ = 0; S₇ = 0.
(v) Critical path: The zero-slack events and activities give two critical paths of equal length 32 days:
- 1–4–5–6–7, length = 10 + 10 + 6 + 6 = 32 days
- 1–4–5–7, length = 10 + 10 + 12 = 32 days
Dummy arrow: It is a zero-duration, zero-resource logical link. Here 2→3 means activity 3–5 cannot start until event 2 is reached; it transfers the dependency of activity 1–2 onto event 3.
Significance of critical path: It is the longest path through the network and fixes project completion time. Activities on it have zero float, so any delay delays the project; they need closest monitoring and resource control.
(b) Functions of tie bars in rigid pavements:
- Hold adjacent slabs together along longitudinal joints.
- Prevent lateral separation/opening of the joint.
- Maintain aggregate interlock and load transfer across the joint.
- Keep slabs in the same plane and reduce differential deflection.
- Resist effects of contraction/expansion and moisture-temperature changes.
- Prevent infiltration of water and incompressibles through the joint.
Design of tie bars: Assume 12 mm diameter deformed bars. Area A = π(1.2)²/4 = 1.131 cm². Force per unit length of longitudinal joint: q = f W h B = 1.35 × 2400 × 0.30 × 3.75 = 3645 kg/m. Allowable force per bar = A × 1250 = 1.131 × 1250 = 1413.7 kg. Spacing s = 1413.7/3645 = 0.388 m, say 0.38 m c/c. Required area per metre = 3645/1250 = 2.916 cm²/m. Provided area = 1.131/0.38 = 2.98 cm²/m > 2.916 cm²/m, hence safe. Length of deformed tie bar: L = d Sₛ/(2 Sᵦ) = 1.2 × 2000/(2 × 24.6) = 48.8 cm. Provide 12 mm diameter deformed tie bars, 50 cm long, spaced at 380 mm c/c along the longitudinal joint. Embedded length each side = 25 cm > required development length 24.4 cm, hence bond is safe.
(c) For B.G., R = 1750/D = 1750/2 = 875 m.
Superelevation for equilibrium speed Vₑ = 90 kmph: e = G Vₑ²/(127 R) = 1750 × 90²/(127 × 875) = 127.56 mm, say 127.5 mm.
Goods train check: equilibrium cant at 60 kmph = 1750 × 60²/(127 × 875) = 56.69 mm. Cant excess = 127.56 − 56.69 = 70.87 mm < 75 mm, acceptable.
Maximum permissible speed: assume maximum cant deficiency = 100 mm for high-speed B.G. V_max = √[(e + Cd) × 127R/G] = √[(127.56 + 100) × 127 × 875/1750] = √(227.56 × 63.5) = 120.2 kmph, say 120 kmph. At 130 kmph, cant deficiency would be 266.1 − 127.56 = 138.5 mm > 100 mm, so 130 kmph is not permissible.
Transition length: L = e V/(3.6 × rate) = 127.56 × 120.2/(3.6 × 35) = 121.7 m, say 122 m. Check for cant deficiency: L_cd = 100 × 120.2/(3.6 × 35) = 95.4 m < 122 m. Hence cant governs.
Final answers: (a) Project completion = 32 days; critical paths 1–4–5–6–7 and 1–4–5–7. (b) 12 mm deformed tie bars @ 380 mm c/c, 50 cm long. (c) Superelevation = 127.5 mm, maximum permissible speed = 120 kmph, transition length = 122 m.
What "Solve" is asking you to do
Choose the method, then carry it through to a final answer. Identifying what kind of problem this is and why that method applies is the first thing marked; a correct figure arrived at invisibly earns almost nothing.
Structure that answers it
Given data and what is required → method chosen, with the reason it applies → set-up (equation, circuit, free body, trial balance) → working, step by step → answer with units and any condition of validity
Where marks are lost
Doing the middle steps mentally and writing only the result. In mathematics papers, a further loss comes from giving a decimal where the exact value in surds or fractions was wanted, or from skipping the justification a part explicitly asks for.
How this answer will be evaluated
Approach
(a) calculate: given > formula > substitution > result with units > interpretation | (b) describe: define > structure or process in order > labelled diagram > significance | (c) calculate: given > formula > substitution > result with units > interpretation Full marks: All calculations are correct, steps are clearly shown, and all parts of the question are addressed.
Key points expected
- Calculate expected time (te) for each activity
- Determine earliest (ET) and latest (LT) event times
- Identify critical path and calculate slack
- Explain the significance of the dotted arrow
- List functions of tie bars in rigid pavements
- Calculate the required area of steel (As)
- Determine the spacing of tie bars
- Calculate the required length of tie bars
Evaluation rubric
Each sub-part is marked on its own, against the marks and word limit printed on the paper.
- (a) Compute PERT parameters, event times, slack, and identify the critical path. 20 marks
calculate— given → formula → substitution → result with units → interpretation
Must cover
- Calculate expected time (te) for each activity
- Determine earliest (ET) and latest (LT) event times
- Identify critical path and calculate slack
- Explain the significance of the dotted arrow
Loses marks
- Fails to calculate slack for non-critical activities
- Confuses activity time with event time
- Does not explain the significance of the critical path
Earns more
- Correctly identifies the critical path as 1-2-6-7
- Calculates project duration as 38 days
- Explains dotted arrow as a dummy activity
- Provides a clear table of event times
Extra mark
- Draws a neat, labelled network diagram
- Explicitly states the formula for standard deviation
- (b) State functions of tie bars and design them for longitudinal joints. 15 marks
describe— define → structure or process in order → labelled diagram → significance
Must cover
- List functions of tie bars in rigid pavements
- Calculate the required area of steel (As)
- Determine the spacing of tie bars
- Calculate the required length of tie bars
Loses marks
- Omits the calculation of bond length
- Uses incorrect units in the design calculation
- Fails to state the functions of tie bars
Earns more
- Uses the correct formula for frictional force
- Selects a standard bar diameter (e.g., 12mm)
- Calculates bond length correctly
- States assumptions clearly
Extra mark
- Provides a neat sketch of tie bar placement
- Mentions IS code for pavement design
- (c) Calculate superelevation, maximum permissible speed, and transition length. 15 marks
calculate— given → formula → substitution → result with units → interpretation
Must cover
- Calculate the required superelevation (Cant)
- Determine the maximum permissible speed
- Calculate the transition length
- State all assumptions and given data
Loses marks
- Fails to calculate the transition length
- Uses incorrect units for speed or length
- Does not state the assumptions made
Earns more
- Uses the correct formula for equilibrium speed
- Calculates cant deficiency correctly
- Considers the rate of change of cant
- Provides a clear step-by-step calculation
Extra mark
- Draws a diagram of the transition curve
- Mentions IS code for railway design
Practice this exact question
Write your answer and it is marked point by point against the model answer above — what you covered, what you missed, what you got wrong.
Evaluate my answer →More from Civil Engineering 2024 Paper II
- Q1 (a) Describe various defects in clay bricks giving sources/causes of defects. 10 marks (b…
- Q2 (a) The network for a construction project is shown in the figure given below. The three…
- Q3 (a) (i) Explain spot speed, running speed, space-mean speed, time-mean speed and average…
- Q4 (a) The network of a certain project is shown in the figure given below with the estimate…
- Q5 (a) What is a flood hydrograph ? The monthly discharge (Q) data of a river at a gauging s…