Paper I — Q6
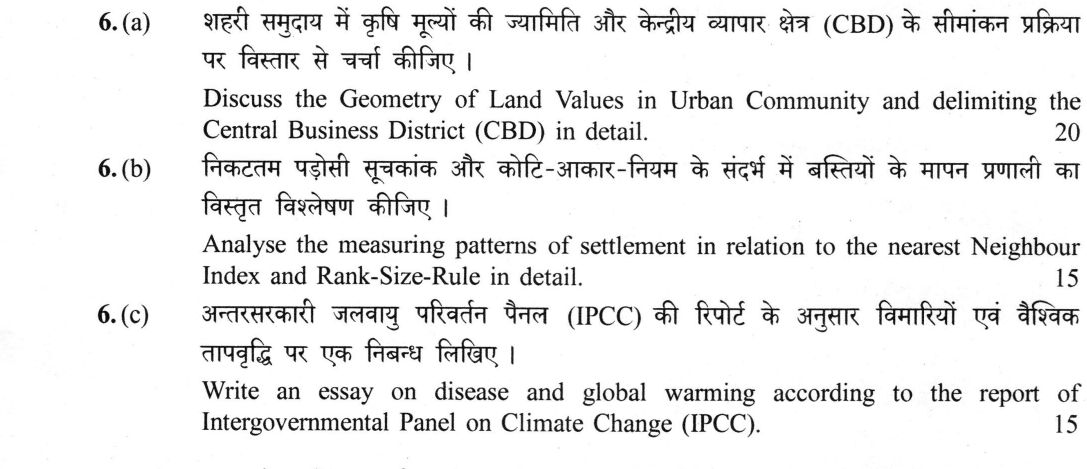
(a) Discuss the Geometry of Land Values in Urban Community and delimiting the Central Business District (CBD) in detail. (20…
Discuss the Geometry of Land Values in Urban Community and delimiting the Central Business District (CBD) in detail. 20 marks
Analyse the measuring patterns of settlement in relation to the nearest Neighbour Index and Rank-Size-Rule in detail. 15 marks
Write an essay on disease and global warming according to the report of Intergovernmental Panel on Climate Change (IPCC). 15 marks
हिंदी में प्रश्न पढ़ें
शहरी समुदाय में भूमि मूल्यों की ज्यामिति और केन्द्रीय व्यापार क्षेत्र (CBD) के सीमांकन प्रक्रिया पर विस्तार से चर्चा कीजिए । (20 अंक)
निकटतम पड़ोसी सूचकांक और कोटि-आकार-नियम के संदर्भ में बस्तियों के मापन प्रणाली का विस्तृत विश्लेषण कीजिए । (15 अंक)
अन्तरसरकारी जलवायु परिवर्तन पैनल (IPCC) की रिपोर्ट के अनुसार बीमारियों एवं वैश्विक तापवृद्धि पर एक निबन्ध लिखिए । (15 अंक)
Model answer
Drafted with AI by UPSC Answer Check against this question's marking rubric, to the expected length. UPSC does not publish answers for Mains — this is one way to score well, not an official key. How we build rubrics and answers.
(a) Geometry of urban land values and delimitation of the CBD
The geometry of urban land values is a three-dimensional surface defined by the Peak Land Value Intersection (PLVI) and the land-value gradient. The PLVI is the apex of this surface, representing the highest bid for land, typically found at the intersection of major radial arterials. From this peak, values decline in an approximately exponential gradient with distance. This surface is not a smooth cone; it features ridges along arterial roads, secondary peaks at suburban intersections, and a trough in the zone of transition. The theoretical basis for this geometry is the bid-rent theory, which was developed by William Alonso (1964) and Lowdon Wingo (1961), building on the foundational work of Richard M. Hurd (1903) and Robert M. Haig (1926). Empirical studies, such as Duane Knos’s Topeka study (1962) and Maurice Yeates’s Chicago study (1965), have confirmed these patterns. Furthermore, Neil Smith’s rent gap theory (1979) explains how the geometry shifts as older areas are redeveloped.
Delimiting the CBD requires specific indices rather than visual description. The standard technique is the Murphy-Vance method (1954), which uses two indices: the Central Business Height Index (CBHI) and the Central Business Intensity Index (CBII). A location is considered part of the CBD if the CBHI is at least 1.0 (indicating high-rise structures) and the CBII is at least 50 per cent (indicating the proportion of commercial floor space). Alternative approaches include the core-frame concept by Horwood and Boyce (1959) and the hard core and fringe model by D. H. Davies (1960). In the Indian context, these indices face challenges due to mixed land use, informal street retail, and the absence of floor-space data. Many Indian cities, such as Delhi (walled city and Connaught Place) or Mumbai (Fort and Bandra-Kurla), exhibit dual or multi-nodal cores that resist simple single-CBD delimitation.
(b) Nearest Neighbour Index and the rank-size rule
The spatial patterns of settlements are measured using two distinct statistical devices: the Nearest Neighbour Index (NNI) and the Rank-Size Rule. The NNI, attributed to Clark and Evans (1954), measures the spatial distribution of settlements as points. The formula is Rₙ = 2 × d̄ × √(N/A), where d̄ is the mean nearest-neighbour distance, N is the number of settlements, and A is the area. The interpretation scale is: Rₙ = 0 for a clustered pattern, Rₙ = 1.0 for a random pattern, and Rₙ = 2.15 for a perfectly uniform (hexagonal) pattern. For example, if a study of 100 villages in a 100 sq km area yields a mean distance of 0.1 km, the NNI would be 2 × 0.1 × √(100/100) = 0.2, indicating a highly clustered pattern.
The Rank-Size Rule, associated with G. K. Zipf (1949) and precursors like Auerbach (1913), measures the size hierarchy of settlements. The formula is Pᵣ = P₁/r, where Pᵣ is the population of the r-th ranked city and P₁ is the population of the largest city. The general form is Pᵣ = P₁ r⁻q. If q=1, the system follows the strict Zipfian law. In India (Census 2011), the upper hierarchy is flatter than q=1, meaning ranks two to four are larger than the strict rule predicts, making it a non-primate system. This contrasts with primate systems such as Bangkok or Lima, described by Mark Jefferson's law of the primate city (1939). Plotted on log-log paper, a rank-size distribution is a straight line of slope −q; Lotka (1925) and Singer (1936) anticipated the regularity, and Brian Berry (1961) linked near-lognormal city-size distributions to large, complex and long-urbanised systems.
The limitations of these measures are significant. For the NNI, the modifiable areal unit problem and edge effects can distort results, and it treats settlements as dimensionless points. For the Rank-Size Rule, it is descriptive rather than explanatory (Simon, 1955) and is highly sensitive to how a "city" is defined and where the hierarchy is truncated.
(c) Disease and global warming: the IPCC assessment
The Intergovernmental Panel on Climate Change (IPCC), particularly in its Sixth Assessment Report (AR6) Working Group II (2022), identifies a profound link between global warming and human health. The report details several pathways through which climate change exacerbates disease. First, vector-borne diseases are expanding their ranges. Warming temperatures allow vectors like Aedes aegypti and Aedes albopictus to thrive in new areas, increasing the risk of dengue and chikungunya. Furthermore, the shortening of the extrinsic incubation period in mosquitoes leads to a lengthening of the transmission season, including in highland malaria regions.
Second, water- and food-borne diseases are becoming more prevalent. Warming waters facilitate the growth of pathogens like Vibrio cholerae. Additionally, climate change threatens food security, leading to undernutrition, which weakens immune systems and increases susceptibility to various illnesses. Third, heat-related mortality and morbidity are rising, with a significant loss of safe outdoor working hours for vulnerable populations. AR6 assesses with very high confidence that extreme heat has increased mortality and morbidity, and also notes worsening air quality (ozone, wildfire smoke) and mental-health impacts. The IPCC also highlights the emergence of zoonoses in new areas, necessitating a "One Health" approach that integrates human, animal, and environmental health.
The burden of these health impacts is unequally distributed, falling most heavily on low-income tropical populations, children, the elderly, and the urban poor. While the WHO (2014) estimates about 250,000 additional deaths a year between 2030 and 2050 due to climate change, the IPCC emphasizes that these figures are scenario-dependent. Adaptation is critical; examples include the Ahmedabad Heat Action Plan (2013) and India’s National Programme on Climate Change and Human Health (2019). These measures, combined with disease surveillance and resilient health systems, are essential to mitigate the health risks of a warming world.
How this answer will be evaluated
Evaluation rubric
Each sub-part is marked on its own, against the marks and word limit printed on the paper.
- (a) Two linked tasks, both to be discussed 'in detail': first the geometry of urban land values -- the form of the land-value surface, its peak, gradients, ridges and secondary peaks, and the theory that explains them; second the delimitation of the Central Business District, which requires a named technique with its indices and thresholds, not a description of what a CBD looks like. 20 marks
Must cover
- Peak Land Value Intersection (PLVI) and the land-value gradient
- Richard M. Hurd, 'Principles of City Land Values' (1903); Robert M. Haig (1926)
- William Alonso, bid-rent theory (1964); Lowdon Wingo (1961)
- Duane Knos, Topeka land-value study (1962); Maurice Yeates, Chicago (1965)
- Raymond Murphy and J. E. Vance (1954) -- Central Business Height Index (threshold 1.0) and Central Business Intensity Index (threshold 50 per cent)
- Horwood and Boyce core-frame concept (1959); D. H. Davies, Cape Town (1960)
- Zone of transition / twilight zone; Neil Smith's rent gap (1979)
Loses marks
- Describing what a CBD contains -- shops, offices, banks, high rise -- instead of giving a delimitation technique with indices and thresholds, which is what the question asks
- Getting the Murphy-Vance thresholds wrong: inverting the two indices, or giving the intensity threshold as 1.0 and the height threshold as 50 per cent
- Treating the land-value surface as a smooth cone and missing the ridges, secondary peaks and the transition-zone trough that make it a 'geometry'
- Reciting Burgess, Hoyt and Harris-Ullman urban models throughout, which describe social areas, not the land-value surface
- Ignoring the Indian context altogether, or asserting that Murphy-Vance can be applied unchanged to an Indian city where floor-space data do not exist
- Answering the mistranslated Hindi and writing about agricultural land values
Earns more
- Describes the geometry of the surface: the Peak Land Value Intersection as apex, an approximately exponential decline with distance (the land-value gradient), ridges along radial arterials, secondary peaks at intersections and suburban centres, the trough in the zone of transition, the vertical (floor-wise) dimension and the flattening of the gradient with suburbanisation -- ideally citing Knos's Topeka study (1962) or Yeates's Chicago study (1965), and Smith's rent gap (1979)
- Adds alternative approaches and the Indian application: Horwood and Boyce's core-frame concept (1959), Davies's Cape Town hard core and hard core fringe (1960); and the Indian difficulties of mixed land use, informal street retail, absent floor-space data and dual or multi-nodal cores (walled city and Connaught Place, Fort and Nariman Point and Bandra-Kurla)
- (b) 'Analyse in detail' two distinct measuring devices: the Nearest Neighbour Index, which measures the spatial pattern of settlements, and the Rank-Size Rule, which measures the size hierarchy of settlements. Both formulae must be stated correctly with their interpretation scales, both must be attributed, and the analysis must include their limitations. A worked illustration is expected of a well-prepared candidate. 15 marks
Must cover
- Clark and Evans (1954); Rn = 2 x mean nearest-neighbour distance x square root of (N/A)
- Rn = 0 clustered, 1.0 random, 2.15 perfectly uniform (hexagonal)
- G. K. Zipf (1949), 'Human Behavior and the Principle of Least Effort'; Pr = P1/r; general form Pr = P1 r to the power minus q
- Auerbach (1913), Lotka (1925), Singer (1936) as precursors
- Mark Jefferson, law of the primate city (1939); Brian Berry (1961) on city-size distributions
- Log-log plot with slope minus q; primacy index
- Modifiable areal unit problem and edge effects as NNI limitations
Loses marks
- Writing the NNI formula wrongly -- omitting the factor 2, inverting N and A inside the square root, or forgetting the square root altogether
- Getting the interpretation scale wrong: stating that 0 is uniform and 2.15 clustered, or giving the uniform limit as 2.0 or 1.0
- Describing the rank-size rule without any formula, or stating it as a law of city growth rather than as an empirical regularity of city-size distribution
- Confusing the rank-size distribution with primacy -- claiming India is a primate system when Mumbai, Delhi and Kolkata are of comparable size
- Analysing only one of the two measures, when the question explicitly names both
- Omitting limitations altogether although the directive is to 'analyse in detail'
Earns more
- Applies the rank-size rule empirically, for example to Census 2011 Indian urban agglomerations, showing that observed populations of ranks two to four exceed the strict Zipf prediction so that India's upper hierarchy is flatter than q = 1 and non-primate, and contrasting primate systems such as Bangkok, Seoul, Lima or Manila; or computes a primacy index
- Analyses the limitations of both: for NNI, boundary and edge effects, the modifiable areal unit problem, settlements treated as dimensionless points regardless of size, scale dependence; for the rank-size rule, descriptive rather than explanatory (Simon 1955, Gibrat's law), sensitive to the definition of a city and to the truncation rank
- (c) An essay on the link between disease and global warming, explicitly framed by the findings of the Intergovernmental Panel on Climate Change. The answer must therefore be anchored in IPCC assessments -- chiefly the Sixth Assessment Report of Working Group II (2022) -- and must cover vector-borne, water- and food-borne, heat-related and nutrition-related pathways, the unequal distribution of the burden, and adaptation. 15 marks
Must cover
- IPCC Sixth Assessment Report, Working Group II (2022), 'Climate Change 2022: Impacts, Adaptation and Vulnerability'; also SR1.5 (2018) and AR5 (2014)
- Vector-borne disease range expansion -- Aedes aegypti and Aedes albopictus, dengue, chikungunya; highland malaria
- Extrinsic incubation period; lengthening transmission season
- Water- and food-borne disease; Vibrio cholerae in warming waters; undernutrition
- Heat mortality and morbidity; loss of safe outdoor working hours
- Zoonoses emerging in new areas; One Health
- Ahmedabad Heat Action Plan (2013); National Programme on Climate Change and Human Health (India, 2019)
- WHO (2014) estimate of about 250,000 additional deaths a year, 2030-2050 (attributed to WHO, not to the IPCC)
Loses marks
- Writing a general global-warming essay with a paragraph on health tacked on, and never citing an IPCC report or its findings, although the question names the IPCC
- Attributing to the IPCC figures it did not produce -- most often the 250,000 additional deaths estimate, which is the WHO's
- Covering vector-borne disease only and ignoring heat, water- and food-borne disease, nutrition, air quality and mental health, all of which the IPCC treats
- Asserting confident quantitative projections of future disease burden without noting scenario dependence and uncertainty
- Ignoring adaptation, so the essay has no response section, and ignoring the unequal distribution of the burden
Earns more
- States the distribution of risk and the projections: burden concentrated on low-income tropical populations, children, the elderly, outdoor workers and the urban poor; scenario dependence; the WHO's (2014) estimate of about 250,000 additional deaths a year between 2030 and 2050, correctly attributed to the WHO rather than to the IPCC
- Sets out adaptation and response: heat-health early warning and Heat Action Plans (Ahmedabad, 2013), disease surveillance (IDSP; India's National Programme on Climate Change and Human Health, 2019), vector control and WASH, resilient health systems, One Health, urban cooling, and the health co-benefits of mitigation
What "Discuss" is asking you to do
Lay the issue out from more than one side — how it arose, what is claimed for it, what is held against it, and where it now stands. UPSC attaches discuss to broad topics with several live dimensions, so coverage of the dimensions earns more than the strength of your opinion.
Structure that answers it
Set the issue up → the case as it is made → the case against → the dimension both sides leave out → where the balance now lies
Where marks are lost
Listing facts with no thread between them, or arguing one side throughout and calling it a discussion.
Practice this exact question
Write your answer and it is marked point by point against the model answer above — what you covered, what you missed, what you got wrong.
Evaluate my answer →More from Geography 2026 Paper I
- Q3 (a) Describe the general characteristics and structure of a thunderstorm and suggest suit…
- Q4 (a) How does the annual variations in temperature and precipitation influence plants grow…
- Q5 Answer the following in about 150 words each : (a) “Systematic Geography is essentially a…
- Q6 (a) Discuss the Geometry of Land Values in Urban Community and delimiting the Central Bus…
- Q7 (a) What are the main concerns of radical geography ? Describe the salient features and o…
- Q8 (a) What are the principles of urban planning ? Critically analyse town planning in India…