Paper II — Q5
(a) What is the difference between a flood hydrograph and a mass curve ? Using the following data of a river at a dam site…
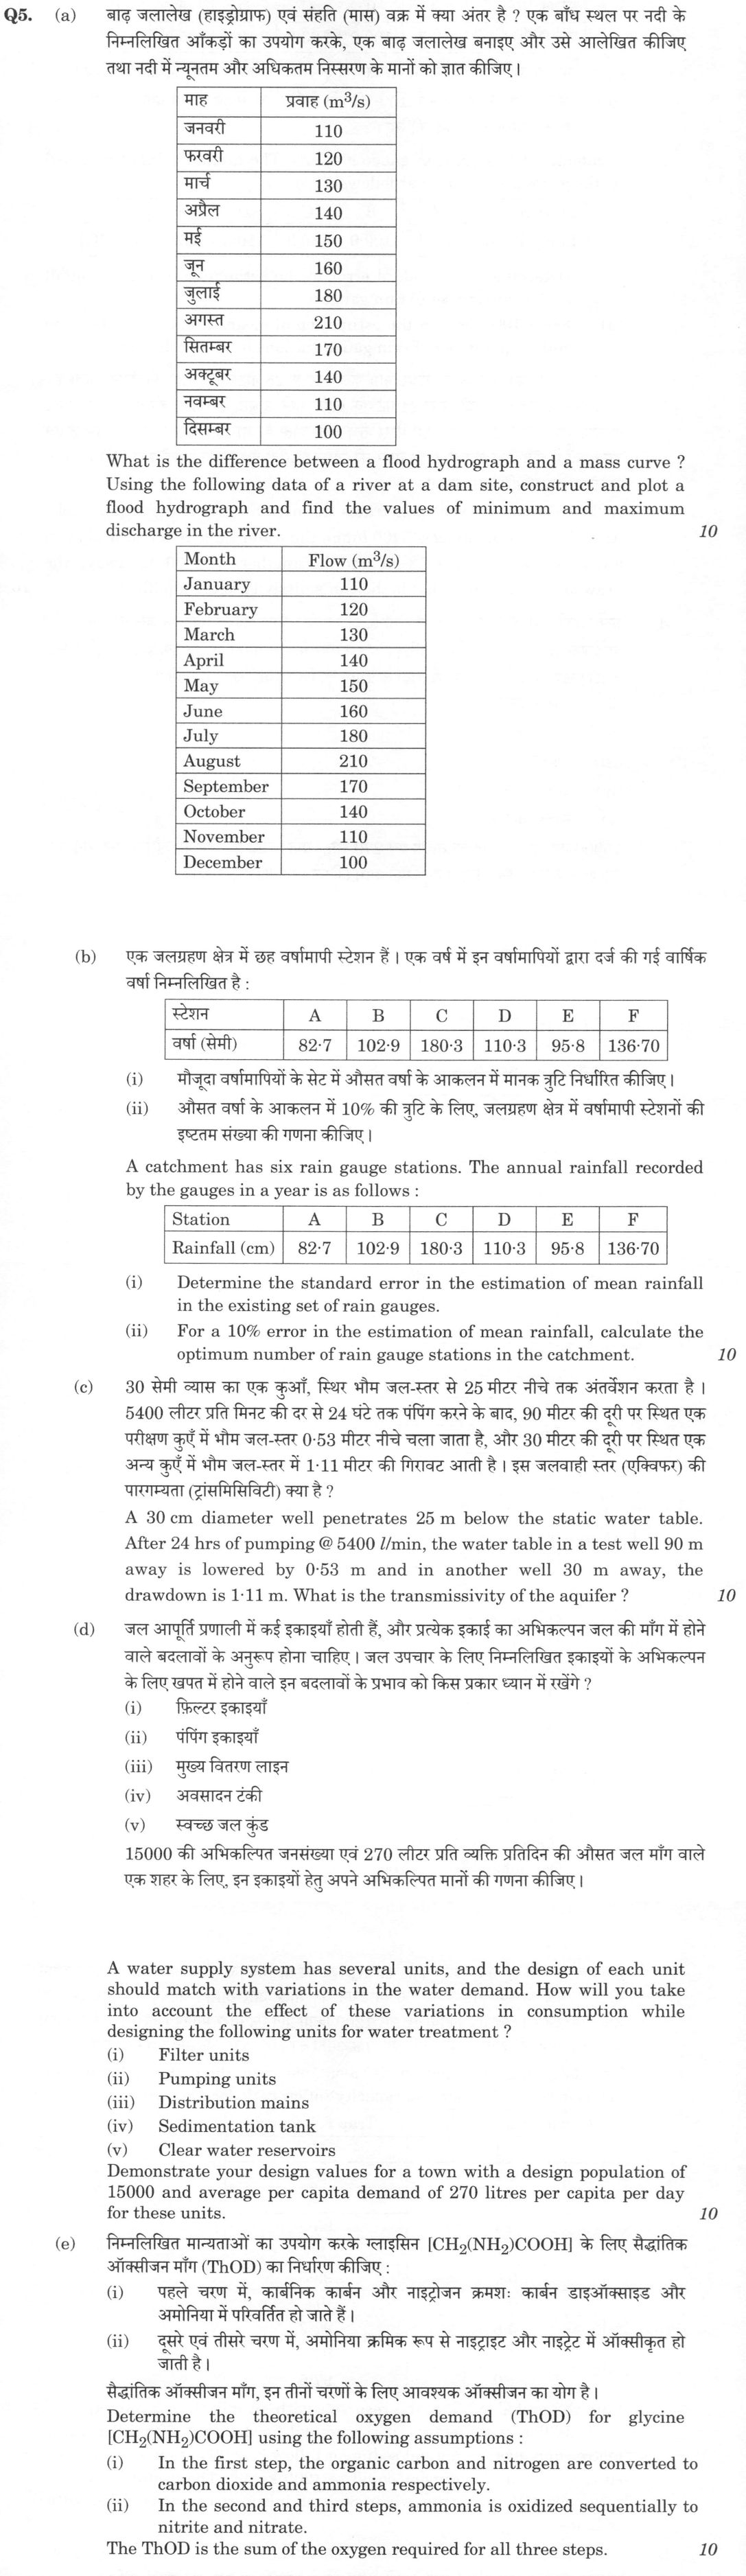
What is the difference between a flood hydrograph and a mass curve ? Using the following data of a river at a dam site, construct and plot a flood hydrograph and find the values of minimum and maximum discharge in the river.
Month | Flow (m³/s) January | 110 February | 120 March | 130 April | 140 May | 150 June | 160 July | 180 August | 210 September | 170 October | 140 November | 110 December | 100 10 marks
A catchment has six rain gauge stations. The annual rainfall recorded by the gauges in a year is as follows :
Station | A | B | C | D | E | F Rainfall (cm) | 82·7 | 102·9 | 180·3 | 110·3 | 95·8 | 136·70
Determine the standard error in the estimation of mean rainfall in the existing set of rain gauges.
For a 10% error in the estimation of mean rainfall, calculate the optimum number of rain gauge stations in the catchment. 10 marks
A 30 cm diameter well penetrates 25 m below the static water table. After 24 hrs of pumping @ 5400 l/min, the water table in a test well 90 m away is lowered by 0·53 m and in another well 30 m away, the drawdown is 1·11 m. What is the transmissivity of the aquifer ? 10 marks
A water supply system has several units, and the design of each unit should match with variations in the water demand. How will you take into account the effect of these variations in consumption while designing the following units for water treatment ? Filter units
Pumping units
Distribution mains
Sedimentation tank
Clear water reservoirs Demonstrate your design values for a town with a design population of 15000 and average per capita demand of 270 litres per capita per day for these units. 10 marks
Determine the theoretical oxygen demand (ThOD) for glycine [CH₂(NH₂)COOH] using the following assumptions : In the first step, the organic carbon and nitrogen are converted to carbon dioxide and ammonia respectively.
In the second and third steps, ammonia is oxidized sequentially to nitrite and nitrate. The ThOD is the sum of the oxygen required for all three steps. 10 marks
हिंदी में प्रश्न पढ़ें
बाढ़ जलालेख (हाइड्रोग्राफ) एवं संहति (मास) वक्र में क्या अंतर है ? एक बाँध स्थल पर नदी के निम्नलिखित आँकड़ों का उपयोग करके, एक बाढ़ जलालेख बनाइए और उसे आलेखित कीजिए तथा नदी में न्यूनतम और अधिकतम निस्सरण के मानों को ज्ञात कीजिए ।
माह | प्रवाह (m³/s) जनवरी | 110 फरवरी | 120 मार्च | 130 अप्रैल | 140 मई | 150 जून | 160 जुलाई | 180 अगस्त | 210 सितम्बर | 170 अक्टूबर | 140 नवम्बर | 110 दिसम्बर | 100 (10 अंक)
एक जलग्रहण क्षेत्र में छह वर्षामापी स्टेशन हैं । एक वर्ष में इन वर्षामापियों द्वारा दर्ज की गई वार्षिक वर्षा निम्नलिखित है :
स्टेशन | A | B | C | D | E | F वर्षा (सेमी) | 82·7 | 102·9 | 180·3 | 110·3 | 95·8 | 136·70
मौजूदा वर्षामापियों के सेट में औसत वर्षा के आकलन में मानक त्रुटि निर्धारित कीजिए ।
औसत वर्षा के आकलन में 10% की त्रुटि के लिए, जलग्रहण क्षेत्र में वर्षामापी स्टेशनों की इष्टतम संख्या की गणना कीजिए । (10 अंक)
30 सेमी व्यास का एक कुआँ, स्थिर भौम जल-स्तर से 25 मीटर नीचे तक अंतर्वेशन करता है । 5400 लीटर प्रति मिनट की दर से 24 घटे तक पंपिंग करने के बाद, 90 मीटर की दूरी पर स्थित एक परीक्षण कुँए में भौम जल-स्तर 0·53 मीटर नीचे चला जाता है, और 30 मीटर की दूरी पर स्थित एक अन्य कुँए में भौम जल-स्तर में 1·11 मीटर की गिरावट आती है । इस जलवाही स्तर (एक्विफर) की पारगम्यता (ट्रांसमिसिविटी) क्या है ? (10 अंक)
जल आपूर्ति प्रणाली में कई इकाइयाँ होती हैं, और प्रत्येक इकाई का अभिकल्पन जल की माँग में होने वाले बदलावों के अनुरूप होना चाहिए । जल उपचार के लिए निम्नलिखित इकाइयों के अभिकल्पन के लिए खपत में होने वाले इन बदलावों के प्रभाव को किस प्रकार ध्यान में रखेंगे ? फिल्टर इकाइयाँ
पंपिंग इकाइयाँ
मुख्य वितरण लाइन
अवसादन टंकी
स्वच्छ जल कुंड 15000 की अभिकल्पित जनसंख्या एवं 270 लीटर प्रति व्यक्ति प्रतिदिन की औसत जल माँग वाले एक शहर के लिए, इन इकाइयों हेतु अपने अभिकल्पित मानों की गणना कीजिए । (10 अंक)
निम्नलिखित मान्यताओं का उपयोग करके ग्लाइसिन [CH₂(NH₂)COOH] के लिए सैद्धांतिक ऑक्सीजन माँग (ThOD) का निर्धारण कीजिए : पहले चरण में, कार्बनिक कार्बन और नाइट्रोजन क्रमशः कार्बन डाइऑक्साइड और अमोनिया में परिवर्तित हो जाते हैं ।
दूसरे एवं तीसरे चरण में, अमोनिया क्रमिक रूप से नाइट्राइट और नाइट्रेट में ऑक्सीकृत हो जाती है । सैद्धांतिक ऑक्सीजन माँग, इन तीनों चरणों के लिए आवश्यक ऑक्सीजन का योग है । (10 अंक)
Model answer
Drafted with AI by UPSC Answer Check against this question's marking rubric, to the expected length. UPSC does not publish answers for Mains — this is one way to score well, not an official key. How we build rubrics and answers.
(a) Hydrograph and mass curve; plotting the river flow (10 marks)
Difference. A hydrograph is a plot of discharge (flow rate, in m³/s) against time; its ordinates are rates of flow, and it shows the peak, the minimum and the timing of the flow. A mass curve is a plot of the cumulative volume of flow against time, so it is the integral of the hydrograph. Its slope at any time is the discharge, and it is used to find the storage a reservoir needs (Rippl's method), while the hydrograph is used to find flood peaks and the design flood.
Plot. The monthly discharges are plotted against the months, January to December, with the discharge (m³/s) on the vertical axis and the months on the horizontal axis, and the points joined by a smooth line.

Reading the hydrograph. The flow rises from 110 m³/s in January to a peak in August, and then falls steadily to December.
- The maximum discharge is 210 m³/s, in August.
- The minimum discharge is 100 m³/s, in December.
The mean flow is 1720/12 = 143.3 m³/s.
(b) Rain-gauge network: standard error and optimum number of gauges (10 marks)
Statistics. Mean rainfall x̄ = (82.7 + 102.9 + 180.3 + 110.3 + 95.8 + 136.7)/6 = 708.7/6 = 118.1 cm.
Standard deviation σ = √[Σ(x − x̄)²/(n − 1)] = 35.4 cm
Coefficient of variation C_v = 100σ/x̄ = 100 × 35.4/118.1 = 29.9%
(b)(i) Standard error of the estimated mean. With N = 6 gauges,
ε = C_v/√N = 29.9/√6 = 12.2%
(b)(ii) Optimum number of gauges for a 10% error.
N = (C_v/e)² = (29.9/10)² = 8.97 ≈ 9 gauges
So 3 more gauges are needed in addition to the existing 6.
(c) Permeability and transmissivity from a pumping test (10 marks)
The aquifer is unconfined and the flow is steady, so the Thiem equation for an unconfined aquifer applies:
Q = πK(h₂² − h₁²)/ln(r₂/r₁)
Data: Q = 5400 l/min = 0.09 m³/s. The saturated thickness before pumping is 25 m, and the well is assumed to reach the impervious base. Drawdowns of 1.11 m at r₁ = 30 m and 0.53 m at r₂ = 90 m give the water depths h₁ = 25 − 1.11 = 23.89 m and h₂ = 25 − 0.53 = 24.47 m.
h₂² − h₁² = 598.8 − 570.7 = 28.05 m²
K = Q ln(r₂/r₁)/[π(h₂² − h₁²)] = 0.09 × ln 3/(π × 28.05) = 0.09 × 1.0986/88.12 = 1.12 × 10⁻³ m/s
Coefficient of permeability K ≈ 1.12 × 10⁻³ m/s ≈ 97 m/day.
Transmissivity T = K × b = 1.12 × 10⁻³ × 25 = 0.0281 m²/s
T ≈ 0.028 m²/s ≈ 2420 m²/day.
(d) Design of water supply units for demand variations (10 marks)
Demand variations. The average demand is 15 000 × 270 = 4 050 000 l/day = 4050 m³/day = 168.75 m³/h. The maximum daily demand is 1.8 × average = 7290 m³/day = 303.75 m³/h (0.0844 m³/s). The maximum hourly demand is 1.5 × the maximum day's average hourly demand = 2.7 × average hourly = 455.6 m³/h (126.6 l/s).
- (i) Filter units. They are designed for the maximum daily demand, because the plant must meet the demand of the peak day, and it works at a steady rate through the day. Design flow = 7290 m³/day (303.75 m³/h). At an assumed filtration rate of 5 m/h, the filter area is 303.75/5 ≈ 61 m², plus a stand-by unit and 3–5% for backwash water.
- (ii) Pumping units. They are designed for the maximum daily demand, spread over the pumping hours. In 24 hours of pumping, the capacity is 303.75 m³/h (84.4 l/s); if pumping runs for 16 hours, it is 7290/16 = 455.6 m³/h (126.6 l/s). The hourly fluctuation is met from the storage, not by the pumps.
- (iii) Distribution mains. They are designed for the maximum hourly demand of the maximum day, because the mains have to carry the peak flow when the demand is greatest (with a check for the fire demand). Design flow = 455.6 m³/h = 126.6 l/s.
- (iv) Sedimentation tank. It is designed for the maximum daily demand, since the detention time must be provided at the highest flow of the day. With flow 303.75 m³/h and an assumed detention time of 2.5 h, the volume is 303.75 × 2.5 ≈ 760 m³.
- (v) Clear water reservoir. It is designed for the hourly variation, because it balances the constant rate of supply from the plant against the varying demand, and holds the fire and emergency reserve. As a rule of thumb, take about one-third of the maximum daily demand: 7290/3 ≈ 2430 m³.
(e) Theoretical oxygen demand of glycine (10 marks)
Glycine, CH₂(NH₂)COOH, is C₂H₅NO₂ with molar mass 2 × 12 + 5 × 1 + 14 + 2 × 16 = 75 g/mol.
Step 1, carbon oxidised to CO₂ and nitrogen released as NH₃.
C₂H₅NO₂ + 1.5 O₂ → 2 CO₂ + H₂O + NH₃
Step 2, ammonia to nitrite.
NH₃ + 1.5 O₂ → NO₂⁻ + H⁺ + H₂O
Step 3, nitrite to nitrate.
NO₂⁻ + 0.5 O₂ → NO₃⁻
Sum. C₂H₅NO₂ + 3.5 O₂ → 2 CO₂ + 2 H₂O + NO₃⁻ + H⁺
The oxygen required is 1.5 + 1.5 + 0.5 = 3.5 mol O₂ per mol of glycine.
ThOD = 3.5 × 32 = 112 g O₂ per mole of glycine. Per gram of glycine, ThOD = 112/75 = 1.49 g O₂/g glycine, made up of 0.64 g/g for the carbonaceous stage (Step 1) and 0.85 g/g for the nitrogenous stages (Steps 2 and 3).
How this answer will be evaluated
Evaluation rubric
Each sub-part is marked on its own, against the marks and word limit printed on the paper.
- (a) Distinguish a flood hydrograph from a mass curve, plot the hydrograph from the monthly discharges and read off the minimum and maximum discharges. 10 marks
Must cover
- Hydrograph: discharge against time; mass curve: cumulative volume against time (its integral, slope = discharge)
- Hydrograph plotted with axes labelled and the points joined
- Maximum 210 m³/s in August and minimum 100 m³/s in December
Loses marks
- Plotting cumulative volume instead of discharge.
- Swapping the definitions of the two curves.
- Reading the maximum or minimum wrongly.
Earns more
- Uses: hydrograph for peaks and the design flood; mass curve for reservoir storage (Rippl).
- Mean flow 143.3 m³/s.
Extra mark
- Estimate of the annual runoff volume from the mean flow
- (b) Find (i) the standard error in the estimate of mean rainfall from the six gauges and (ii) the optimum number of gauges for a 10% error. 10 marks
Must cover
- Mean 118.1 cm, standard deviation 35.4 cm (n − 1 divisor), C_v = 29.9%
- Standard error ε = C_v/√N = 12.2%
- N = (C_v/e)² = 8.97, so about 9 gauges (3 more)
Loses marks
- Using the population standard deviation without stating it.
- Using C_v as a fraction in N = (C_v/e)² inconsistently.
- Answering N = 9 with no working.
Earns more
- Sample standard deviation used.
- Rounding up to a whole number of gauges.
Extra mark
- Comment on the wide spread caused by gauge C (180.3 cm)
- (c) From the steady pumping test on the unconfined aquifer find the coefficient of permeability and the transmissivity. 10 marks
Must cover
- Thiem equation for an unconfined aquifer Q = πK(h₂² − h₁²)/ln(r₂/r₁)
- h₁ = 23.89 m and h₂ = 24.47 m (thickness 25 m less drawdown), Q = 0.09 m³/s
- K ≈ 1.12 × 10⁻³ m/s (about 97 m/day)
- T = K b ≈ 0.028 m²/s (about 2420 m²/day)
Loses marks
- Using the confined-aquifer formula with drawdowns.
- Using drawdowns in place of water depths.
- Leaving Q in l/min against metres and seconds.
Earns more
- Units converted correctly (l/min to m³/s).
- Assumptions stated: well penetrates the full thickness, steady state.
Extra mark
- Comment that the value suggests a coarse sand or gravel aquifer
- (d) State which demand variation governs each of the five units and why, and work out the design values for 15 000 persons at 270 lpcd. 10 marks
Must cover
- Average demand 4050 m³/day; maximum daily 1.8 × average = 7290 m³/day; peak hourly 2.7 × average hourly = 455.6 m³/h
- Filters, sedimentation tank and pumps: maximum daily demand, with reasons
- Distribution mains: maximum hourly demand of the maximum day
- Clear water reservoir: hourly variation (balancing) and reserve, about one-third of the daily demand
Loses marks
- Designing the filters for the average demand.
- Designing the mains for the average daily demand.
- Giving the variations with no numbers.
Earns more
- Design values for each unit (filter area, tank volume, pump capacity, reservoir capacity).
- Assumed data (filtration rate, detention time) stated.
Extra mark
- Fire demand check for the mains
- (e) Write and balance the three oxidation steps for glycine, sum the oxygen and express the ThOD per mole and per gram. 10 marks
Must cover
- Step 1: C₂H₅NO₂ + 1.5 O₂ → 2 CO₂ + H₂O + NH₃
- Steps 2 and 3: NH₃ + 1.5 O₂ → NO₂⁻ + H⁺ + H₂O, and NO₂⁻ + 0.5 O₂ → NO₃⁻
- Total 3.5 mol O₂ per mol of glycine = 112 g
- ThOD = 112/75 = 1.49 g O₂/g glycine
Loses marks
- Stopping at the carbonaceous demand only (1.5 mol).
- Wrong molar mass of glycine.
- Equations left unbalanced.
Earns more
- Each equation balanced in atoms and charge.
- Split into carbonaceous (0.64) and nitrogenous (0.85 g/g) demand.
Extra mark
- Overall balanced equation for the full oxidation
What "Construct" is asking you to do
Build the required object — a velocity diagram, a sequential test, a control chart, a geometrical figure — step by step, so the sequence is visible on the page. The steps are marked, not only the finished thing.
Structure that answers it
Data and requirement → scale or basis chosen, stated → construction steps in order → the finished construction, labelled → quantities read off, or the result it yields
Where marks are lost
A diagram drawn without a stated scale, so nothing can be scaled off it and the quantities that follow lose their support. In statistics, writing down the procedure without fixing its defining constants — stopping bounds in terms of the two error probabilities, or the control limits — leaves it unmarkable.
Practice this exact question
Write your answer and it is marked point by point against the model answer above — what you covered, what you missed, what you got wrong.
Evaluate my answer →More from Civil Engineering 2026 Paper II
- Q2 (a) A vertical curve is formed when a descending gradient of 0·5% meets another descendin…
- Q3 (a) What do you understand by a Gantt or Bar chart with respect to construction project m…
- Q4 (a) What do you understand by the effective CBR value ? Discuss its significance. How is…
- Q5 (a) What is the difference between a flood hydrograph and a mass curve ? Using the follow…
- Q6 (a) The following information is available regarding the relationship between trap effici…
- Q7 (a) A sedimentation tank is treating 5 million litres of sewage per day containing 250 pp…
- Q8 (a) (i) Explain Lacey's silt factor. If the value of this factor is 1.0, what does it ind…