Paper I — Q4
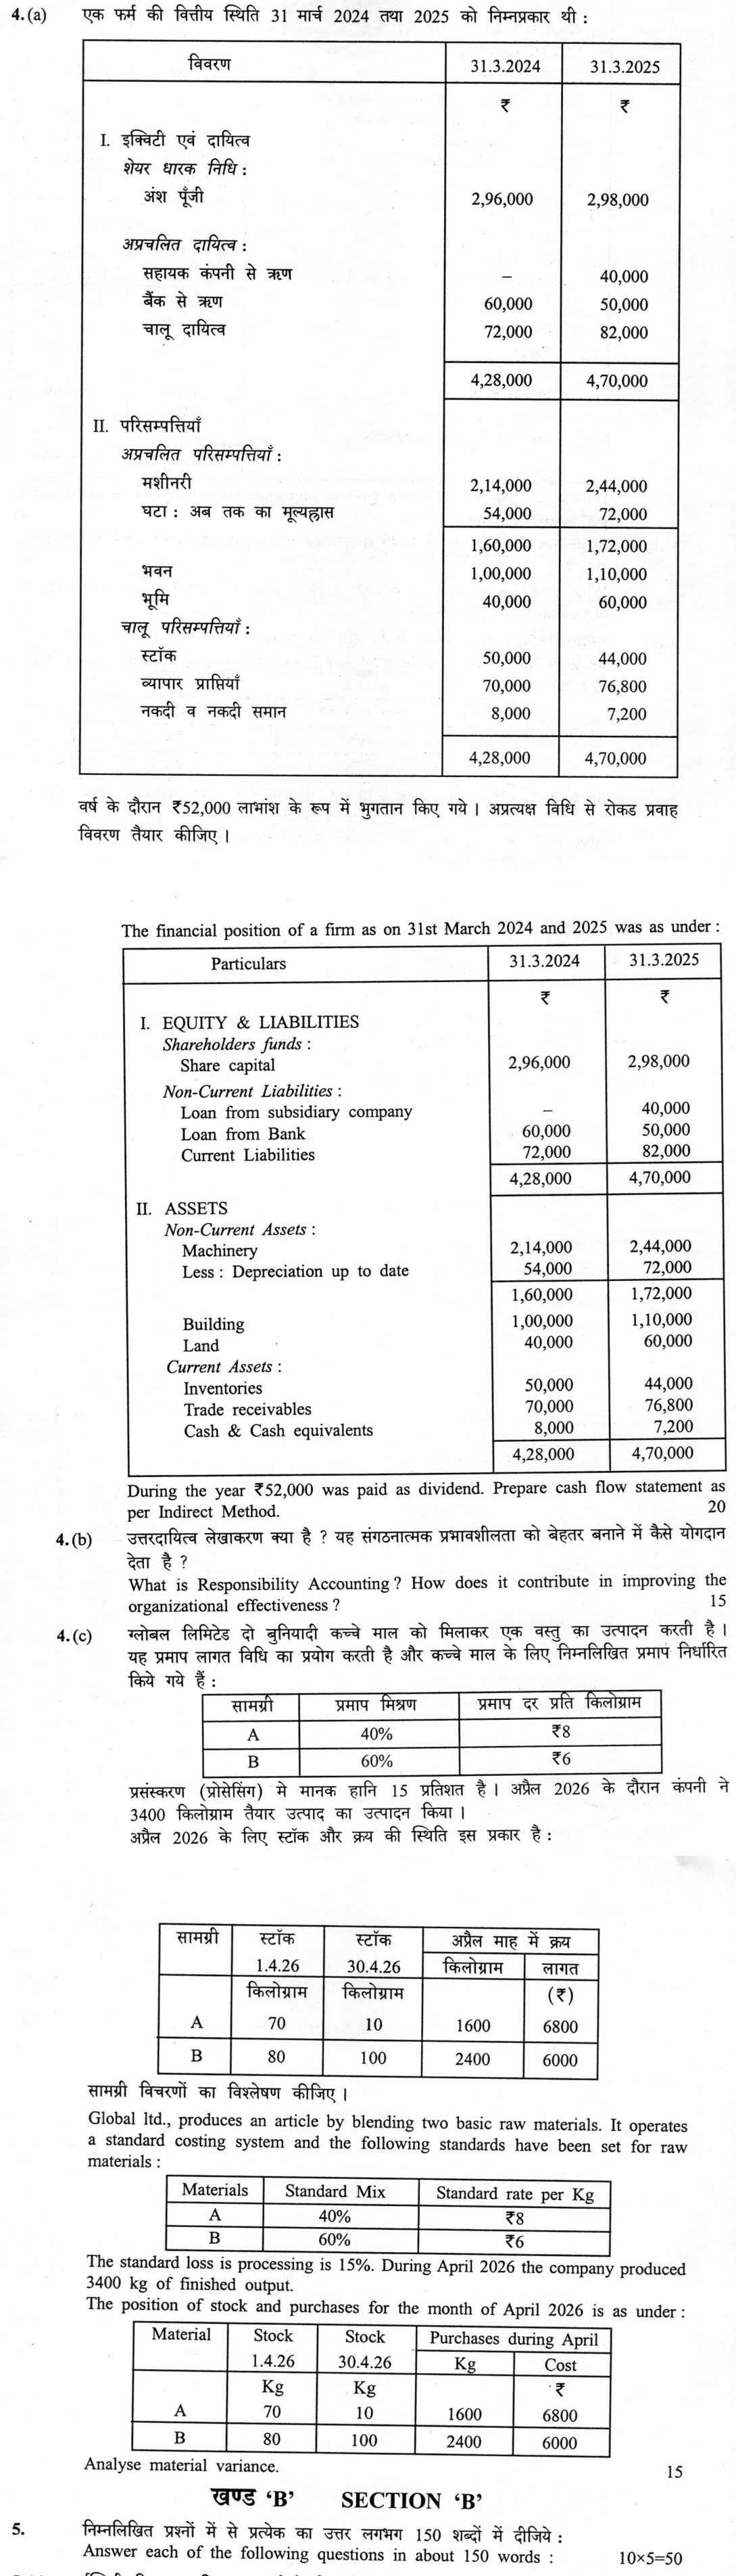
(a) The financial position of a firm as on 31st March 2024 and 2025 was as follows : Particulars | 31.3.2024 | 31.3.2025 ₹ |…
The financial position of a firm as on 31st March 2024 and 2025 was as follows :
Particulars | 31.3.2024 | 31.3.2025 ₹ | ₹ I. Equity and Liabilities Shareholders' Funds : Share Capital — 2,96,000 | 2,98,000 Non-current Liabilities : Loan from Subsidiary Company — – | 40,000 Loan from Bank — 60,000 | 50,000 Current Liabilities — 72,000 | 82,000 4,28,000 | 4,70,000 II. Assets Non-current Assets : Machinery — 2,14,000 | 2,44,000 Less : Depreciation till date — 54,000 | 72,000 1,60,000 | 1,72,000 Building — 1,00,000 | 1,10,000 Land — 40,000 | 60,000 Current Assets : Stock — 50,000 | 44,000 Trade Receivables — 70,000 | 76,800 Cash and Cash Equivalents — 8,000 | 7,200 4,28,000 | 4,70,000
During the year ₹52,000 was paid as dividend. Prepare Cash Flow Statement by indirect method. The financial position of a firm as on 31st March 2024 and 2025 was as under : Particulars | 31.3.2024 (₹) | 31.3.2025 (₹) I. EQUITY & LIABILITIES Shareholders funds : Share capital — 2,96,000 | 2,98,000 Non-Current Liabilities : Loan from subsidiary company — – | 40,000; Loan from Bank — 60,000 | 50,000; Current Liabilities — 72,000 | 82,000; Total — 4,28,000 | 4,70,000 II. ASSETS Non-Current Assets : Machinery — 2,14,000 | 2,44,000; Less : Depreciation up to date — 54,000 | 72,000; 1,60,000 | 1,72,000; Building — 1,00,000 | 1,10,000; Land — 40,000 | 60,000 Current Assets : Inventories — 50,000 | 44,000; Trade receivables — 70,000 | 76,800; Cash & Cash equivalents — 8,000 | 7,200; 4,28,000 | 4,70,000 During the year ₹52,000 was paid as dividend. Prepare cash flow statement as per Indirect Method. 20 marks
What is Responsibility Accounting ? How does it contribute in improving the organizational effectiveness ? 15 marks
Global ltd., produces an article by blending two basic raw materials. It operates a standard costing system and the following standards have been set for raw materials : Materials | Standard Mix | Standard rate per Kg A | 40% | ₹8 B | 60% | ₹6 The standard loss is processing is 15%. During April 2026 the company produced 3400 kg of finished output. The position of stock and purchases for the month of April 2026 is as under : Material | Stock 1.4.26 Kg | Stock 30.4.26 Kg | Purchases during April — Kg | Cost ₹ A | 70 | 10 | 1600 | 6800 B | 80 | 100 | 2400 | 6000 Analyse material variance. 15 marks
हिंदी में प्रश्न पढ़ें
एक फर्म की वित्तीय स्थिति 31 मार्च 2024 तथा 2025 को निम्नप्रकार थी :
विवरण | 31.3.2024 | 31.3.2025 ₹ | ₹ I. इक्विटी एवं दायित्व शेयर धारक निधि : अंश पूँजी — 2,96,000 | 2,98,000 गैर-चालू दायित्व : सहायक कंपनी से ऋण — – | 40,000 बैंक से ऋण — 60,000 | 50,000 चालू दायित्व — 72,000 | 82,000 4,28,000 | 4,70,000 II. परिसम्पत्तियाँ गैर-चालू परिसम्पत्तियाँ : मशीनरी — 2,14,000 | 2,44,000 घटा : अब तक का मूल्यह्रास — 54,000 | 72,000 1,60,000 | 1,72,000 भवन — 1,00,000 | 1,10,000 भूमि — 40,000 | 60,000 चालू परिसम्पत्तियाँ : स्टॉक — 50,000 | 44,000 व्यापार प्राप्तियाँ — 70,000 | 76,800 नकदी व नकदी समान — 8,000 | 7,200 4,28,000 | 4,70,000
वर्ष के दौरान ₹52,000 लाभांश के रूप में भुगतान किए गए । अप्रत्यक्ष विधि से रोकड़ प्रवाह विवरण तैयार कीजिए । 31 मार्च 2024 और 2025 को एक फर्म की वित्तीय स्थिति निम्नलिखित थी : विवरण | 31.3.2024 (₹) | 31.3.2025 (₹) I. अंशधारक निधि एवं देयताएँ अंशधारक निधि : अंश पूँजी — 2,96,000 | 2,98,000 गैर-चालू देयताएँ : सहायक कंपनी से ऋण — – | 40,000; बैंक से ऋण — 60,000 | 50,000; चालू देयताएँ — 72,000 | 82,000; कुल — 4,28,000 | 4,70,000 II. परिसंपत्तियाँ गैर-चालू परिसंपत्तियाँ : मशीनरी — 2,14,000 | 2,44,000; घटाइए : आज तक का ह्रास — 54,000 | 72,000; 1,60,000 | 1,72,000; भवन — 1,00,000 | 1,10,000; भूमि — 40,000 | 60,000 चालू परिसंपत्तियाँ : भंडार — 50,000 | 44,000; व्यापार प्राप्य — 70,000 | 76,800; रोकड़ एवं रोकड़ समतुल्य — 8,000 | 7,200; 4,28,000 | 4,70,000 वर्ष के दौरान ₹52,000 लाभांश के रूप में भुगतान किया गया। अप्रत्यक्ष विधि के अनुसार रोकड़ प्रवाह विवरण तैयार कीजिए। (20 अंक)
उत्तरदायित्व लेखांकन क्या है ? यह संगठनात्मक प्रभावशीलता को बेहतर बनाने में कैसे योगदान देता है ? (15 अंक)
ग्लोबल लिमिटेड दो बुनियादी कच्चे माल को मिलाकर एक वस्तु का उत्पादन करती है । यह प्रमाप लागत विधि का प्रयोग करती है और कच्चे माल के लिए निम्नलिखित प्रमाप निर्धारित किये गये हैं : सामग्री | प्रमाप मिश्रण | प्रमाप दर प्रति किलोग्राम A | 40% | ₹8 B | 60% | ₹6 प्रसंस्करण (प्रोसेसिंग) मे मानक हानि 15 प्रतिशत है । अप्रैल 2026 के दौरान कंपनी ने 3400 किलोग्राम तैयार उत्पाद का उत्पादन किया । अप्रैल 2026 के लिए स्टॉक और क्रय की स्थिति इस प्रकार है : सामग्री | स्टॉक 1.4.26 किलोग्राम | स्टॉक 30.4.26 किलोग्राम | अप्रैल माह में क्रय — किलोग्राम | लागत (₹) A | 70 | 10 | 1600 | 6800 B | 80 | 100 | 2400 | 6000 सामग्री विचरणों का विश्लेषण कीजिए । (15 अंक)
Model answer
Drafted with AI by UPSC Answer Check against this question's marking rubric, to the expected length. UPSC does not publish answers for Mains — this is one way to score well, not an official key. How we build rubrics and answers.
(a) Cash Flow Statement (Indirect Method) for the year ended 31 March 2025
Working notes: (W1) The firm shows no separate reserves, so the ₹2,000 rise in share capital is retained profit; net profit = 2,000 + dividend 52,000 = ₹54,000. (W2) Depreciation for the year = 72,000 − 54,000 = ₹18,000 (no machinery sold). (W3) Purchase of machinery = gross block 2,44,000 − 2,14,000 = ₹30,000.
| Particulars | ₹ | ₹ |
|---|---|---|
| A. Operating activities | ||
| Net profit (W1) | 54,000 | |
| Add: depreciation (W2) | 18,000 | |
| Operating profit before working capital changes | 72,000 | |
| Add: decrease in inventories | 6,000 | |
| Less: increase in trade receivables | (6,800) | |
| Add: increase in current liabilities | 10,000 | |
| Net cash from operating activities | 81,200 | |
| B. Investing activities | ||
| Purchase of machinery (W3) | (30,000) | |
| Purchase of building | (10,000) | |
| Purchase of land | (20,000) | |
| Net cash used in investing activities | (60,000) | |
| C. Financing activities | ||
| Loan from subsidiary company | 40,000 | |
| Repayment of bank loan | (10,000) | |
| Dividend paid | (52,000) | |
| Net cash used in financing activities | (22,000) | |
| Net decrease in cash and cash equivalents (A + B + C) | (800) | |
| Add: opening cash and cash equivalents | 8,000 | |
| Closing cash and cash equivalents | 7,200 |
The statement follows AS 3 (Ind AS 7 gives the same result); income tax is ignored as no data are given.
(b) What is Responsibility Accounting ? How does it contribute in improving the organizational effectiveness ?
Responsibility accounting divides an organisation into responsibility centres, each headed by a manager accountable for the costs, revenues or investment under his control, and reports actual performance against budget for each centre:
- Cost centre: accountable for costs (e.g., a production department), judged by cost variances.
- Revenue centre: accountable for sales (e.g., a sales region).
- Profit centre: accountable for revenue and cost, hence profit (e.g., a product division).
- Investment centre: accountable for profit and capital employed, judged by ROI, residual income or EVA.
Its core rule is the controllability principle: managers are judged only on items they can control.
How it improves organisational effectiveness:
- Clear accountability: every cost and revenue is traced to a named manager, so authority matches responsibility.
- Management by exception: pyramidal responsibility reports compare actual with budget at each level, so top management attends only to significant variances and corrective action is quicker.
- Motivation and goal congruence: participative budgets and measures such as residual income or EVA align divisional decisions with corporate goals and support performance-linked rewards.
- Decentralisation: decisions are taken close to operations while the centre retains control.
- Better planning: centre-wise data guide resource allocation and reveal weak segments.
Limitations: separating controllable from common costs is hard; ROI can cause sub-optimisation, as a division rejects projects that lower its ROI but add value; budget slack and transfer-pricing disputes arise. Non-financial measures such as a balanced scorecard are therefore needed alongside.
(c) Analysis of material variances, Global Ltd., April 2026
Standard input for 3,400 kg of output = 3,400 ÷ 0.85 = 4,000 kg (A 1,600 kg, B 2,400 kg). Standard cost = 1,600 × 8 + 2,400 × 6 = 12,800 + 14,400 = ₹27,200, i.e. ₹8 per kg of output.
Actual consumption = opening stock + purchases − closing stock: A 70 + 1,600 − 10 = 1,660 kg; B 80 + 2,400 − 100 = 2,380 kg; total 4,040 kg. Actual price (opening stock assumed at the April purchase price): A 6,800 ÷ 1,600 = ₹4.25; B 6,000 ÷ 2,400 = ₹2.50. Actual cost = 7,055 + 5,950 = ₹13,005. Revised standard quantity (actual input in standard mix): A 1,616 kg, B 2,424 kg.
| Variance | Material A (₹) | Material B (₹) | Total (₹) |
|---|---|---|---|
| Price: AQ × (SP − AP) | 1,660 × 3.75 = 6,225 F | 2,380 × 3.50 = 8,330 F | 14,555 F |
| Mix: SP × (RSQ − AQ) | 8 × (1,616 − 1,660) = 352 A | 6 × (2,424 − 2,380) = 264 F | 88 A |
| Yield: SP × (SQ − RSQ) | 8 × (1,600 − 1,616) = 128 A | 6 × (2,400 − 2,424) = 144 A | 272 A |
| Usage: SP × (SQ − AQ) | 8 × (1,600 − 1,660) = 480 A | 6 × (2,400 − 2,380) = 120 F | 360 A |
| Cost: SC − AC | 12,800 − 7,055 = 5,745 F | 14,400 − 5,950 = 8,450 F | 14,195 F |
Yield check: standard output from 4,040 kg = 3,434 kg; (3,434 − 3,400) × ₹8 = ₹272 A.
Reconciliation: Mix 88 A + Yield 272 A = Usage 360 A; Price 14,555 F − Usage 360 A = Cost 14,195 F.
The large favourable price variance means actual prices were far below standard (cheaper buying or out-of-date standards), while the excess use of the costlier material A and the yield shortfall call for a review of production.
How this answer will be evaluated
Evaluation rubric
Each sub-part is marked on its own, against the marks and word limit printed on the paper.
- (a) Prepare a Cash Flow Statement by the INDIRECT method (AS 3 / Ind AS 7) from two comparative balance sheets, given that Rs 52,000 was paid as dividend during the year. Because no profit figure is given, the net profit must first be derived from the movement in shareholders' funds, and the three activity classifications - operating, investing and financing - must each be shown and must reconcile to the Rs 800 fall in cash. 20 marks
Must cover
- Net profit Rs 54,000 (balancing figure from shareholders' funds plus dividend)
- Depreciation added back Rs 18,000
- Operating profit before working capital changes Rs 72,000
- Net cash from operating activities Rs 81,200
- Purchase of machinery Rs 30,000; building Rs 10,000; land Rs 20,000
- Net cash used in investing activities Rs (60,000)
- Loan from subsidiary Rs 40,000; bank loan repaid Rs 10,000; dividend paid Rs 52,000
- Net cash used in financing activities Rs (22,000)
- Net decrease in cash Rs 800; opening Rs 8,000, closing Rs 7,200
- AS 3 / Ind AS 7 Statement of Cash Flows - indirect method
Loses marks
- Treating the Rs 2,000 rise in share capital as a fresh issue of shares shown under financing activities, while separately assuming some other profit figure - the Rs 2,000 is the residue of profit Rs 54,000 less dividend Rs 52,000 and must not be double counted
- Taking the increase in NET machinery (Rs 12,000) as the purchase instead of the increase in the GROSS block (Rs 30,000), and therefore omitting or understating depreciation
- Getting the sign of the working-capital adjustments wrong - a decrease in inventories is a source of cash and an increase in receivables is an application
- Classifying the dividend paid under operating activities, or the loan from the subsidiary company under investing activities
- Failing to reconcile to the actual Rs 800 decrease in cash, which is the built-in accuracy check for this question
Earns more
- Financing activities: loan from subsidiary company Rs 40,000 inflow, repayment of bank loan Rs 10,000 outflow, dividend paid Rs 52,000 outflow; net cash used in financing activities Rs (22,000)
- Reconciliation shown: net decrease in cash and cash equivalents Rs 800, opening Rs 8,000 and closing Rs 7,200, matching the balance sheet
- (b) Define responsibility accounting and then explain HOW it improves organisational effectiveness. The second half requires a causal argument - through responsibility centres, the controllability principle, performance reports, management by exception, goal congruence and motivation - not merely a list of advantages. 15 marks
Must cover
- Responsibility centre; cost centre, revenue centre, profit centre, investment centre
- Controllability principle - controllable versus uncontrollable costs
- Responsibility reporting; management by exception
- Budgetary control and variance analysis
- Return on Investment (ROI), Residual Income (RI), Economic Value Added (EVA)
- Transfer pricing
- Goal congruence; decentralisation; participative budgeting
- Sub-optimisation and dysfunctional behaviour; budget slack
- Balanced scorecard as a supplement
Loses marks
- Describing responsibility accounting as merely a cost-classification technique and omitting the responsibility-centre typology, which is the core of the answer
- Failing to state the controllability principle, so that the answer cannot explain why the reports motivate rather than demoralise
- Listing benefits ('better control', 'better decisions') without showing the mechanism - the exception report, the variance, the goal-congruence link - that the word 'how' demands
- Confusing a profit centre with an investment centre; the latter is accountable for the capital employed as well as for profit
- Ignoring the limitations, particularly sub-optimisation under ROI and the arbitrary apportionment of common costs
Earns more
- Mechanism of improvement: pyramidal responsibility reports comparing actual with budget at each level permit management by exception; timely variance feedback enables corrective action; participative budgeting and clear targets motivate managers and build goal congruence between divisional and corporate objectives; decentralisation with accountability speeds decisions and develops managerial talent; the data support resource allocation, performance-linked reward and identification of weak segments
- Limitations/caveats: difficulty in separating controllable from uncontrollable items and in apportioning common costs; sub-optimisation and short-termism when a manager maximises his own measure (the classic ROI defect that residual income and EVA address); budget slack and gaming; transfer-pricing disputes; and the need to supplement financial measures with non-financial ones such as a balanced scorecard
- (c) Analyse the material variances of Global Ltd for April 2026. 'Analyse' means compute and reconcile the full set: material cost variance, material price variance, material usage (quantity) variance and its split into mix and yield (sub-usage) variances, for each material and in total. Actual consumption has to be derived from opening stock plus purchases less closing stock, and the standard quantity from the 15% standard process loss. 15 marks
Must cover
- Standard input for 3,400 kg output = 4,000 kg (grossing up for 15% loss)
- Standard cost Rs 27,200; standard cost per kg of output Rs 8
- Actual consumption A 1,660 kg, B 2,380 kg, total 4,040 kg
- Actual prices A Rs 4.25 per kg, B Rs 2.50 per kg; actual cost Rs 13,005
- Material Cost Variance Rs 14,195 (F)
- Material Price Variance Rs 14,555 (F)
- Material Usage Variance Rs 360 (A)
- Material Mix Variance Rs 88 (A)
- Material Yield / Sub-usage Variance Rs 272 (A)
- Reconciliation: MPV + MUV = MCV; MMV + MYV = MUV
Loses marks
- Taking the standard input as 3,400 kg or as 3,400 x 1.15 = 3,910 kg instead of grossing up by dividing by 0.85 to get 4,000 kg
- Using the quantity PURCHASED (1,600 kg and 2,400 kg) as the actual quantity consumed instead of adjusting for opening and closing stocks
- Computing the price variance on the quantity purchased rather than on the quantity consumed without saying so - the two bases give different answers and the basis must be stated
- Computing the mix variance on the standard total input (4,000 kg) instead of the actual total input (4,040 kg), so that mix and yield no longer add back to the usage variance
- Failing to label each variance Favourable or Adverse, or failing to show the reconciliation, which is the essence of 'analyse the variances'
Earns more
- Material Usage Variance = SP (SQ - AQ): A Rs 480 Adverse and B Rs 120 Favourable, total Rs 360 Adverse
- Split of usage into Material Mix Variance Rs 88 Adverse (RSQ A 1,616 kg, B 2,424 kg on 4,040 kg actual input) and Material Yield/Sub-usage Variance Rs 272 Adverse (standard output from 4,040 kg = 3,434 kg against actual 3,400 kg, at Rs 8 per kg of output), with the reconciliation Price + Usage = Cost and Mix + Yield = Usage
What "Solve" is asking you to do
Choose the method, then carry it through to a final answer. Identifying what kind of problem this is and why that method applies is the first thing marked; a correct figure arrived at invisibly earns almost nothing.
Structure that answers it
Given data and what is required → method chosen, with the reason it applies → set-up (equation, circuit, free body, trial balance) → working, step by step → answer with units and any condition of validity
Where marks are lost
Doing the middle steps mentally and writing only the result. In mathematics papers, a further loss comes from giving a decimal where the exact value in surds or fractions was wanted, or from skipping the justification a part explicitly asks for.
Practice this exact question
Write your answer and it is marked point by point against the model answer above — what you covered, what you missed, what you got wrong.
Evaluate my answer →More from Commerce & Accountancy 2026 Paper I
- Q1 Answer the following questions in about 150 words each : (a) What is Profit-Volume ratio…
- Q2 (a) X ltd. and Y ltd. agreed to amalgamate and form a new company Z ltd. which will take…
- Q3 (a) Mr. A of Agra submits the following particulars of his let out residential house : (A…
- Q4 (a) The financial position of a firm as on 31st March 2024 and 2025 was as follows : Part…
- Q5 Answer each of the following questions in about 150 words : (a) Explain the CAPM approach…
- Q6 (a) Discuss the monetary policy of the Reserve Bank of India over the years. Explain the…
- Q7 (a) Using the following information, complete the Balance Sheet given below : Total Debt…